Window functions in Tableau

Time Series Analysis in Tableau

Chris Hui

VP of Product, Tracked
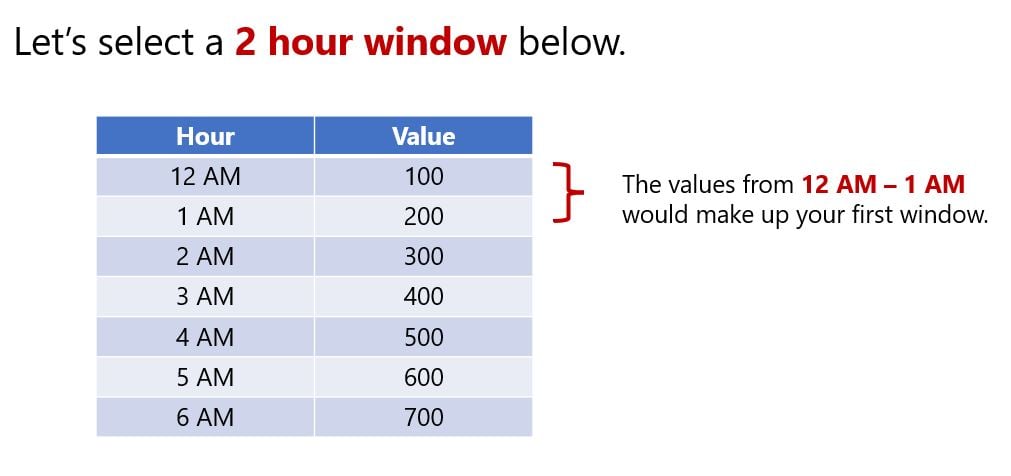
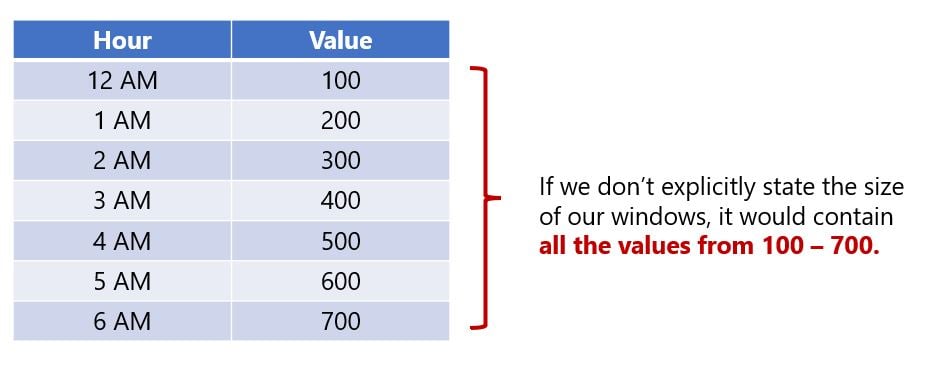
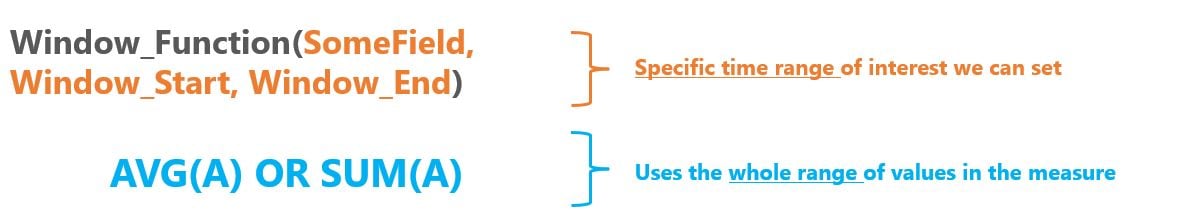
What is a window?

  • Windows refer to specific partitions you want to analyze
  • Used specifically as an argument for window functions
  • Window size is determined based off the start window and end window
  • Provided no start or end window is supplied, the entire measures range of values is treated as one window

Example table showing a window including 2 hours

Example table showing a window including no start or end time

Time Series Analysis in Tableau

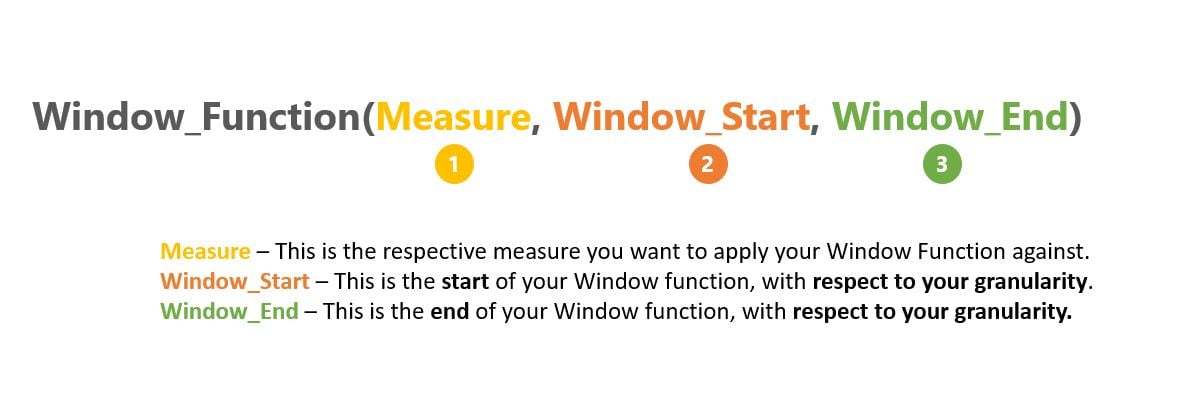
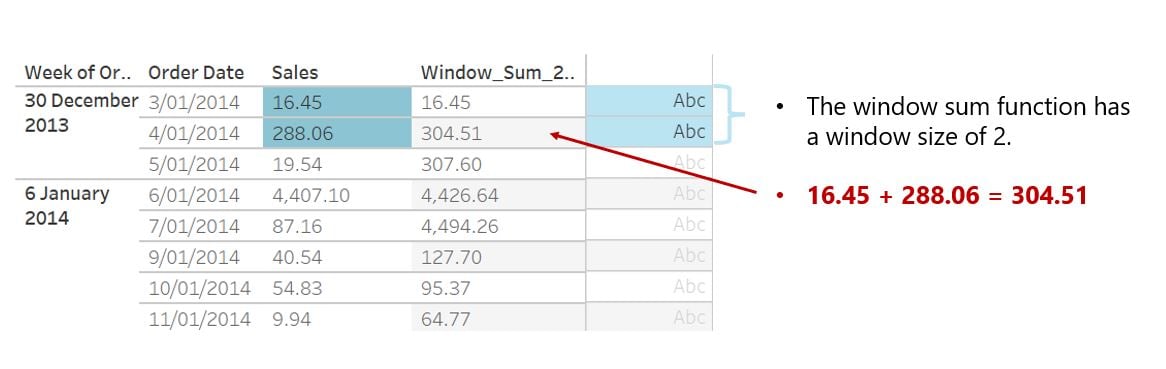
What is a window function?

Known as moving calculations that smooth data over specified time windows

  • Examples include: window sums, moving averages and moving standard deviations
  • Composed of a measure, start size, and end size

Time Series Analysis in Tableau

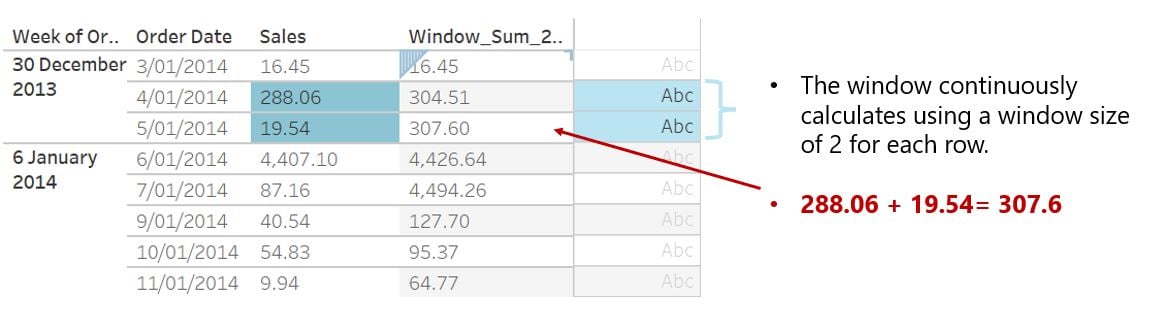
How does window sizing work?

  • Sizing of your window refers to the number of data points to be included
  • Once the window sizing is set, it applies this for each subsequent row wise calculation

Time Series Analysis in Tableau

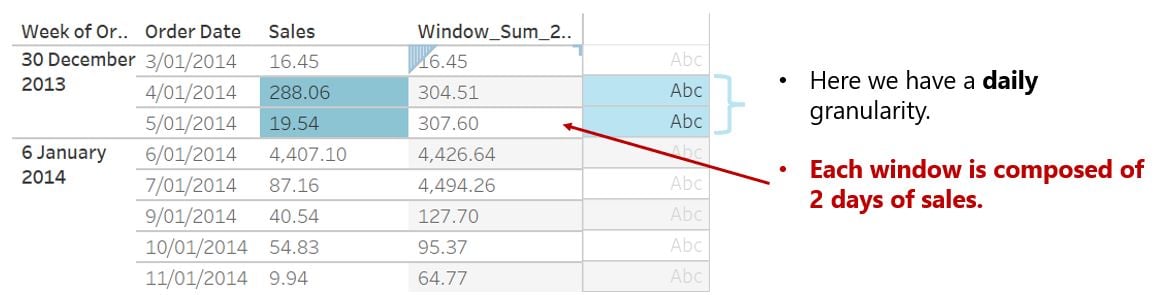
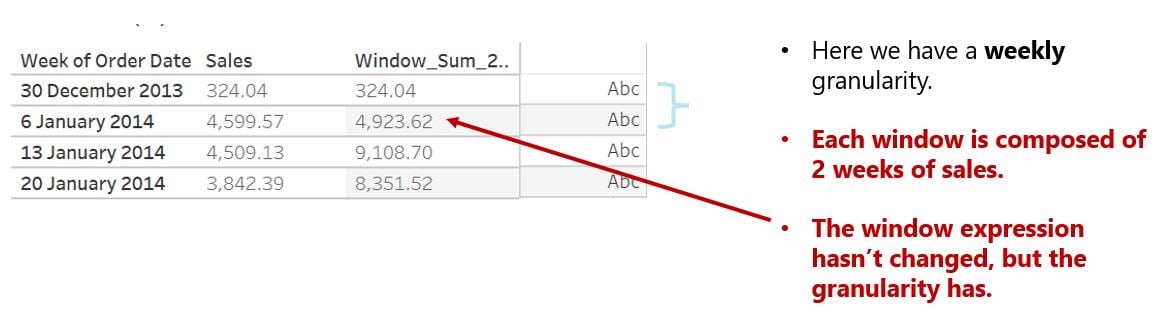
How does granularity impact window sizing?

  • Granularity directly impacts the result of window aggregation function
  • Aggregations are computed first, before window size

Window example showing a daily granularity spanning 2 days

Window example showing a weekly granularity spanning 2 weeks

Time Series Analysis in Tableau

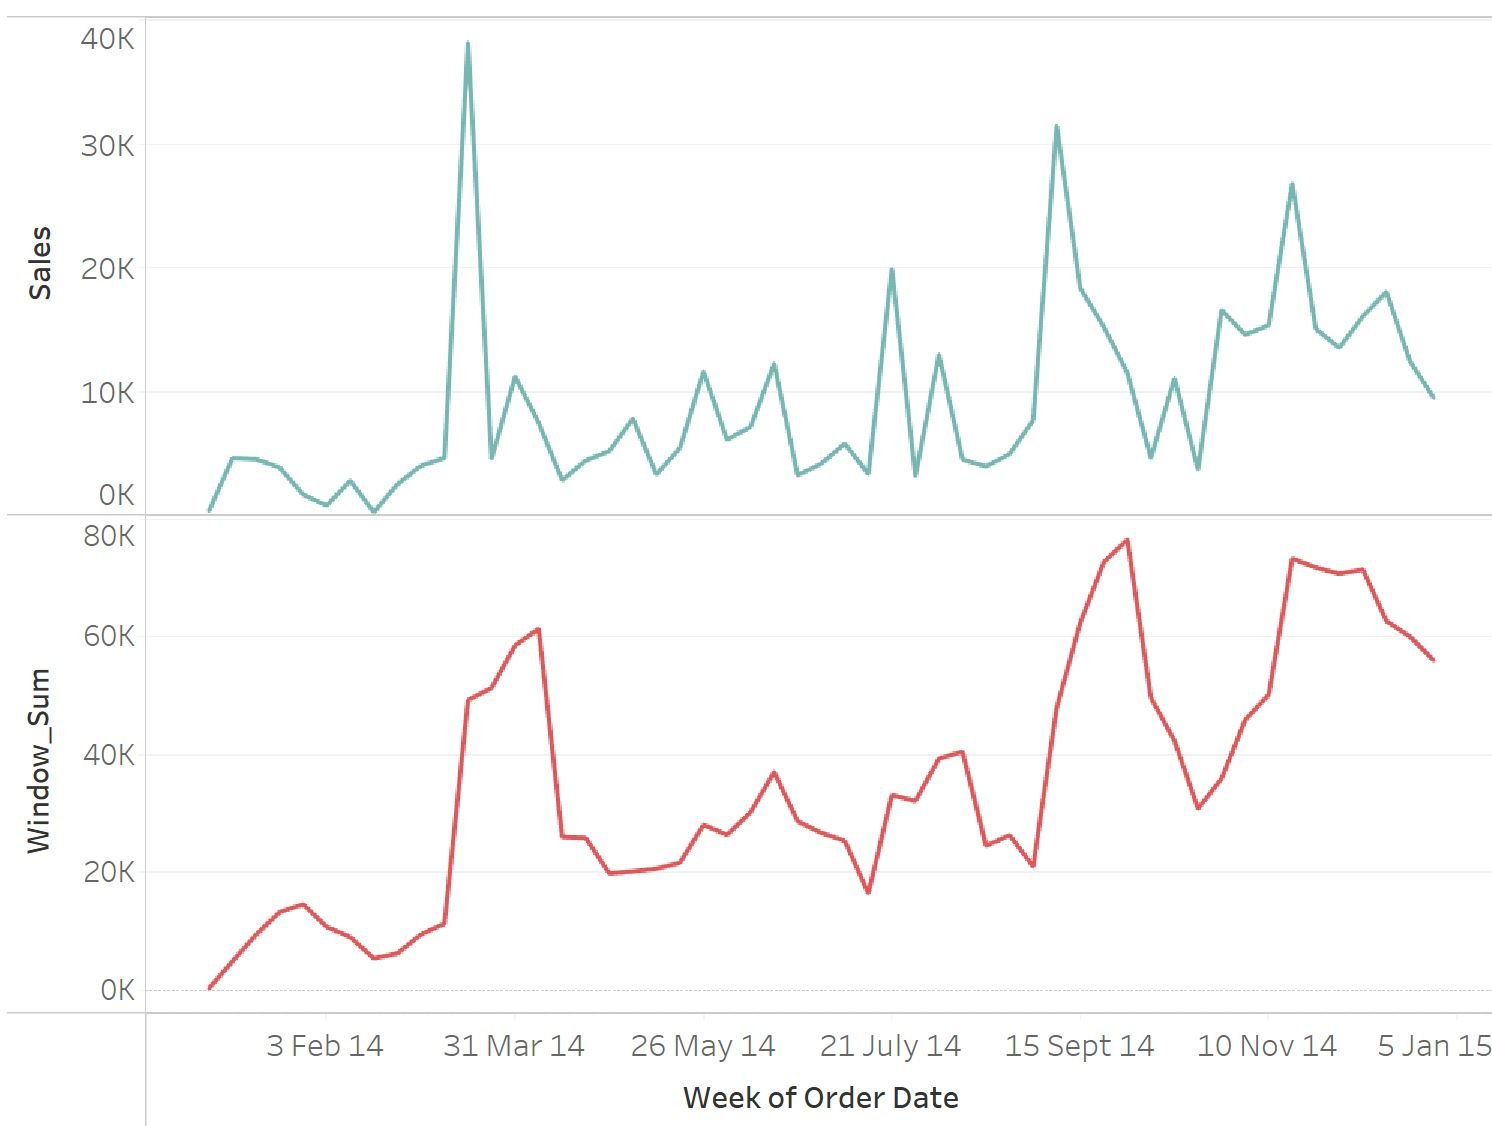
What's the purpose of a window function?
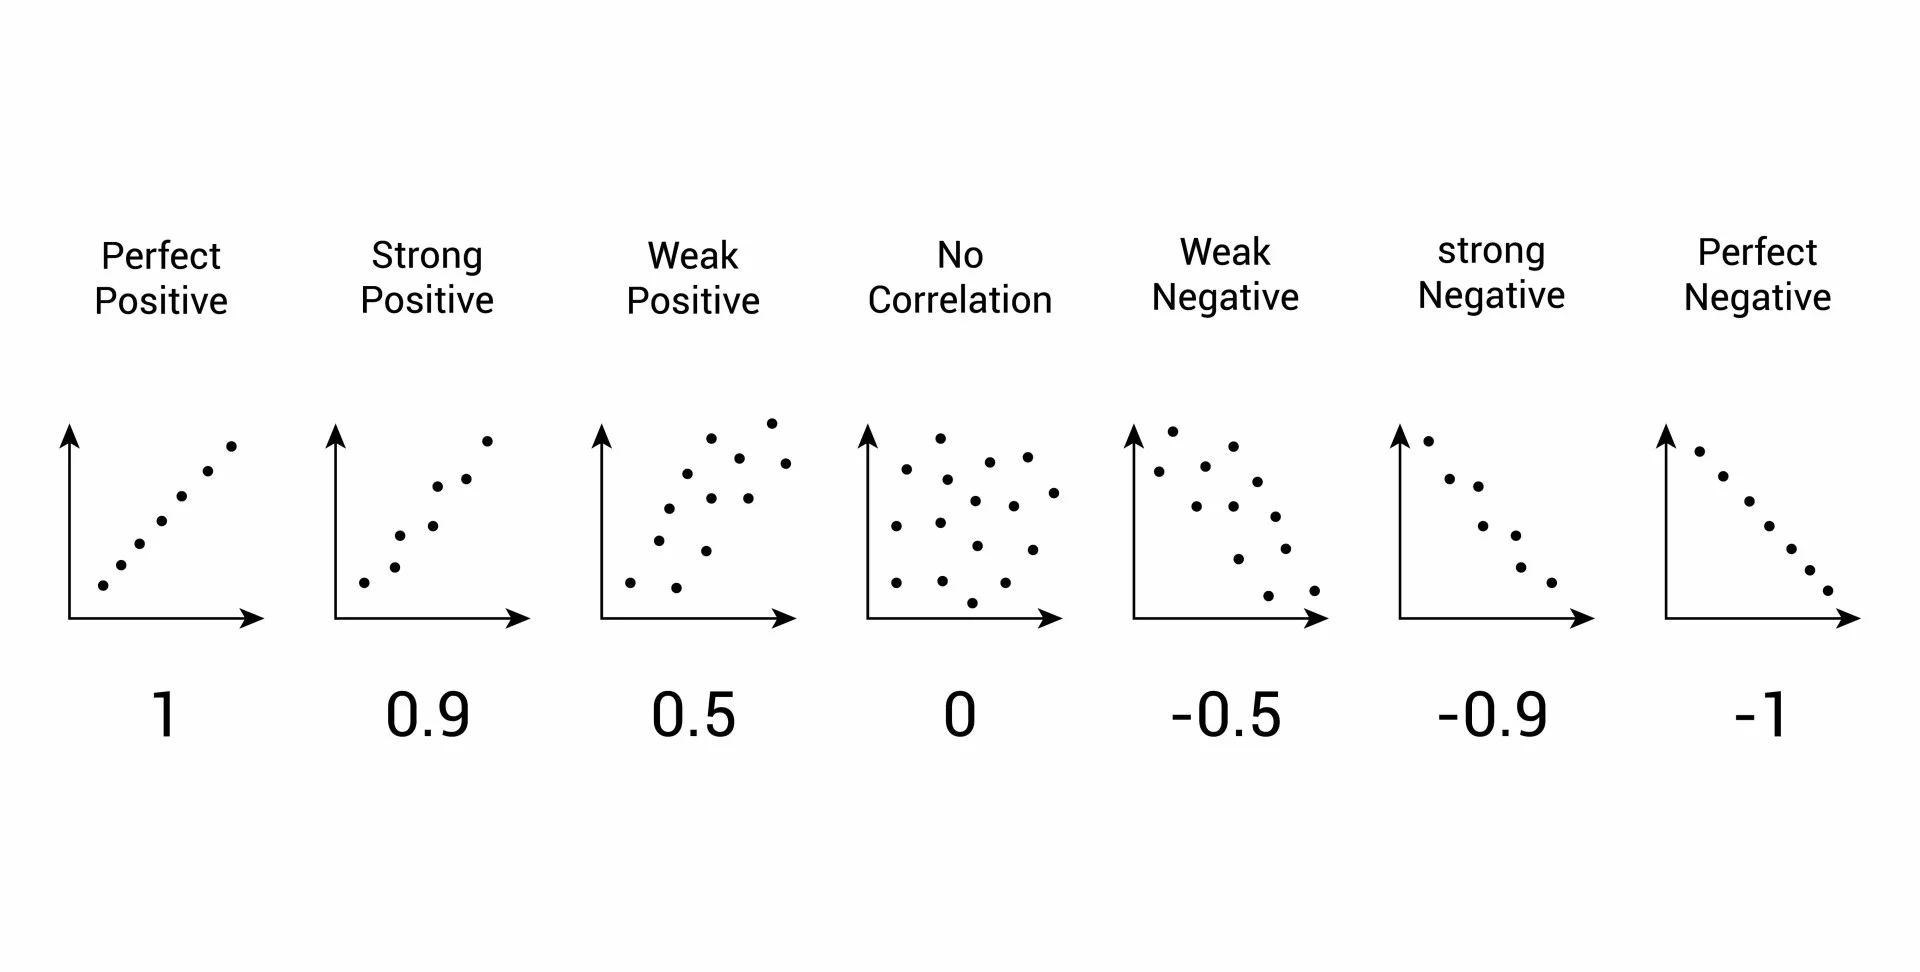
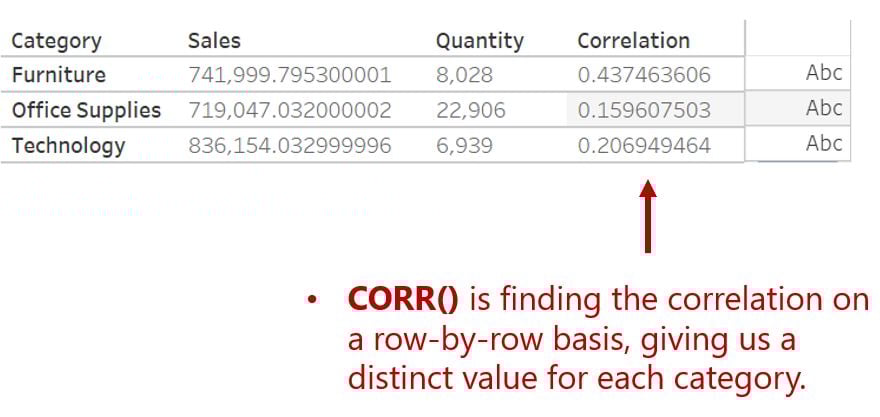
  • Creates aggregate views of your data based on specific time windows
  • Normal aggregation functions use the whole range of your data (i.e. no specification)

Example window functions:

  • WINDOW_SUM()
  • WINDOW_AVG()
  • WINDOW_STDEV()

Image showing the difference in argument structure between a window function and a normal aggregation function

  • WINDOW_CORR()
  • WINDOW_MEDIAN()
Time Series Analysis in Tableau

What's correlation?

  • Measures the extent to which two variables may be related

  • Correlation coefficient (r) measures the strength and direction of the relationship

  • Values range from -1 to 1

  • A positive value means that as one variable increase, the other also increases

  • Inversely, a negative direction means when one variable increases, the other decreases

Displaying a range of correlation values ranging from weak negative correlations to strong positive correlations

Time Series Analysis in Tableau

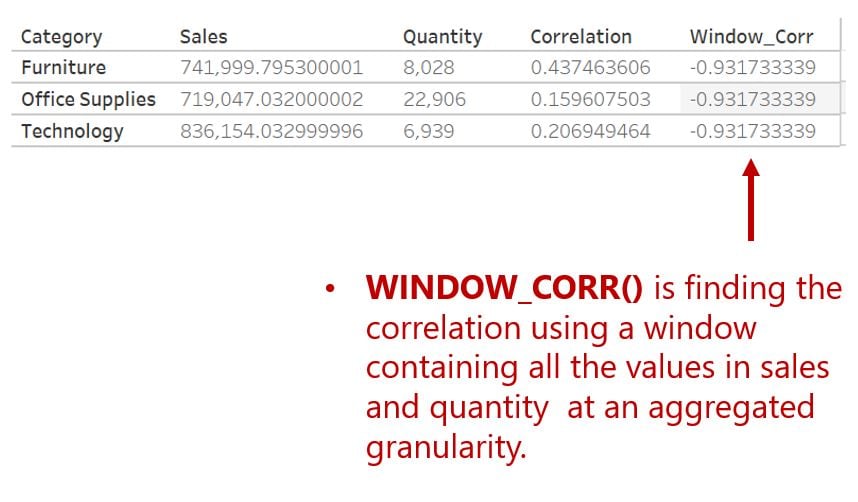
How do window correlations work?

  • Calculate the pearson correlation coefficient for the whole view between two aggregated variables

  • In contrast to the CORR() function that requires non-aggregated variables

Example showing how a window correlation returns one set of correlation values for the whole measure

Example showing how the correlation function displays separate correlation values for each row

Time Series Analysis in Tableau

Introducing the dataset

  • Analyzing water trading activity and the seasonal transactions that occur
  • Time series techniques to identify abnormal pricing patterns:
    • Moving averages
    • Window correlations

Image of transactional pricing data on a hypothetical water market exchange

1 https://theswaddle.com/water-is-now-a-traded-commodity-can-it-still-be-a-human-right-too/
Time Series Analysis in Tableau

Let's practice!

Time Series Analysis in Tableau

Preparing Video For Download...