Anomaly detection with window functions

Time Series Analysis in Tableau

Chris Hui

VP, Tracked

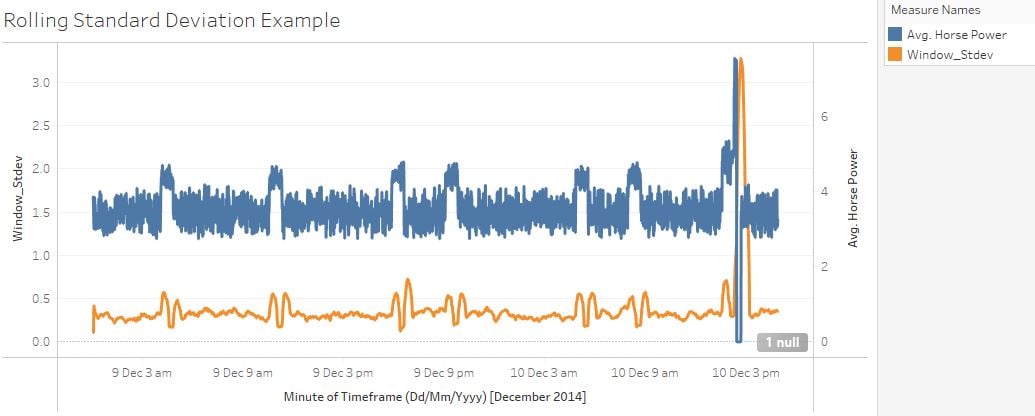
Standard deviation versus rolling standard deviation

  • Standard deviation measures the degree of dispersion in a set of values
    • High standard deviation = high variance
    • Low standard deviation = low variance

A box plot visualization showing the differences between high standard deviation and low standard deviation

  • Rolling standard deviation, calculated on a window subset, is useful to identify variance inflation with respect to time

  • As the variance grows larger, this may signal an anomaly for analysis purposes

An image showing how rolling standard deviation shows variance increasing over time

Time Series Analysis in Tableau

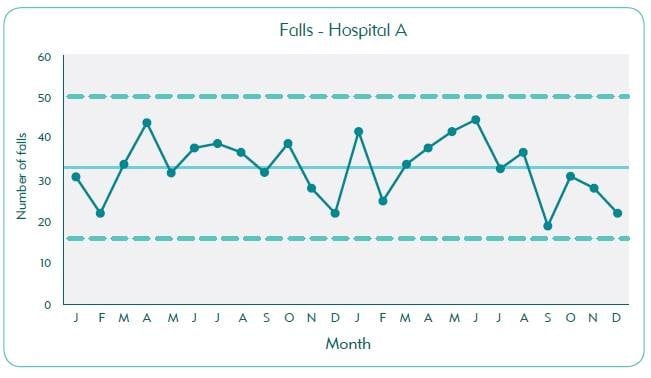
Standard deviation and anomaly detection

  • Anomaly detection for time series data generally follows the 68, 95, 99 rule

  • ~ 68% of all values = 1 standard deviation away from the mean

  • 95% of all values = 2 standard deviation away from the mean
  • ~ 99.7% of all values = 3 standard deviation away from the mean
  • Any value > 3 standard deviations away from the mean is anomalous

A normal distribution visualizing showing the range of standard deviations before a value is considered anomalous utilizing the 68, 98 and 99 rule

Time Series Analysis in Tableau

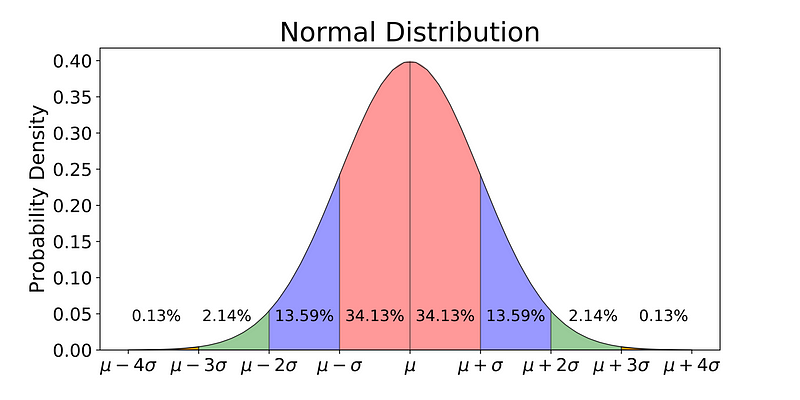
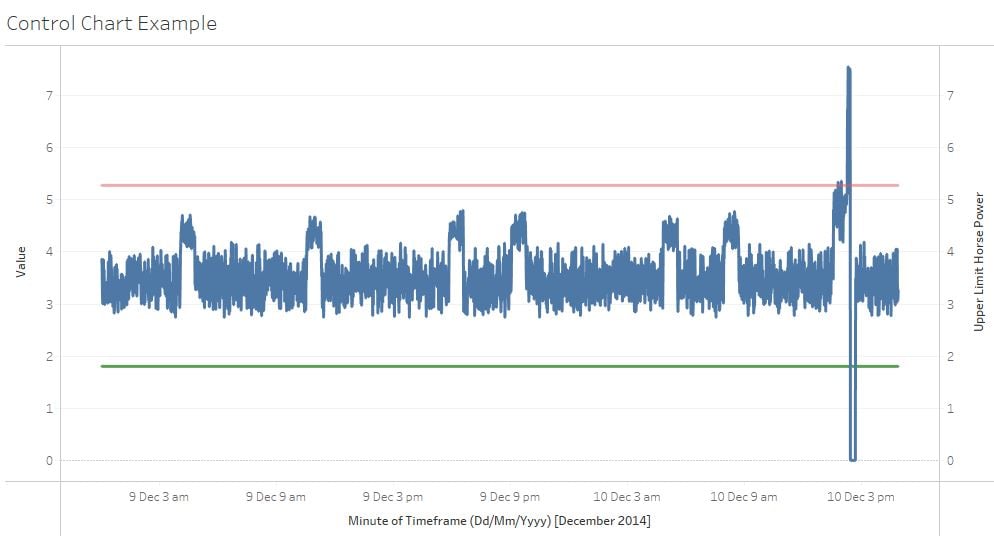
Upper and lower control limits
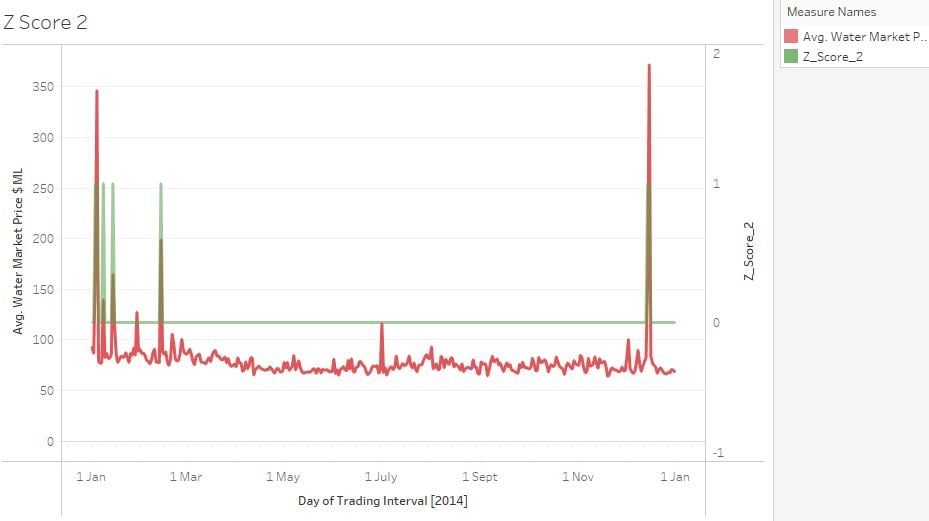
  • Primarily utilized for univariate time series analysis as opposed to multivariate

  • Control charts are an effective visual way of identifying the upper and lower bounds of what are acceptable values

  • Values that exceed the population mean +- 3 standard deviations are anomalous

Time Series Analysis in Tableau

What are Z-scores?

  • The Z-score is the number of standard deviations a data point lies above or below the mean

  • A positive Z-score indicates the value is above the mean

  • A negative Z-score indicates the value is below the mean

  • Separate from standard deviation that measures distance between data points

An image showing the Z-Scores versus the standard deviation

Time Series Analysis in Tableau

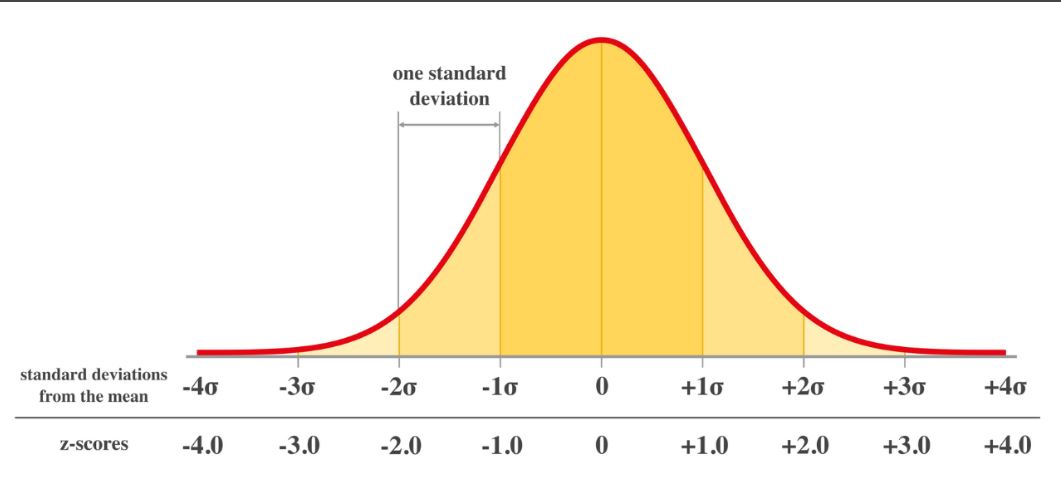
Z-scores and anomaly detection

  • Z-scores +-3 are considered anomalous, but this is contextual

A visual showing a Z-score cut off of 1, highlighting a number of anomalies

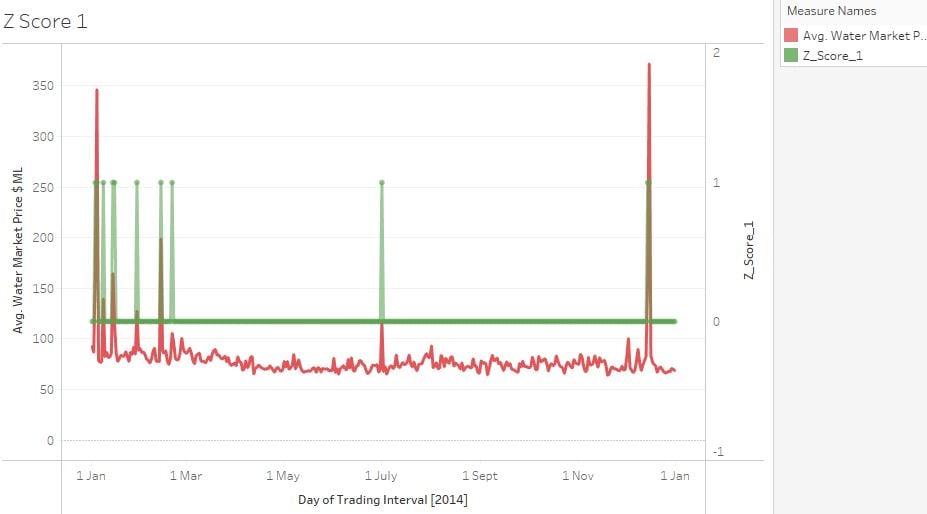
  • Higher Z-scores mean less anomalies, but this depends on how sensitive your anomaly detection is

A visual showing a Z-score cut off of 2, highlighting very few anomalies

Time Series Analysis in Tableau

Let's practice!

Time Series Analysis in Tableau

Preparing Video For Download...