Just in time
Case Study: Supply Chain Analytics in Tableau

Agata Bak-Geerinck
Senior Data Analyst
Case study: your Tableau skills meet real life case!

- A follow-up of DataCamp Tableau courses
- A real-life case on an interesting dataset
- Test of your practical skills in Tableau
- Independent work with little guidance
Prerequisite courses:
- Analyzing Data in Tableau
- Data Visualization in Tableau

What is supply chain?
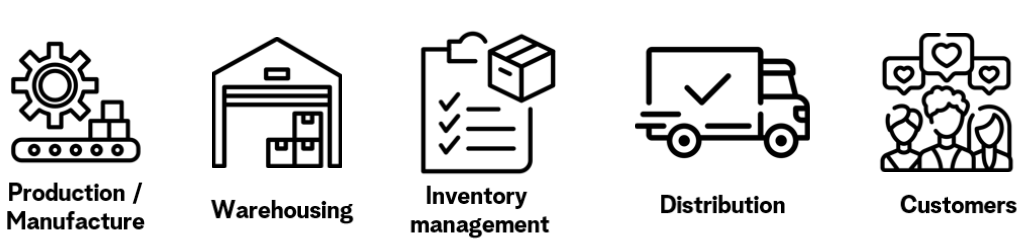
Supply chain: a flow of processes involved in the production, sourcing, and distribution of products
Partners: producers, suppliers, service providers (storage, transportation, retail, etc.)
Retail supply chain
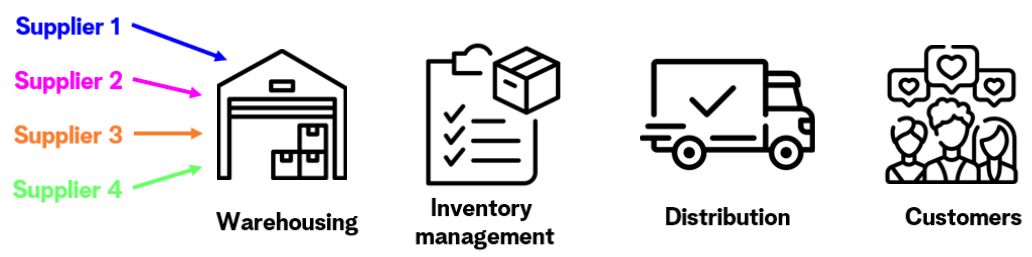
- Retail Supply Chain: no production --> reselling of ready goods
- Dependency on suppliers and their Supply Chains
Potential retail supply chain problems - inventory
- Just in time?
Tiny pizzeria:
- wooden oven
- a flat surface to prepare pizzas
- a tiny fridge
- small storage space for fresh produce
- Delivery of 100 kg of tomatoes?!


Potential retail supply chain problems - inventory
- Just in time?
Overstock
- Unnecessary storage costs
- Spillage costs
Understock
- Delays in order dispatch
- Order cancellations
- Just in time = no over or understock
Potential retail supply chain problems - shipments
Shipment and transportation problems:
- Increasing prices of freight rates$^1$
- Traffic congestion causing delays
- Longer lead times (from order to delivery)
- Unreliable "last mile delivery" (e.g. local postal service on strike)
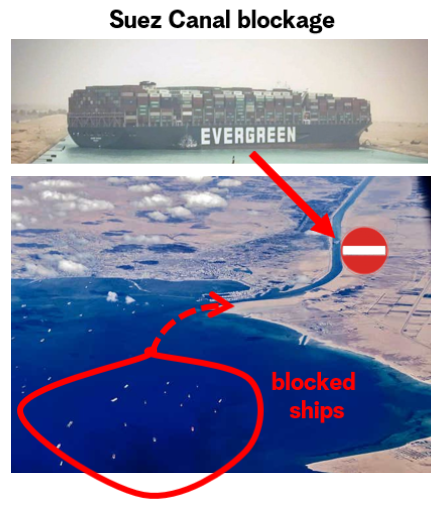
1 Freight rate = amount paid to a carrier company for the transportation of goods
Ready for the challenge? Meet our dataset!
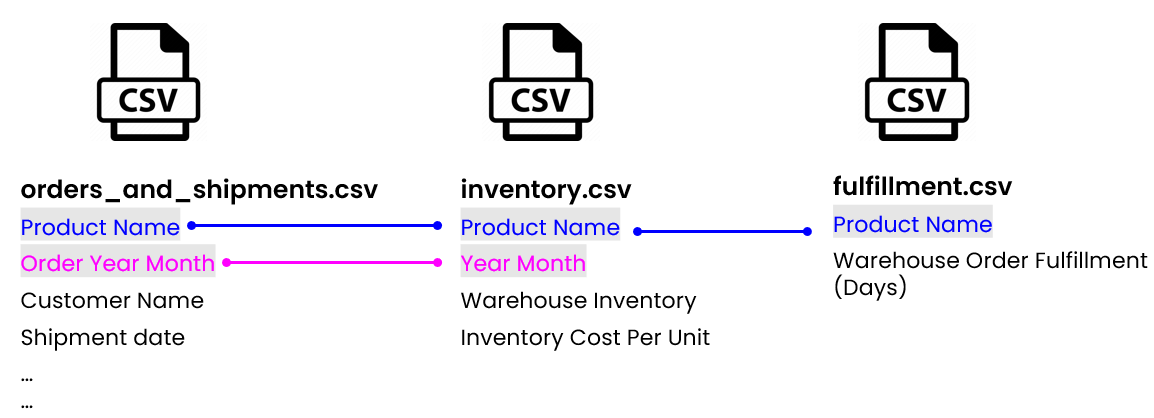
1 Overview of all data fields and their definitions can be found on the course landing page.
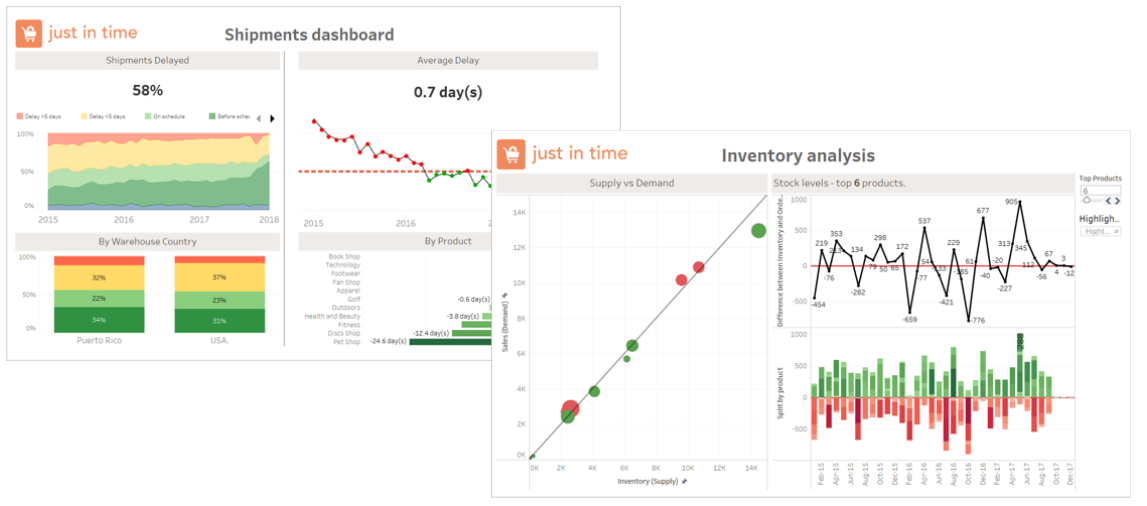
Our final deliverables!