How do FMCG companies measure their performance?
Case Study: Net Revenue Management in Excel

Gauthier Georgis
Category Manager
KPIs
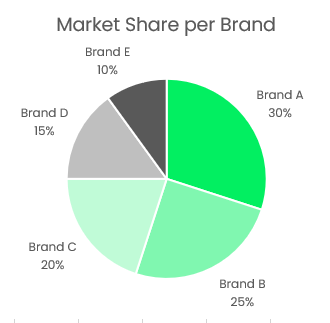
Market Share

Percentage of a market's total sales
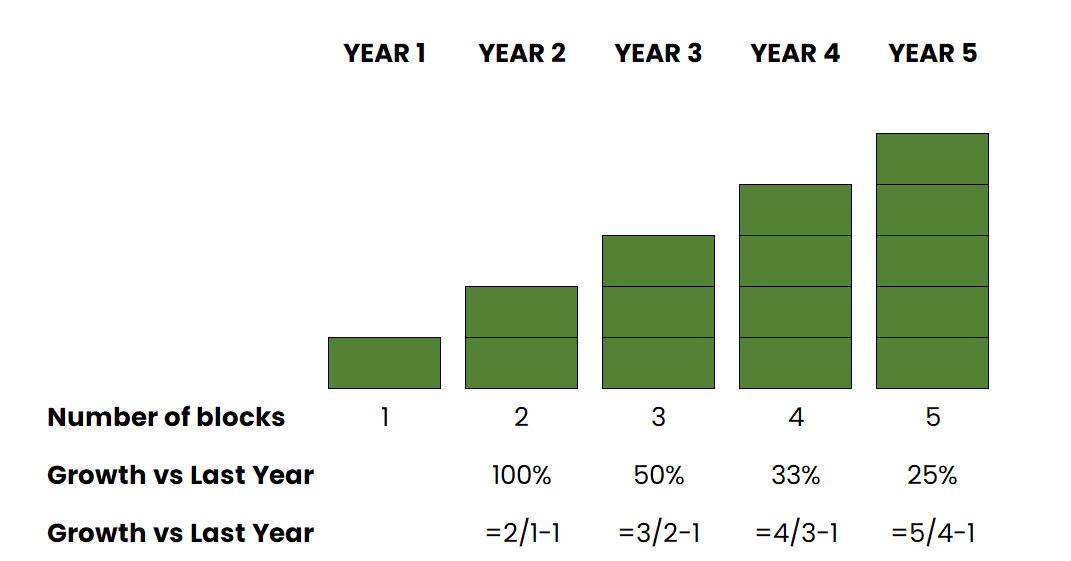
Growth
Measures the growth over time
Measuring market share
Measuring growth
Measuring our KPI's over time

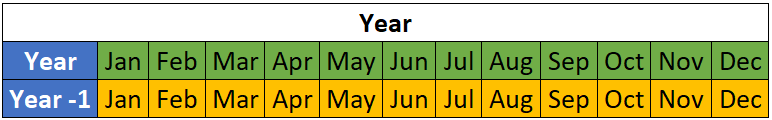
Yearly sales
Period #1: Year
Growth Year = $ \frac{SalesThisYear}{Sales Last Year} -1 $
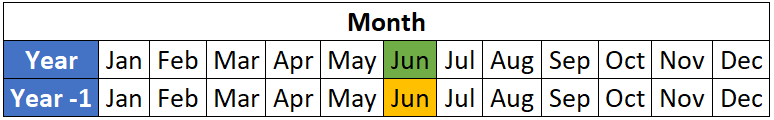
Monthly sales
Period #2: Month
Growth Month = $ \frac{June This Year}{June Last Year} -1 $
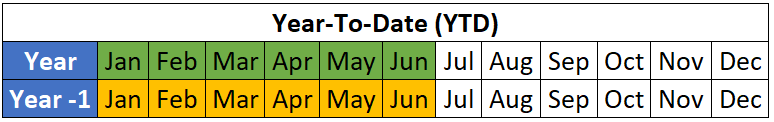
Year-to-Date sales
Period #3: Year-To-Date (YTD)
Growth YTD June = $ \frac{YTD June This Year}{YTD June Last Year} -1 $
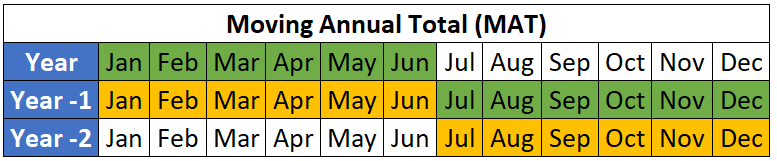
Moving Annual Total Sales
Period #4: Moving Annual Total (MAT)
Growth MAT June = $ \frac{MAT June This Year}{MAT June Last Year} -1 $
Unit vs. value sales
Unit Sales
- Total number of products sold
- E.g.:
100bananas sold

Value Sales
- Total dollar amount
- E.g.:
$100in sales

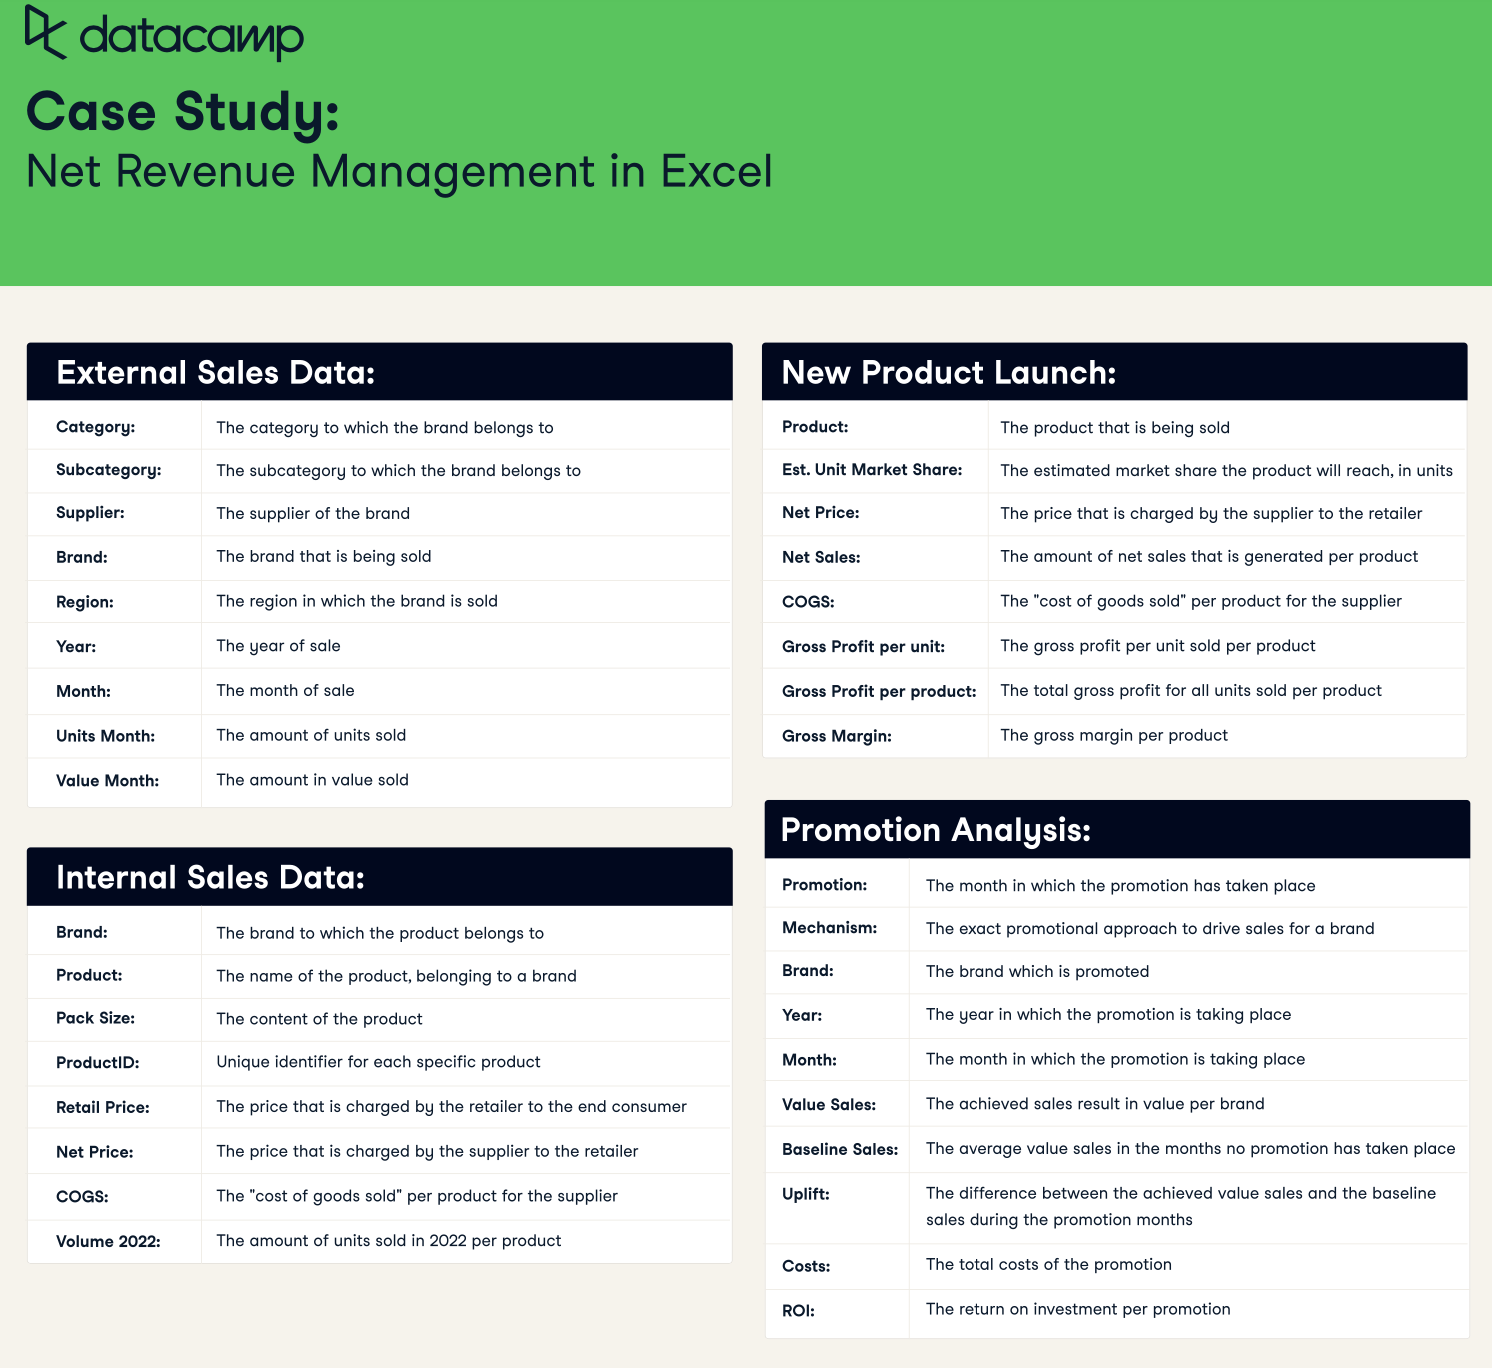
The dataset