Visualizing disaggregated data with PivotCharts
Data Visualization in Excel

Agata Bak-Geerinck
Senior Data Analyst, Telenet
Aggregated vs. disaggregated data?

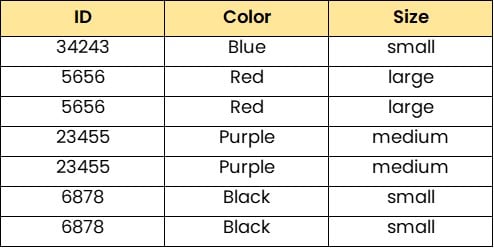
Disaggregated data (individual blocks)

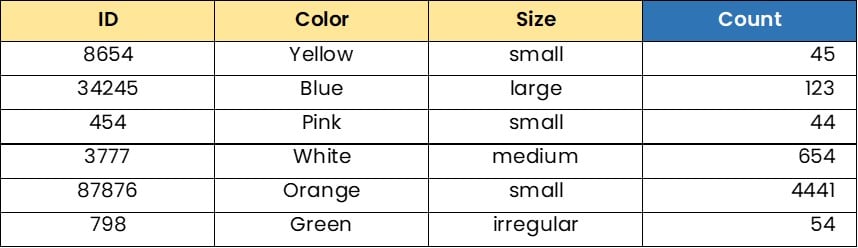
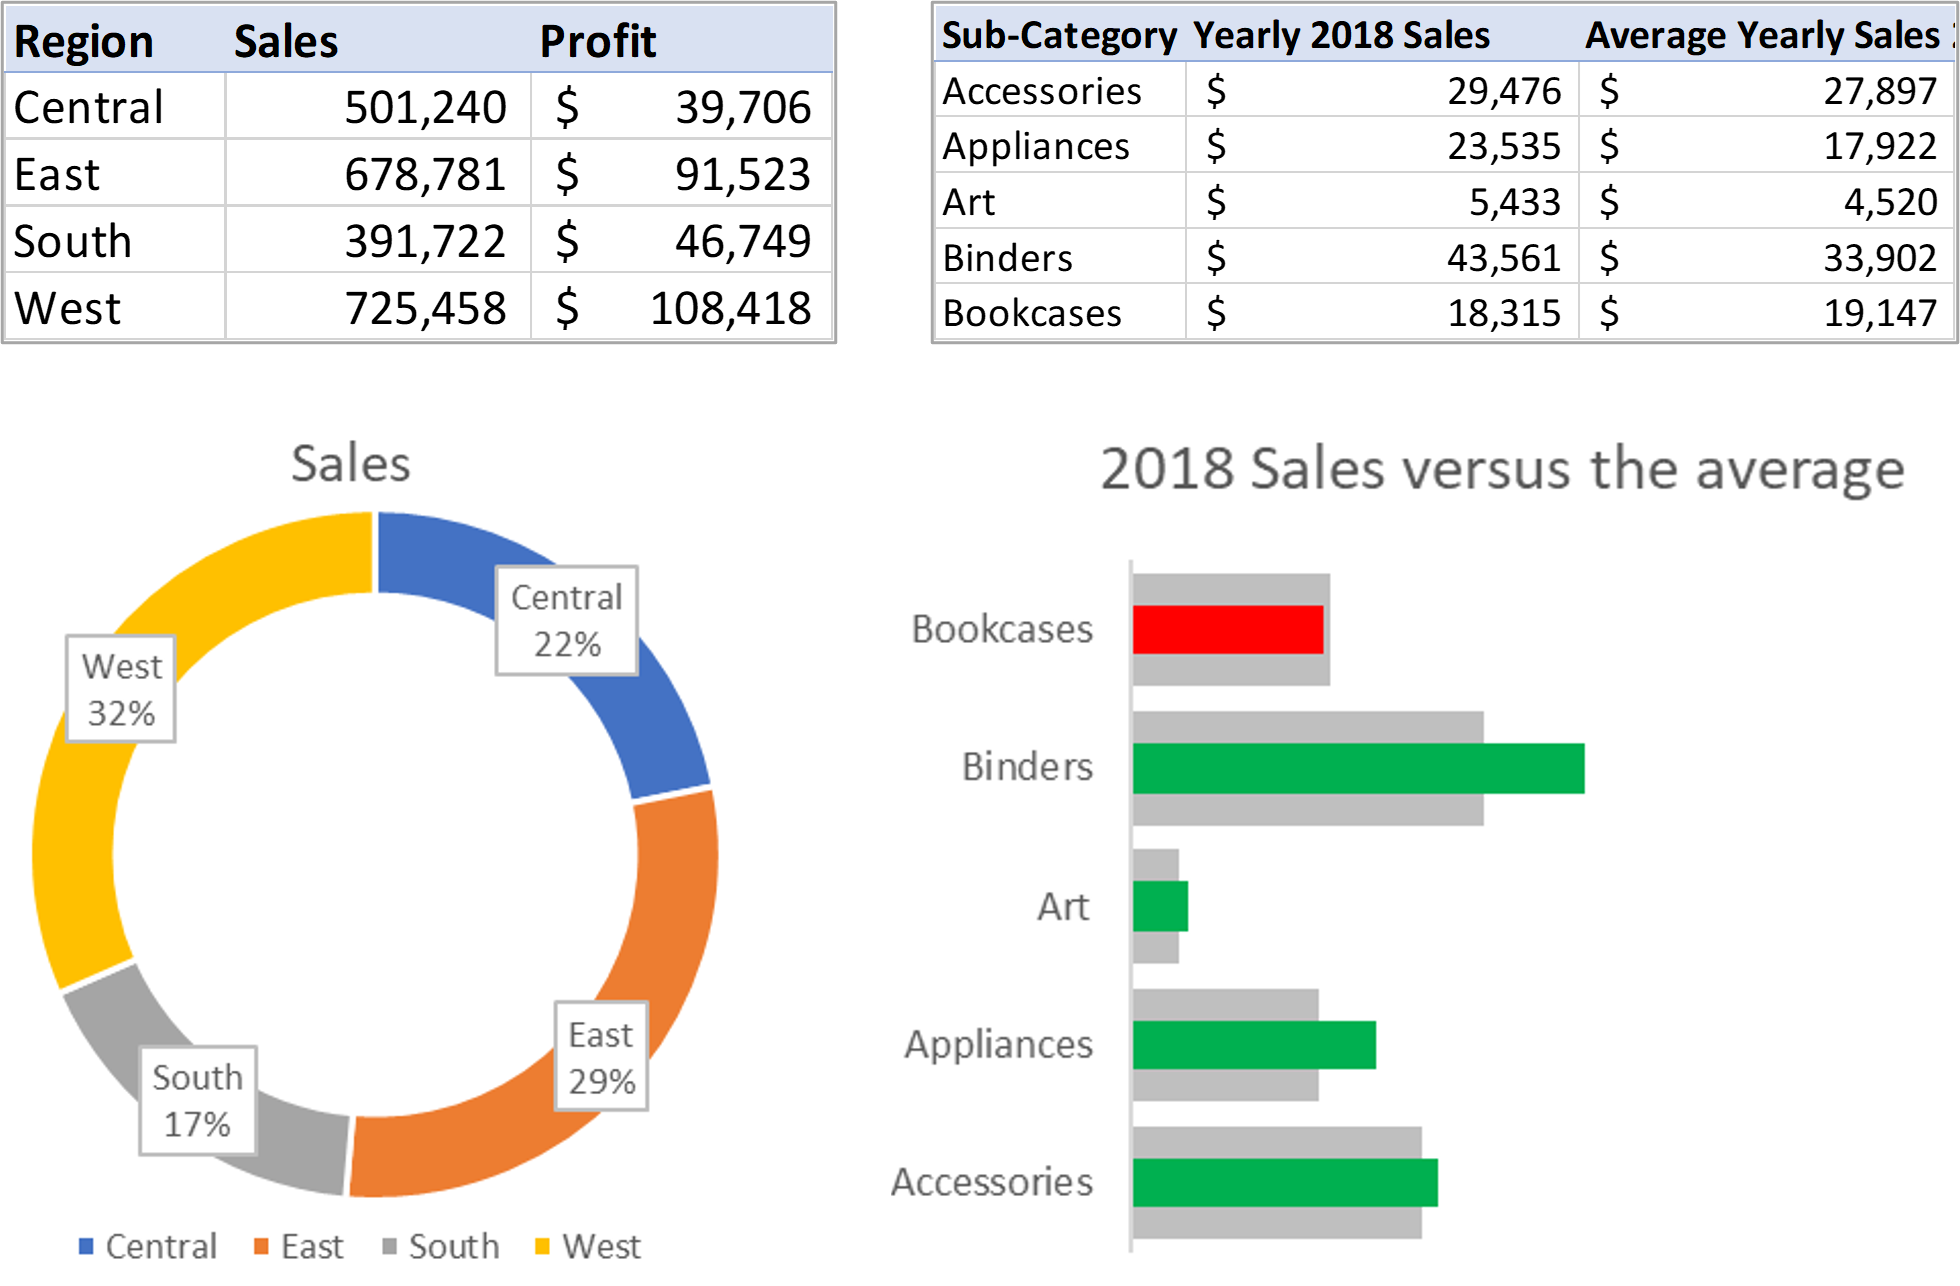
Aggregated data (counted by color and size)

Aggregated vs. disaggregated data?
Aggregated data
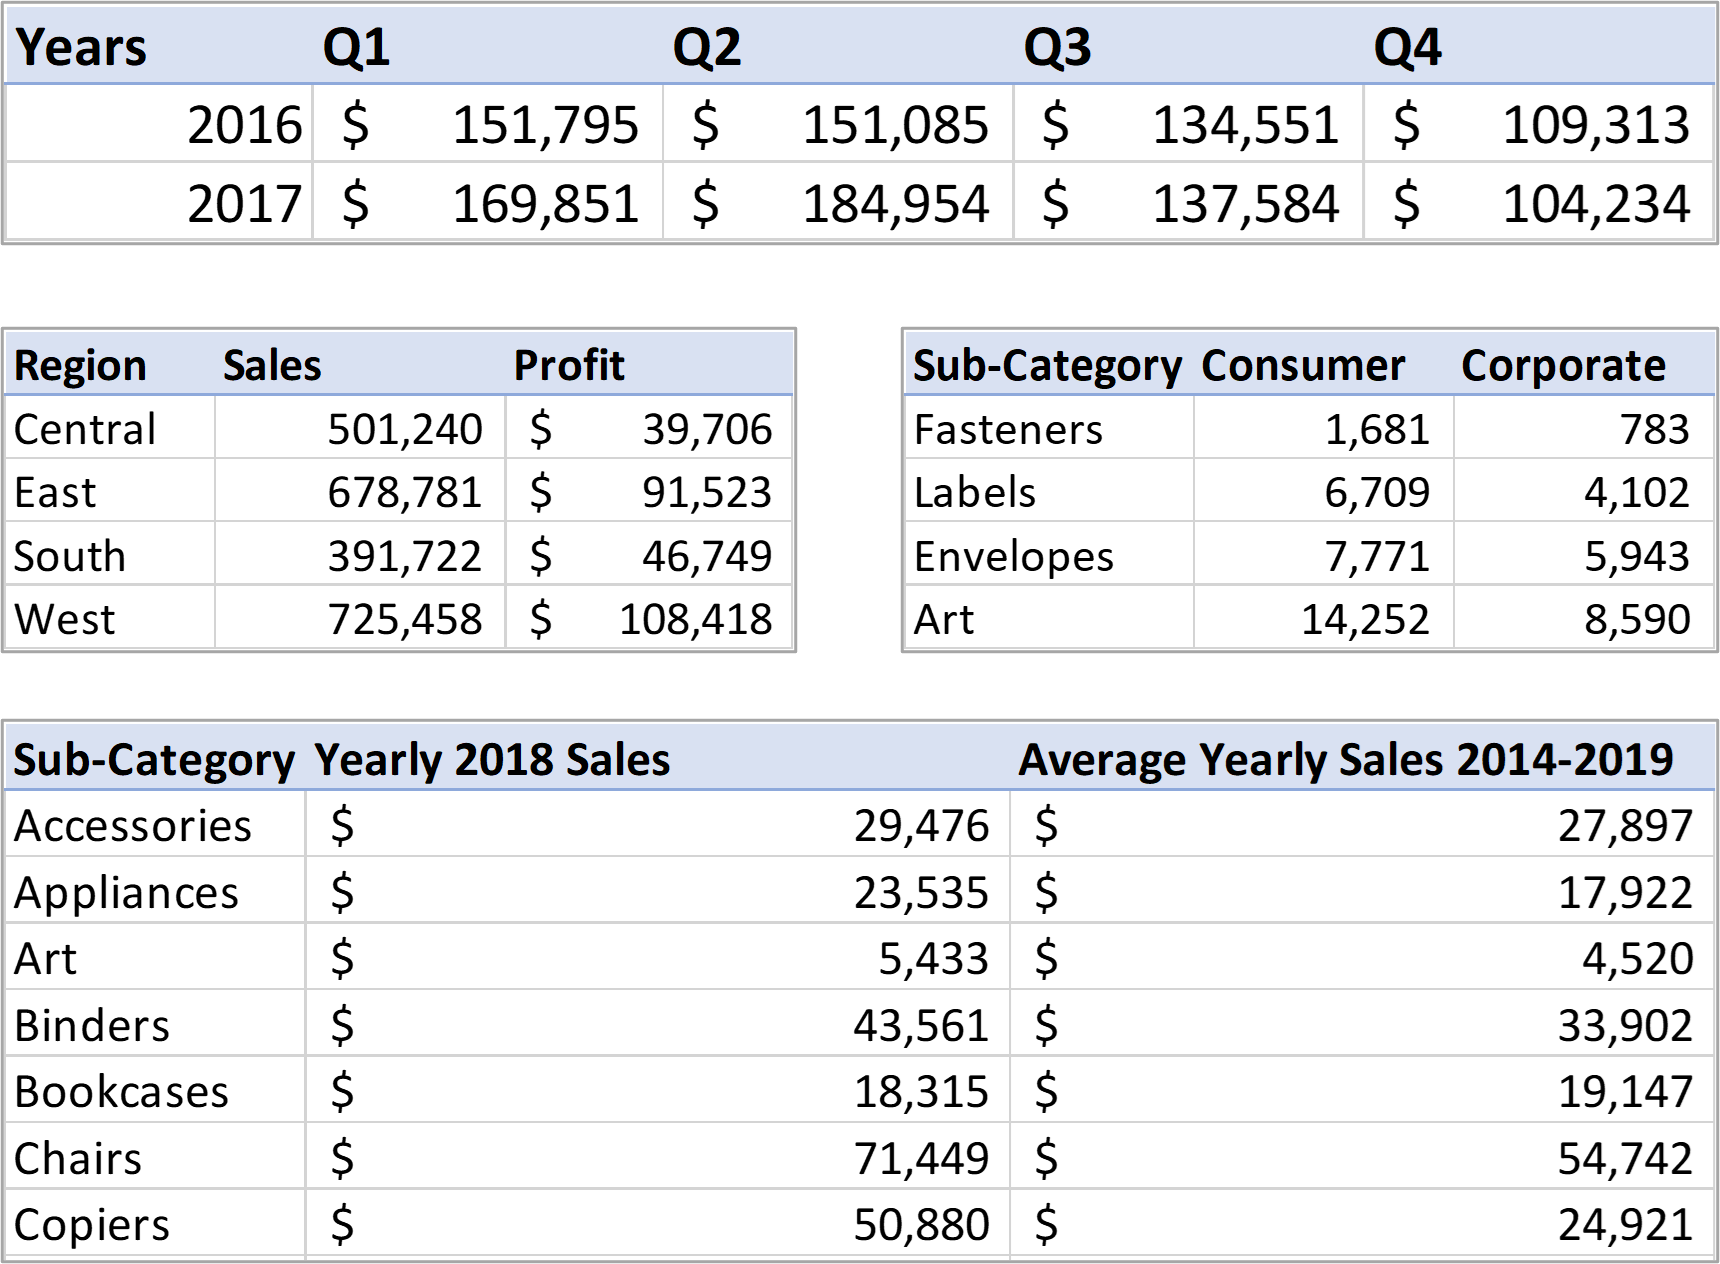
- Aggregated data = summarized data
- e.g., sales per region, profit per product
Disaggregated data
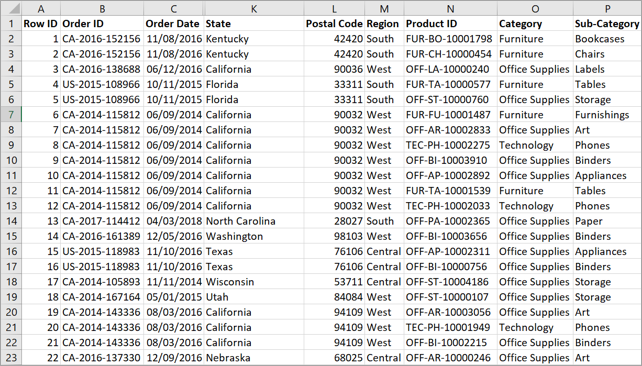
- Disaggregated data = raw, unsummarized
- Transactional data: one record = one event
From tables and charts to PivotTables and PivotCharts
Visualizing aggregated data
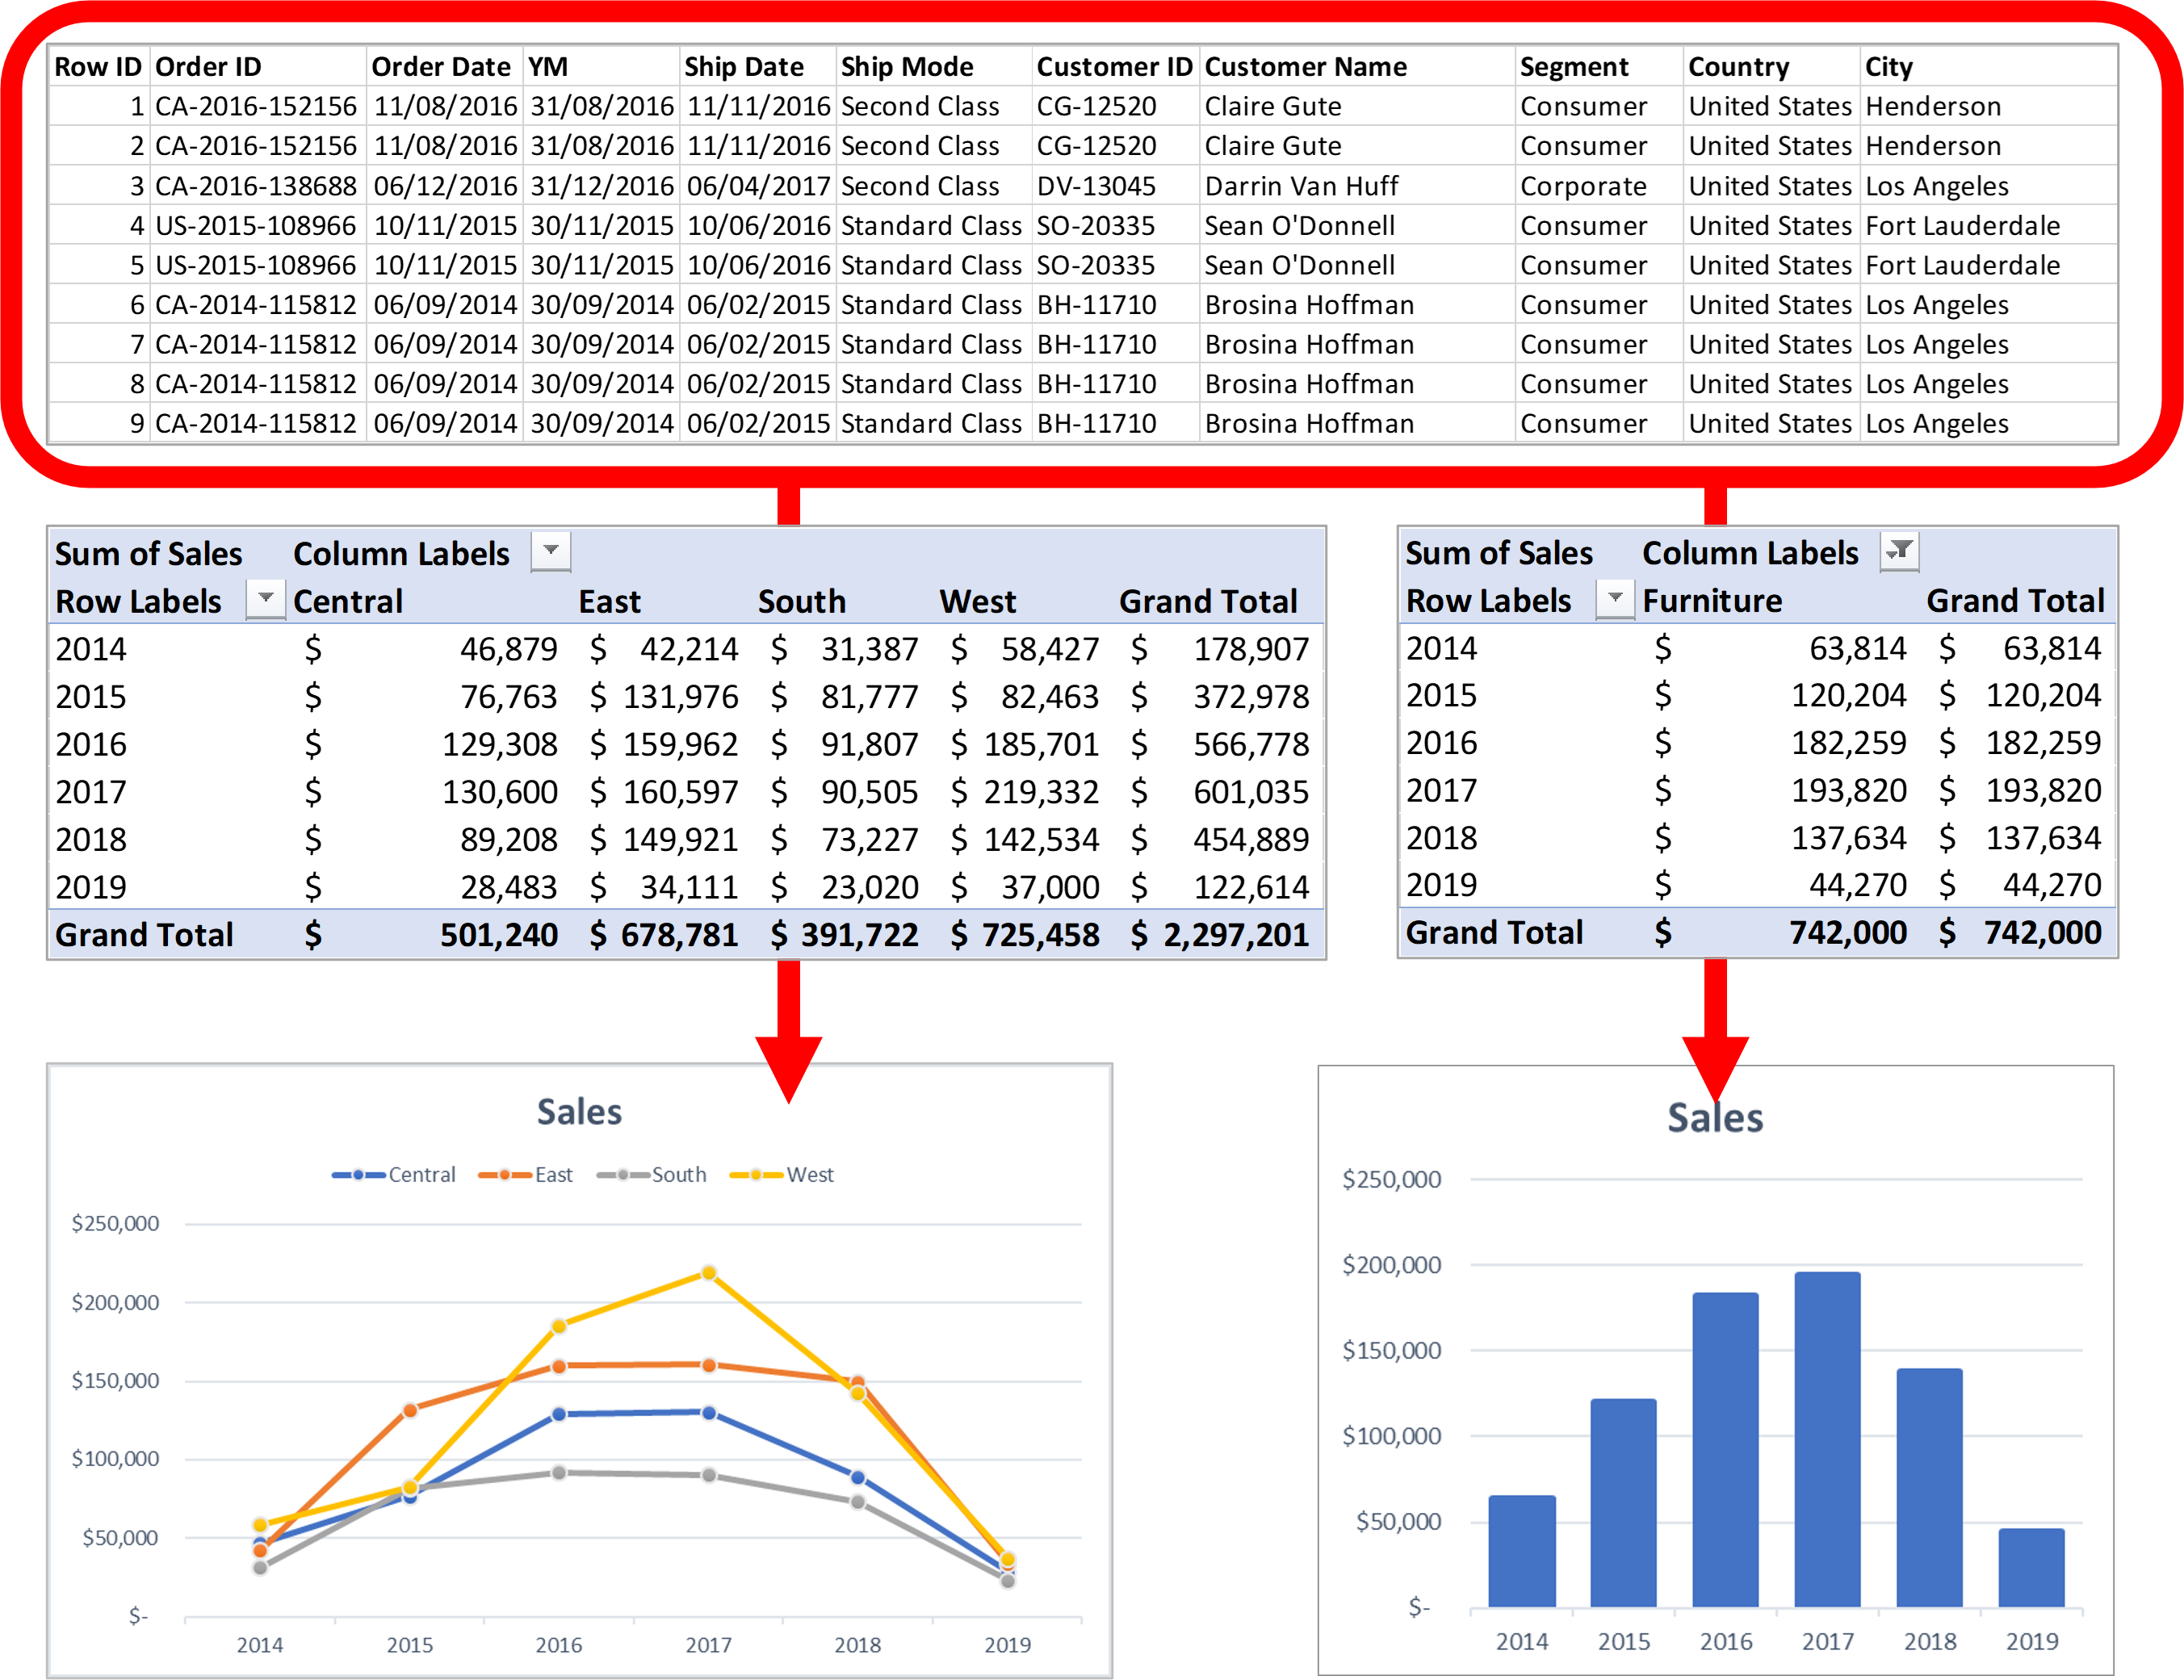
Visualizing disaggregated data
Exploring large datasets efficiently
One dataset = easy data exploration
- No need for pre-aggregating data into individual tables
- Single underlying dataset
- Dynamic exploration and visualization
- Easy rearranging of row and column series
- Updates to the dataset result in updating all pivot tables and charts
- "Once source of truth"
Enabling interactivity and building (mini) dashboards
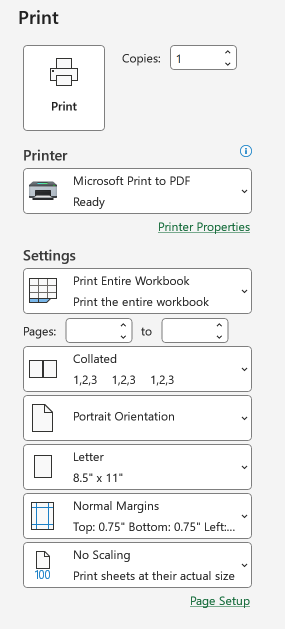
How to print in Excel?
- Useful for capturing insights for meetings or sharing information with senior staff
Many settings to choose from:
- Print areas
- Page layouts
- Scaling, margins, and orientation
Always consider the environment before printing!