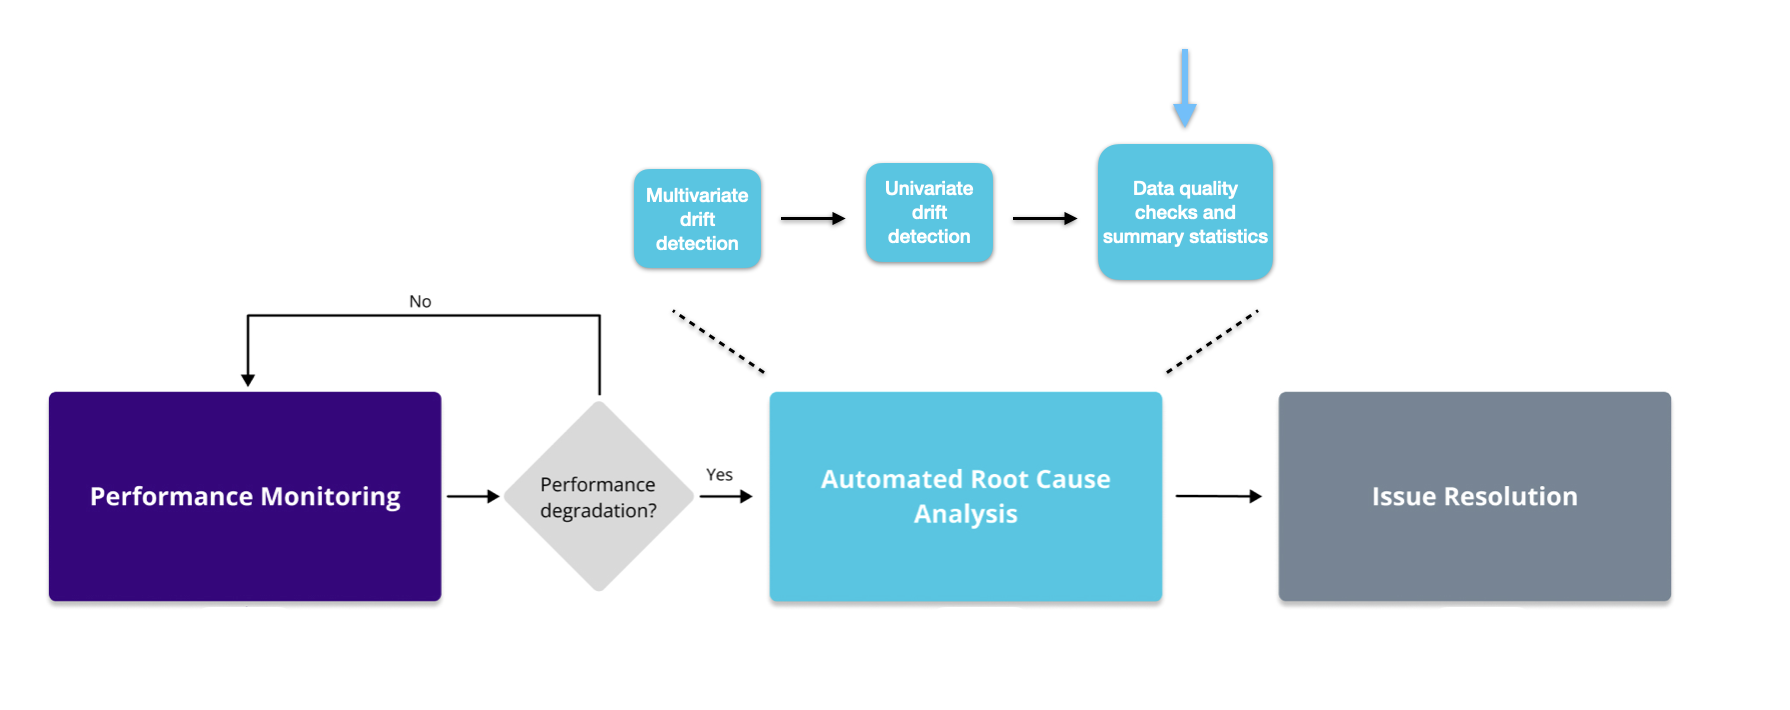
Data quality checks and summary statistics

Monitoring Machine Learning in Python

Hakim Elakhrass

Co-founder and CEO of NannyML

What are data quality checks and summary statistics?
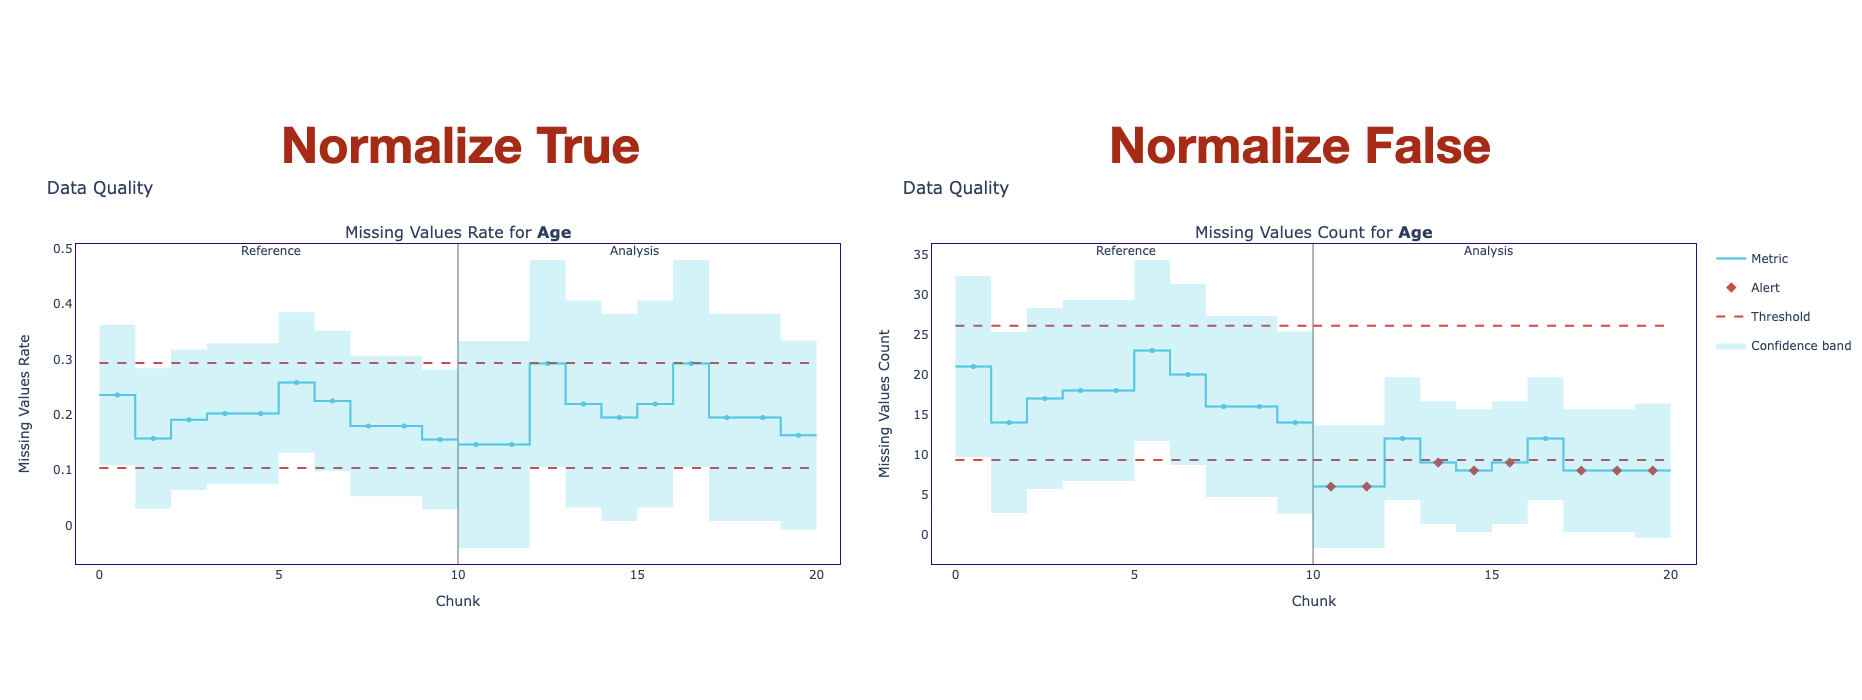
The image shows monitoring workflow with the highlighted data quality checks and summary statistics part in automated root cause analysis step.

  • Missing value detection
  • Unseen value detection
  • Summation, average, standard deviation, median and row counts
Monitoring Machine Learning in Python

Missing values detection

  • Reduced observations in a chunk
  • Loss in valuable information
  • Incorrect interpretations and decisions
# Instantiate the missing values calculator module
ms_calc = nannyml.MissingValuesCalculator(column_names=["Age"], normalize=True)

# Fit the calculator on the reference set
ms_calc.fit(reference)

# Calculate the rate of the missing values on the analysis set
ms_results = ms_calc.calculate(analysis)
ms_results.plot()
Monitoring Machine Learning in Python

Missing values plot

The plot shows the missing values results for normalize parameter set to True and False.

Monitoring Machine Learning in Python

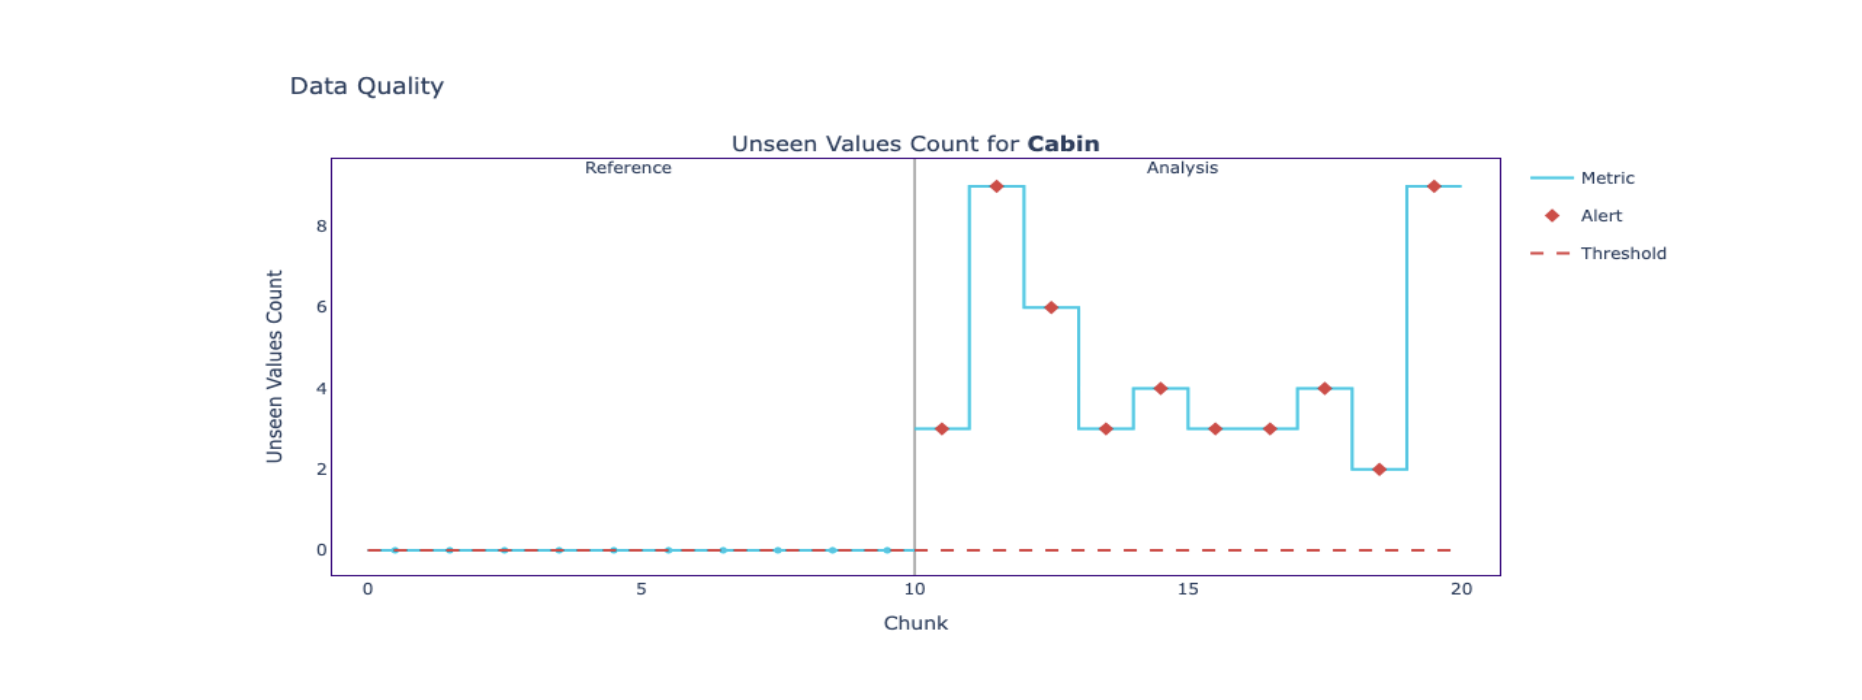
Unseen values detection

  • Categorical feature values that are not present in the reference period
  • An increment of unseen values can make the model less confident in regions
# Instantiate the unseen values calculator module
us_calc = nannyml.UnseenValuesCalculator(column_names=["Cabin"], normalize=False)
# Fit, calculate and plot the rate of the unseen values
us_calc.fit(reference)
us_results = us_calc.calculate(analysis)
us_results.plot()

The image shows unseen values plot with changes in the number of unseen values.

Monitoring Machine Learning in Python

Summary statistics

  • Summation: Useful for financial data to calculate revenue, or profits for a specific period.
  • Mean and Standard Deviation: Helpful for data drift check and explainability.
  • Median: Resistant to outliers, making it useful when dealing with features that have many extreme values.
  • Row Counts: Determine if there is enough data in each chunk.
sum_calc = nannyml.SummaryStatsSumCalculator(column_names=selected_columns)
avg_calc = nannyml.SummaryStatsAvgCalculator(column_names=selected_columns)
std_calc = nannyml.SummaryStatsStdCalculator(column_names=selected_columns)
med_calc = nannyml.SummaryStatsMedianCalculator(column_names=selected_columns)
rows_calc = nannyml.SummaryStatsRowCountCalculator(column_names=selected_columns)
Monitoring Machine Learning in Python

Let's practice!

Monitoring Machine Learning in Python

Preparing Video For Download...