Univariate drift detection

Monitoring Machine Learning in Python

Hakim Elakhrass

CEO and co-founder

What is univariate drift detection?
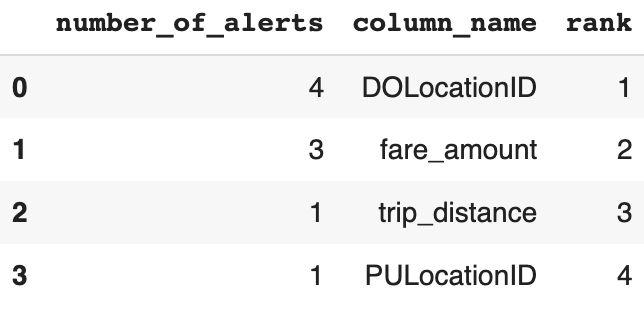
The image shows monitoring workflow and where the univariate method is placed there.

Monitoring Machine Learning in Python

Univariate methods

  • Jensen-Shannen distance - both categorical and continuous
  • Hellinger - categorical and continuous
  • Wasserstein - only continuous
  • Kolgomorov-Smirnov - only continuous

  • L-infinity - only categorical

  • Chi2 - only categorical

1 https://nannyml.readthedocs.io/en/stable/how_it_works/univariate_drift_comparison.html
Monitoring Machine Learning in Python

Code implementation

# Intialize the univariate drift calculator
uv_calc = nannyml.UnivariateDriftCalculator(
    continuous_methods=['wasserstein', 'hellinger'],
    categorical_methods=['jensen_shannon', 'l_infinity', 'chi2'],
    column_names=feature_column_names,
    timestamp_column_name='timestamp',
    chunk_period='d'
    )
# Fit, calculate and plot the results
uv_calc.fit(reference)
uv_results = uv_calc.calculate(analysis)
uv_results.plot().show()
Monitoring Machine Learning in Python

Filtering

  • Based on the column names
  • Based on the univariate methods
# Filter the univariate results
filtered_figure = uv_results.filter(column_names=['trip_distance', 'fare_amount'], 
            methods=['jensen_shannon'])

# Plot the filtered results
filtered_figure.show().plot()
Monitoring Machine Learning in Python

Alert count ranker

  • Rank features based on the number of alerts
# Initialize the alert count ranker
alert_count_ranker = nannyml.AlertCountRanker()
alert_count_ranked_results = alert_count_ranker.rank(
    uv_results,
    only_drifting=False)
# Display the results
display(alert_count_ranked_results)
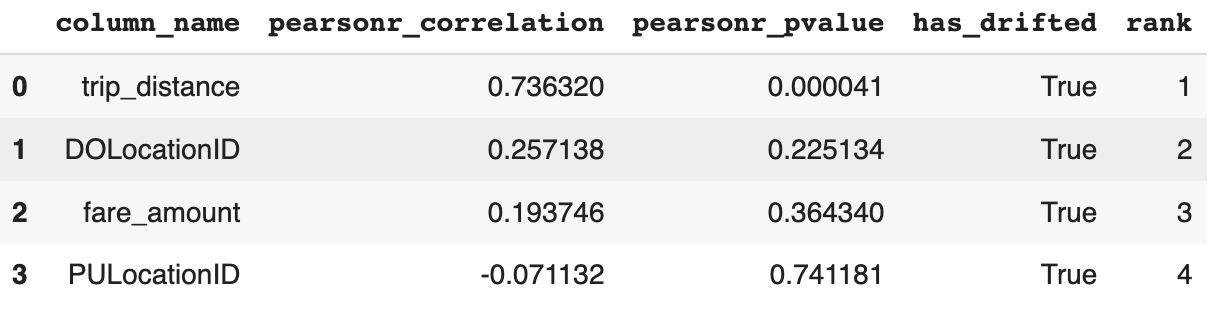
The image shows the dataframe with information about number of alerts for specific feature.

Monitoring Machine Learning in Python

Correlation ranker

  • Ranks features based on how much they correlate to absolute changes in performance
# Initialize the correlation ranker
correlation_ranker = nannyml.CorrelationRanker()
correlation_ranker.fit(perf_results.filter(period='reference'))
correlation_ranked_results = correlation_ranker.rank(uv_results, perf_results)

# Display the results
display(correlation_ranked_results)

The image shows the dataframe with pearson correlation and p-value for each feature.

Monitoring Machine Learning in Python

Monitoring feature's distribution

  • Gives better insights and improves explainability
# Create distribution plots
distribution_results = uv_results.plot(kind='distribution')

# Show the plots
distribution_results.show()
Monitoring Machine Learning in Python

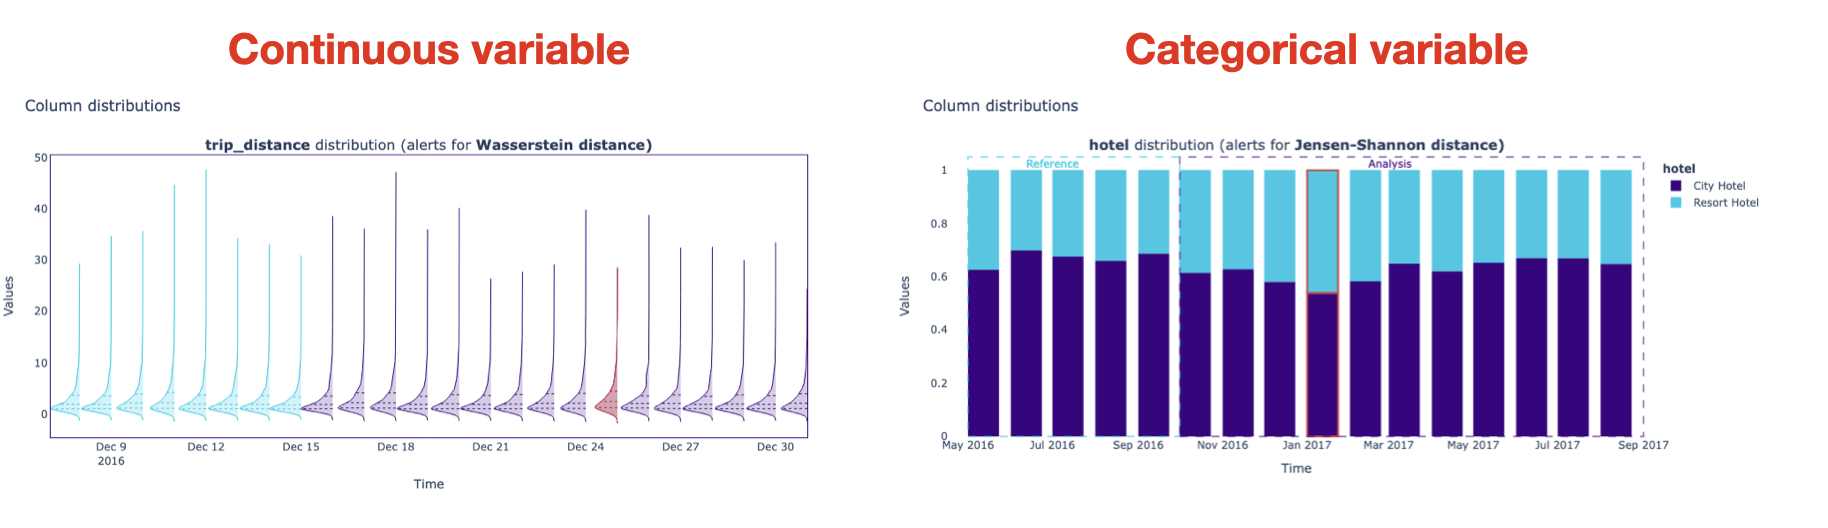
Feature distribution plot


The image shows distribution plots for continuous and categorical features.

Monitoring Machine Learning in Python

Let's practice!

Monitoring Machine Learning in Python

Preparing Video For Download...