Healthcare analysis in Tableau

Case Study: Analyzing Healthcare Data in Tableau

Maarten Van den Broeck

Senior Content Developer, DataCamp

What is a case study?
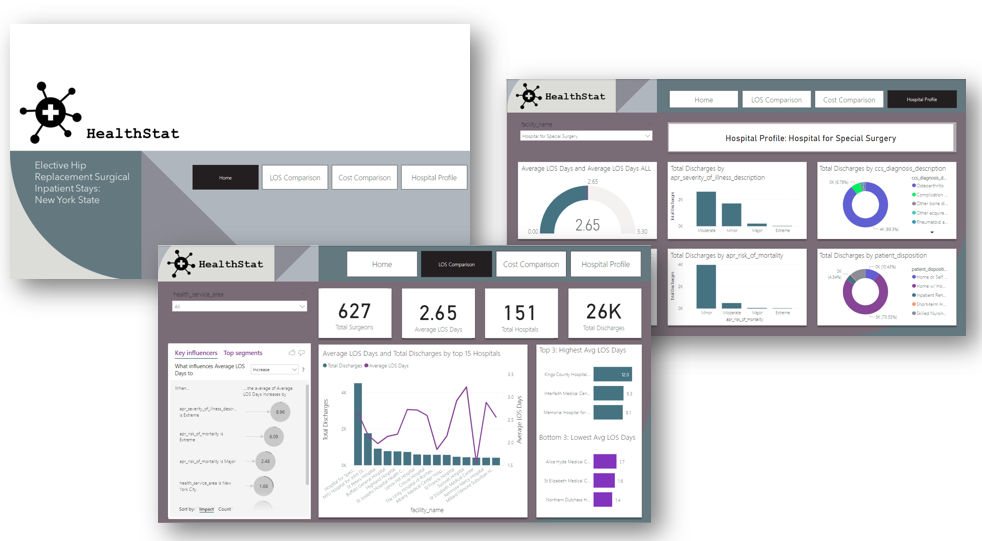
  • Apply Tableau Skills
  • Combine previously learned concepts
  • Solve an example real-world problem

$$

Prerequisite Courses:

  • Data Visualization in Tableau
  • Calculated Fields in Tableau

Young female character writing code on a desktop computer

Case Study: Analyzing Healthcare Data in Tableau

Case study goals

Hospital building exterior

  • HealthStat has hired you to uncover insights on potential hospital efficiency opportunities
  • Analyze an anonymized dataset from hospitals
  • Leverage Tableau to create an engaging dashboard
Case Study: Analyzing Healthcare Data in Tableau

Framework for healthcare quality

Institute of Medicine (IOM) quality framework listing the six domains of healthcare quality

  • Focus for this case study is efficiency
Case Study: Analyzing Healthcare Data in Tableau

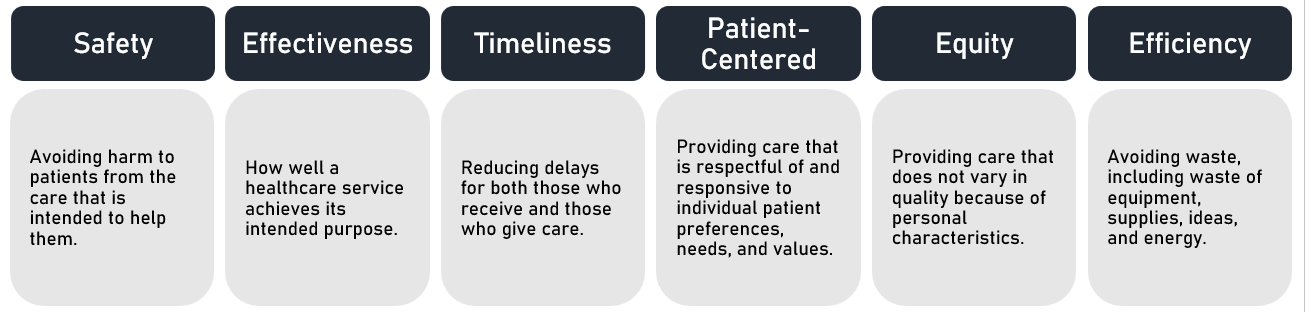
Measuring hospital efficiency

Length of stay (LOS): the duration in days for a patient stay in a hospital

  • Reducing LOS can lower costs, increase capacity, and improve throughput
  • Factors impacting LOS: patient age, health status, procedure, complications, mortality risk, hospital size, etc.

hospital bed with wheels and health symbol above

Case Study: Analyzing Healthcare Data in Tableau

Terminology overview

doctor gesturing to a chart with listed information

  • Inpatient: person who has been admitted to a hospital bed
  • Discharge: release of a patient from hospital care by a medical worker
  • Disposition: the patient destination or status upon discharge
  • Elective: reason for surgery was planned (not an emergency)
Case Study: Analyzing Healthcare Data in Tableau

Patient population for analysis

doctor characters with magnifying glass viewing human pelvic bones with hip prosthesis

Hip replacement surgery

  • Patients with hip pain may require elective hip replacement surgery
  • Damaged bone and cartilage is removed and replaced with prosthetic components
  • Arrival to hospital with surgery on day zero, stay 0-2 days
Case Study: Analyzing Healthcare Data in Tableau

The dataset

Key characteristics

  • New York state-wide hospital discharge data for 2016 (anonymous)
  • Elective hip replacement surgery patients
  • One single table with 30 columns
  • Each row represents a single inpatient stay, from admission to discharge
  • Metadata sheet available

laptop screen displaying electronic medical record

Case Study: Analyzing Healthcare Data in Tableau

Dataset key outcome attributes

Column name Description
length_of_stay Total days the patient stayed in hospital
total_costs Total cost for the stay
Case Study: Analyzing Healthcare Data in Tableau

Dataset explanatory attributes

Key attributes of interest for the case study

Column name Description
facility_id A unique id that identifies each distinct hospital
age_group Age of patient at the time of discharge
patient_disposition The patient's destination status upon discharge
ccs_diagnosis_description Most responsible diagnosis code associated with the hospital stay
apr_severity_of_illness_description Illness severity level assigned standard score on scale from 1 (Minor) to 4 (Extreme)
apr_risk_of_mortality Mortality risk assigned standard score on scale from 1 (Minor) to 4 (Extreme)
Case Study: Analyzing Healthcare Data in Tableau

Your final deliverable

Create a dashboard that enables your stakeholders to:

  • Progress through key insights in a logical flow
  • View informative, concise visuals
  • Get data to make business decisions to improve efficiency

Dashboard_Compilation_Final.png to be adapted to Tableau

Case Study: Analyzing Healthcare Data in Tableau

Let's start analyzing!

Case Study: Analyzing Healthcare Data in Tableau

Preparing Video For Download...