Creating a dynamic dashboard
Case Study: Analyzing Healthcare Data in Tableau

Maarten Van den Broeck
Senior Content Developer, DataCamp
Measuring hospital efficiency
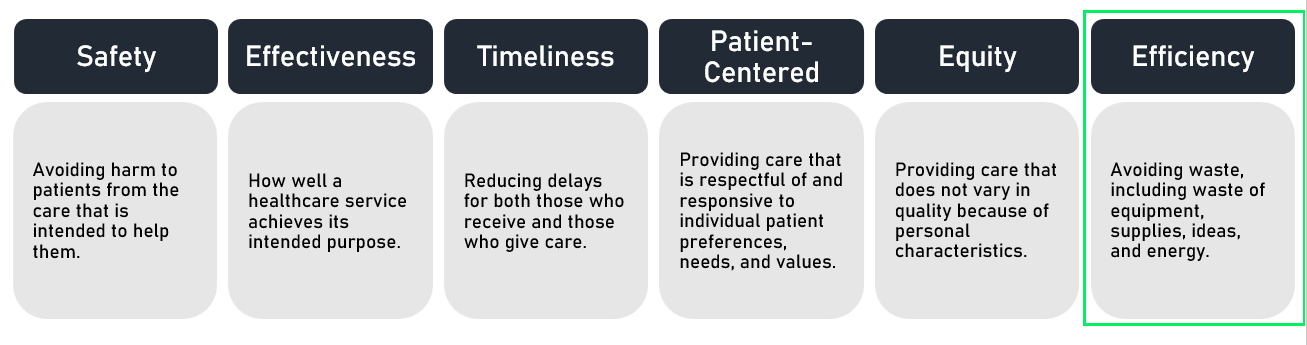
Key insights uncovered
![]()
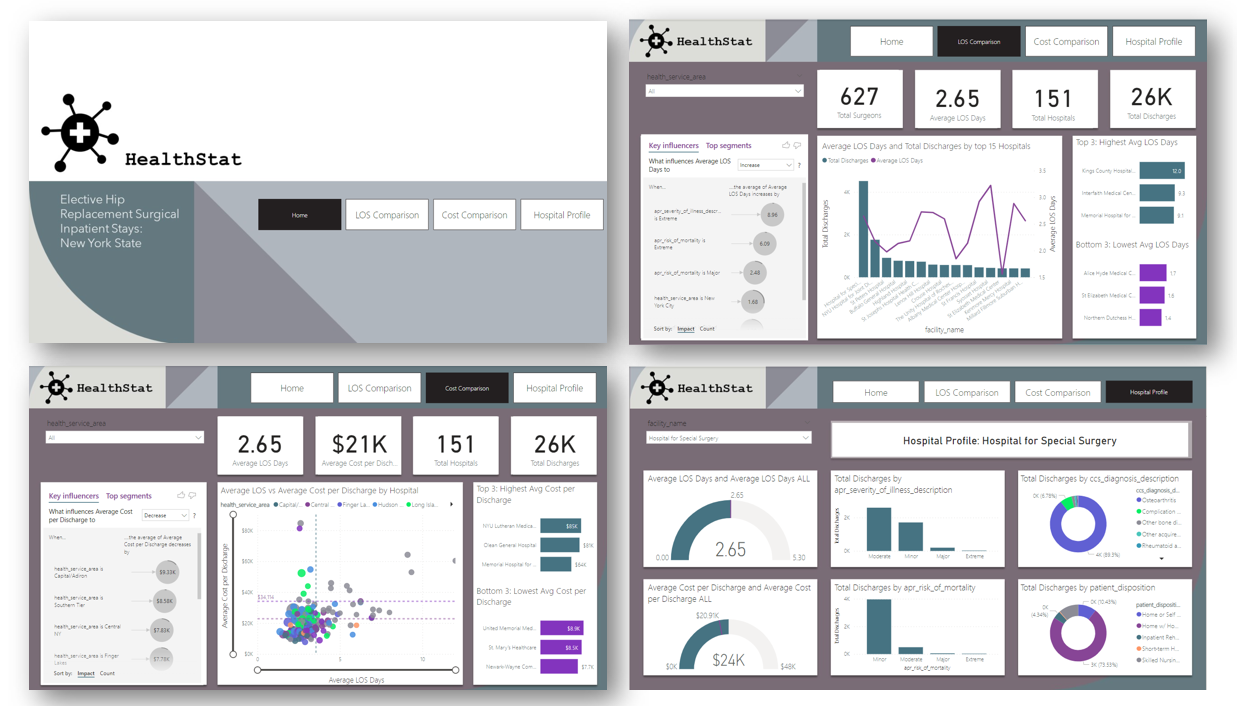
The final product
Case Study: Analyzing Healthcare Data in Tableau
Maarten Van den Broeck
Senior Content Developer, DataCamp
![]()

