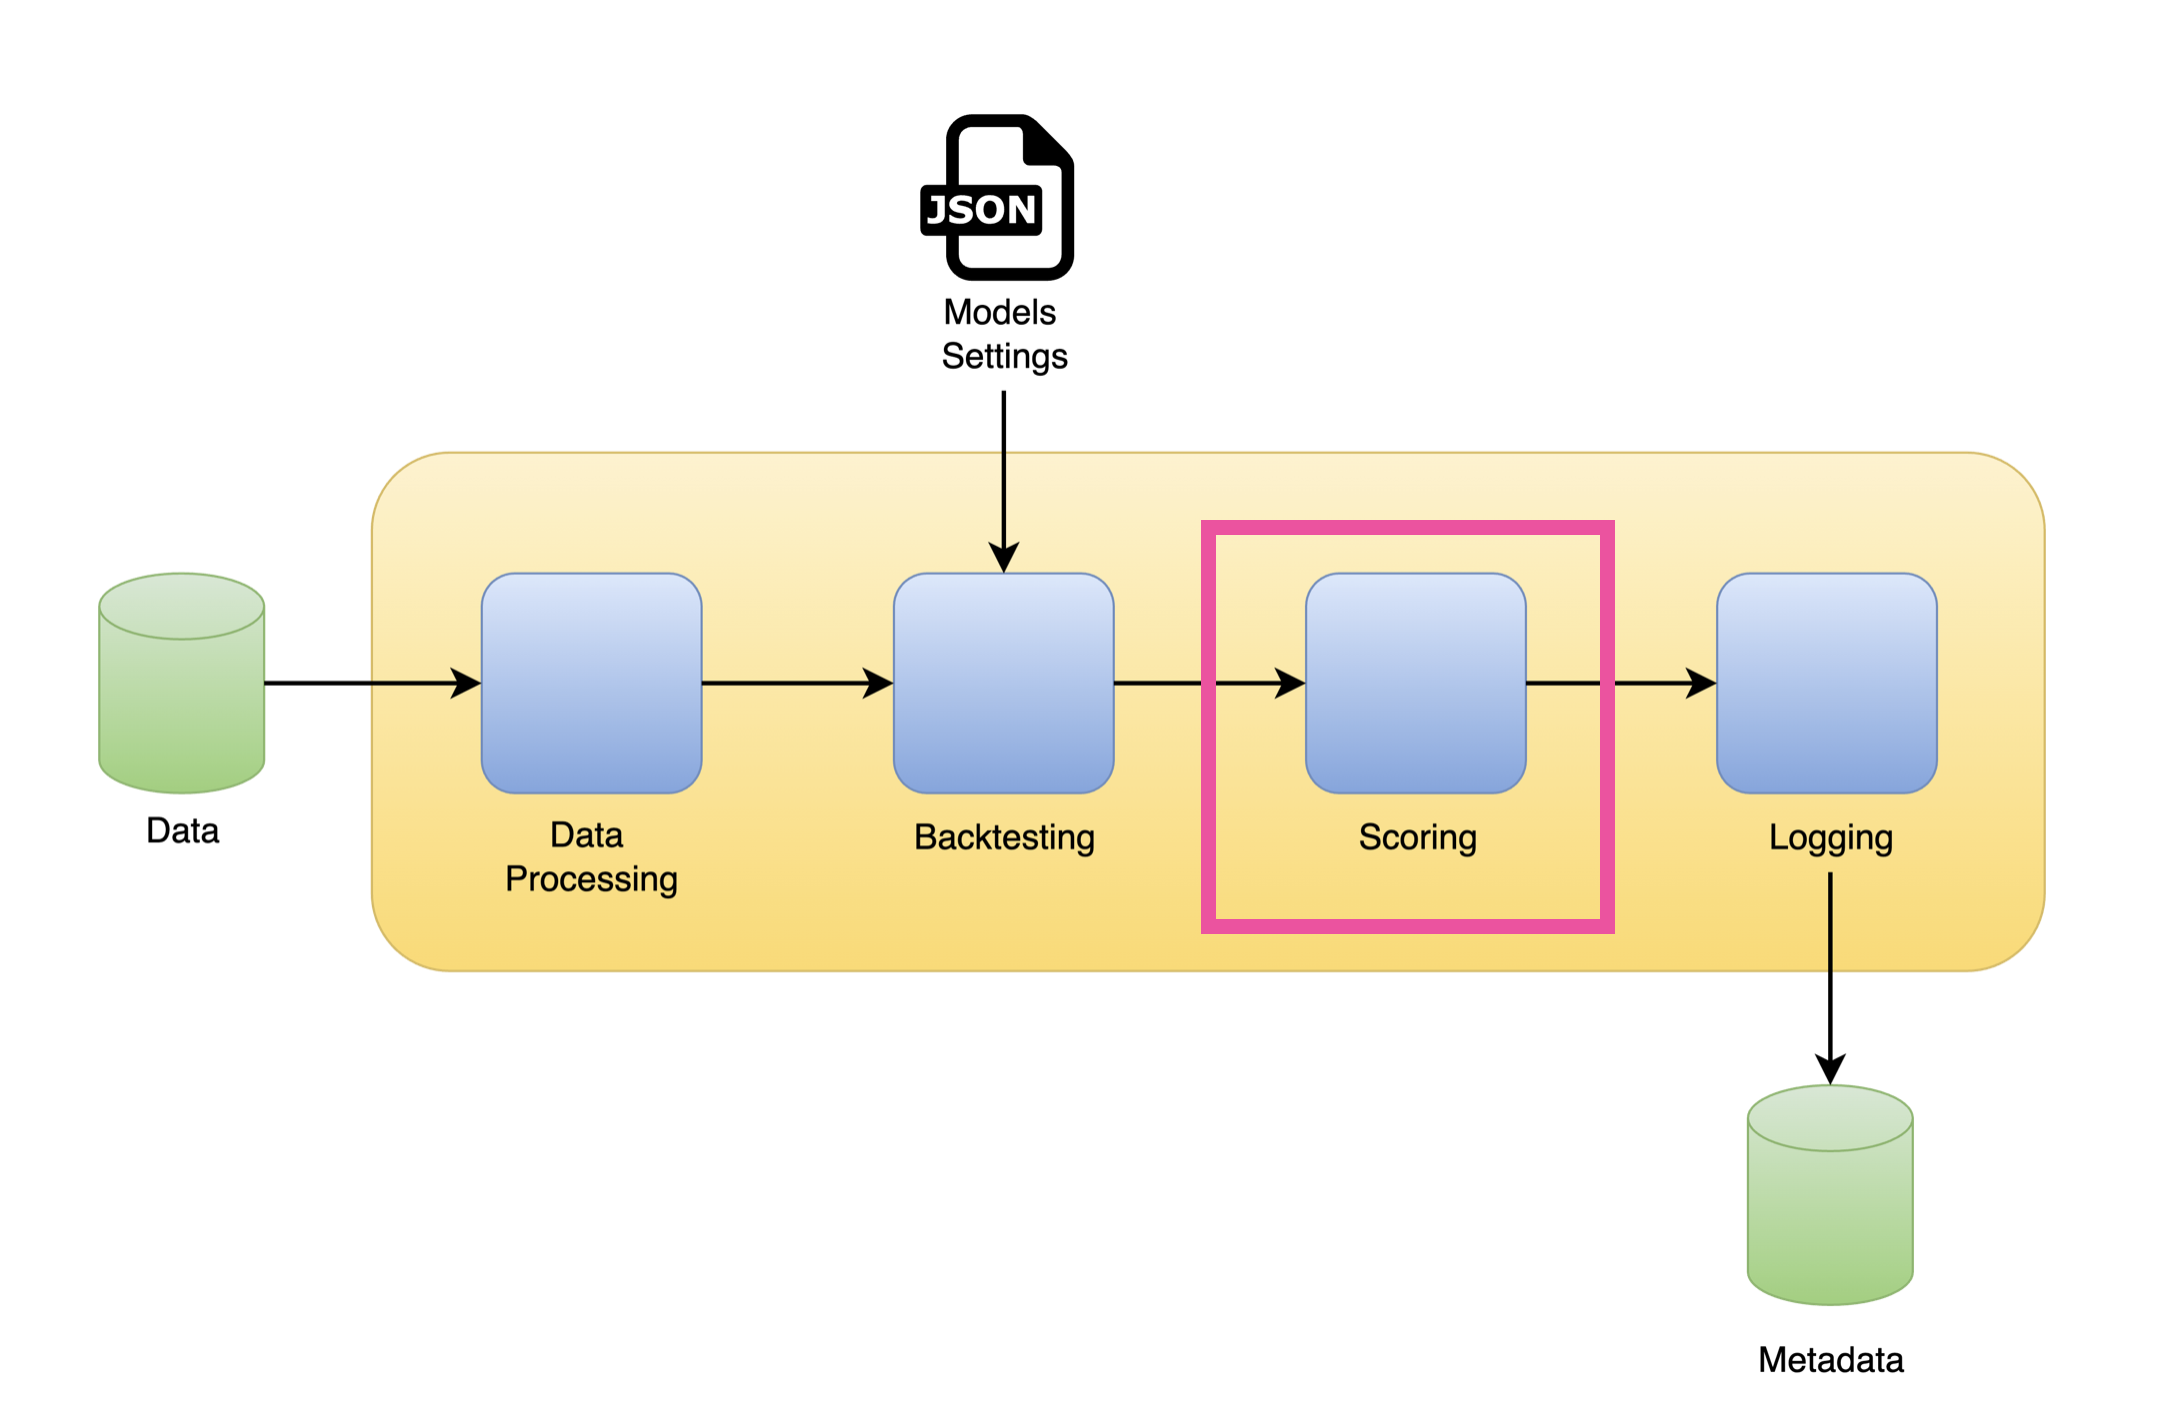
Model Scoring
Designing Forecasting Pipelines for Production

Rami Krispin
Senior Manager, Data Science and Engineering
Workflow
Reformat the backtesting output
print(bkt_df.head())
     unique_id    ds                     cutoff                 y            lightGBM
0    1            2024-04-22 00:00:00    2024-04-21 23:00:00    421082.60    421089.155837
1    1            2024-04-22 01:00:00    2024-04-21 23:00:00    429728.30    425700.453391
2    1            2024-04-22 02:00:00    2024-04-21 23:00:00    430690.96    424382.613668
3    1            2024-04-22 03:00:00    2024-04-21 23:00:00    420094.58    409967.877157
4    1            2024-04-22 04:00:00    2024-04-21 23:00:00    403292.36    393175.446116
Reformat the backtesting output
print(bkt_df[["ds", "lightGBM", "lightGBM-lo-95", "lightGBM-hi-95"]].head())
     ds                     lightGBM         lightGBM-lo-95   lightGBM-hi-95
0    2024-04-14 00:00:00    422716.385199    421022.905138    424409.865260
1    2024-04-14 01:00:00    422439.422659    417651.607031    427227.238288
2    2024-04-14 02:00:00    417209.926483    407277.565240    427142.287725
3    2024-04-14 03:00:00    405820.047603    392670.364652    418969.730553
4    2024-04-14 04:00:00    386520.594124    372017.701036    401023.487212
Reformat the backtesting output
cutoff = bkt_df["cutoff"].unique()
partitions_mapping = pd.DataFrame({"cutoff": cutoff,
    "partition": range(1, len(cutoff) + 1)})

print(partitions_mapping)
     cutoff                 partition
0    2024-04-13 23:00:00    1
1    2024-04-14 23:00:00    2
2    2024-04-15 23:00:00    3
3    2024-04-16 23:00:00    4
4    2024-04-17 23:00:00    5
Reformat the backtesting output
model_label = ["lightGBM", "xgboost", "linear_regression", "lasso", "ridge"]
model_name = ['LGBMRegressor', 'XGBRegressor', 'LinearRegression', 'Lasso', 'Ridge']

models_mapping = pd.DataFrame({"model_label": model_label, "model_name": model_name})
print(models_mapping)
        model_label        model_name
0       lightGBM           LGBMRegressor
1       xgboost            XGBRegressor
2       linear_regression  LinearRegression
3       lasso              Lasso
4       ridge              Ridge
Reformat the backtesting output
bkt_long = pd.melt(
    bkt_df,
    id_vars=["unique_id", "ds", "cutoff", "y"],
    value_vars=model_label + [f"{model}-lo-95" for model in model_label] \
                      + [f"{model}-hi-95" for model in model_label],
    var_name="model_label",
    value_name="value")
Reformat the backtesting output
print(bkt_long.head())
  unique_id      ds                 cutoff          y    model_label    value
0    1  2024-11-19 00:00:00  2024-11-18 23:00:00  477465  lightGBM  478914.014832
1    1  2024-11-19 01:00:00  2024-11-18 23:00:00  475805  lightGBM  482088.981788
2    1  2024-11-19 02:00:00  2024-11-18 23:00:00  469719  lightGBM  477138.303561
3    1  2024-11-19 03:00:00  2024-11-18 23:00:00  458311  lightGBM  466026.700362
4    1  2024-11-19 04:00:00  2024-11-18 23:00:00  441835  lightGBM  446428.477909
Reformat the backtesting output
def split_model_confidence(model_name): if "-lo-95" in model_name: return model_name.replace("-lo-95", ""), "lower" elif "-hi-95" in model_name: return model_name.replace("-hi-95", ""), "upper" else: return model_name, "forecast"bkt_long["model_label"],\ bkt_long["type"] = zip(*bkt_long["model_label"].map(split_model_confidence))
Reformat the backtesting output
bkt_long = bkt_long.merge(partitions_mapping, how = "left", on = ["cutoff"])bkt = (bkt_long .pivot(index = ["unique_id", "ds", "model_label", "partition", "y"], columns = "type", values = "value") .reset_index() .merge(models_mapping, how = "left", on = ["model_label"]))
Reformat the backtesting output
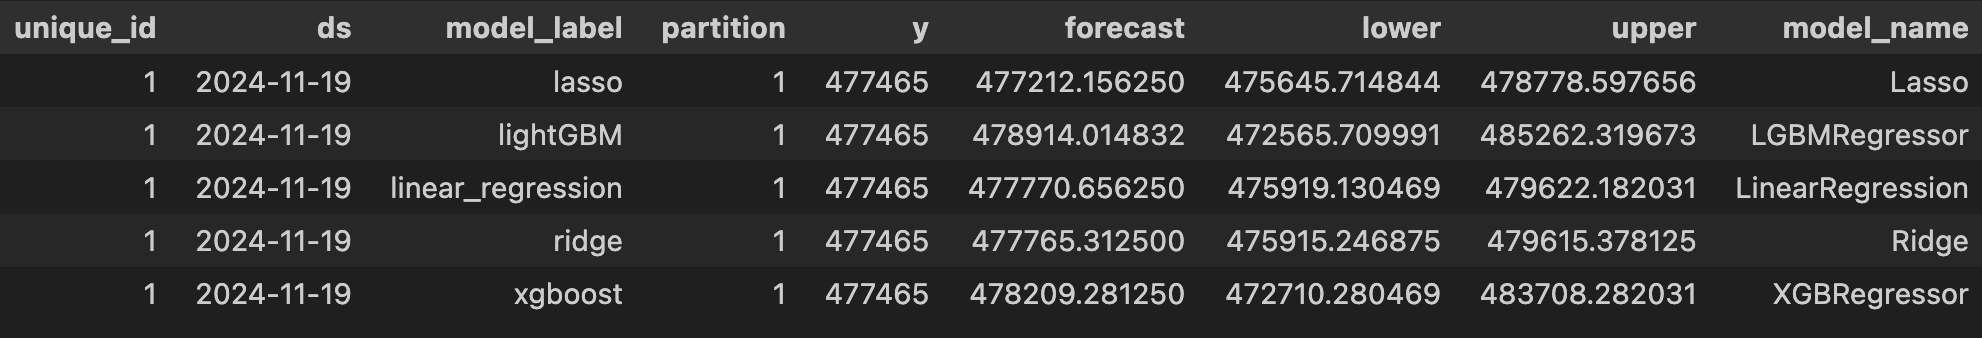
Performance metrics
def mape(y, yhat):
    mape = mean(abs(y - yhat)/ y)
    return mape

def rmse(y, yhat):
    rmse = (mean((y - yhat) ** 2 )) ** 0.5
    return rmse

def coverage(y, lower, upper):
    coverage = sum((y <= upper) & (y >= lower)) / len(y)
    return coverage
Performance metrics
Helper function:
def score(df):
    mape_score = mape(y = df["y"], yhat = df["forecast"])
    rmse_score = rmse(y = df["y"], yhat = df["forecast"])
    coverage_score = coverage(y = df["y"], lower = df["lower"], upper = df["upper"])
    cols = ["mape", "rmse", "coverage"]
    d = pd.Series([mape_score, rmse_score,  coverage_score], index=cols)

    return d
Performance metrics
Score the models:
score_df = (bkt
.groupby(["unique_id", "model_label", "model_name", "partition"])[["unique_id",
"model_label", "model_name", "partition", "y", "forecast", "lower", "upper"]]
.apply(score)
.reset_index())
Performance metrics
print(score_df.head())
     unique_id   model     partition    mape        rmse            coverage
0    1           lasso     1            0.050913    29315.983715    0.486111
1    1           lasso     2            0.037723    19034.393950    0.763889
2    1           lasso     3            0.017668    9768.991810     0.986111
3    1           lasso     4            0.014224    7839.292592     1.000000
4    1           lasso     5            0.023679    13550.628885    0.847222
Workflow
MLflow

MLflow workflow
- Define experiment
- Run experiment
- Log parameters
- Log KPIs
- Compare and analyze experiment results
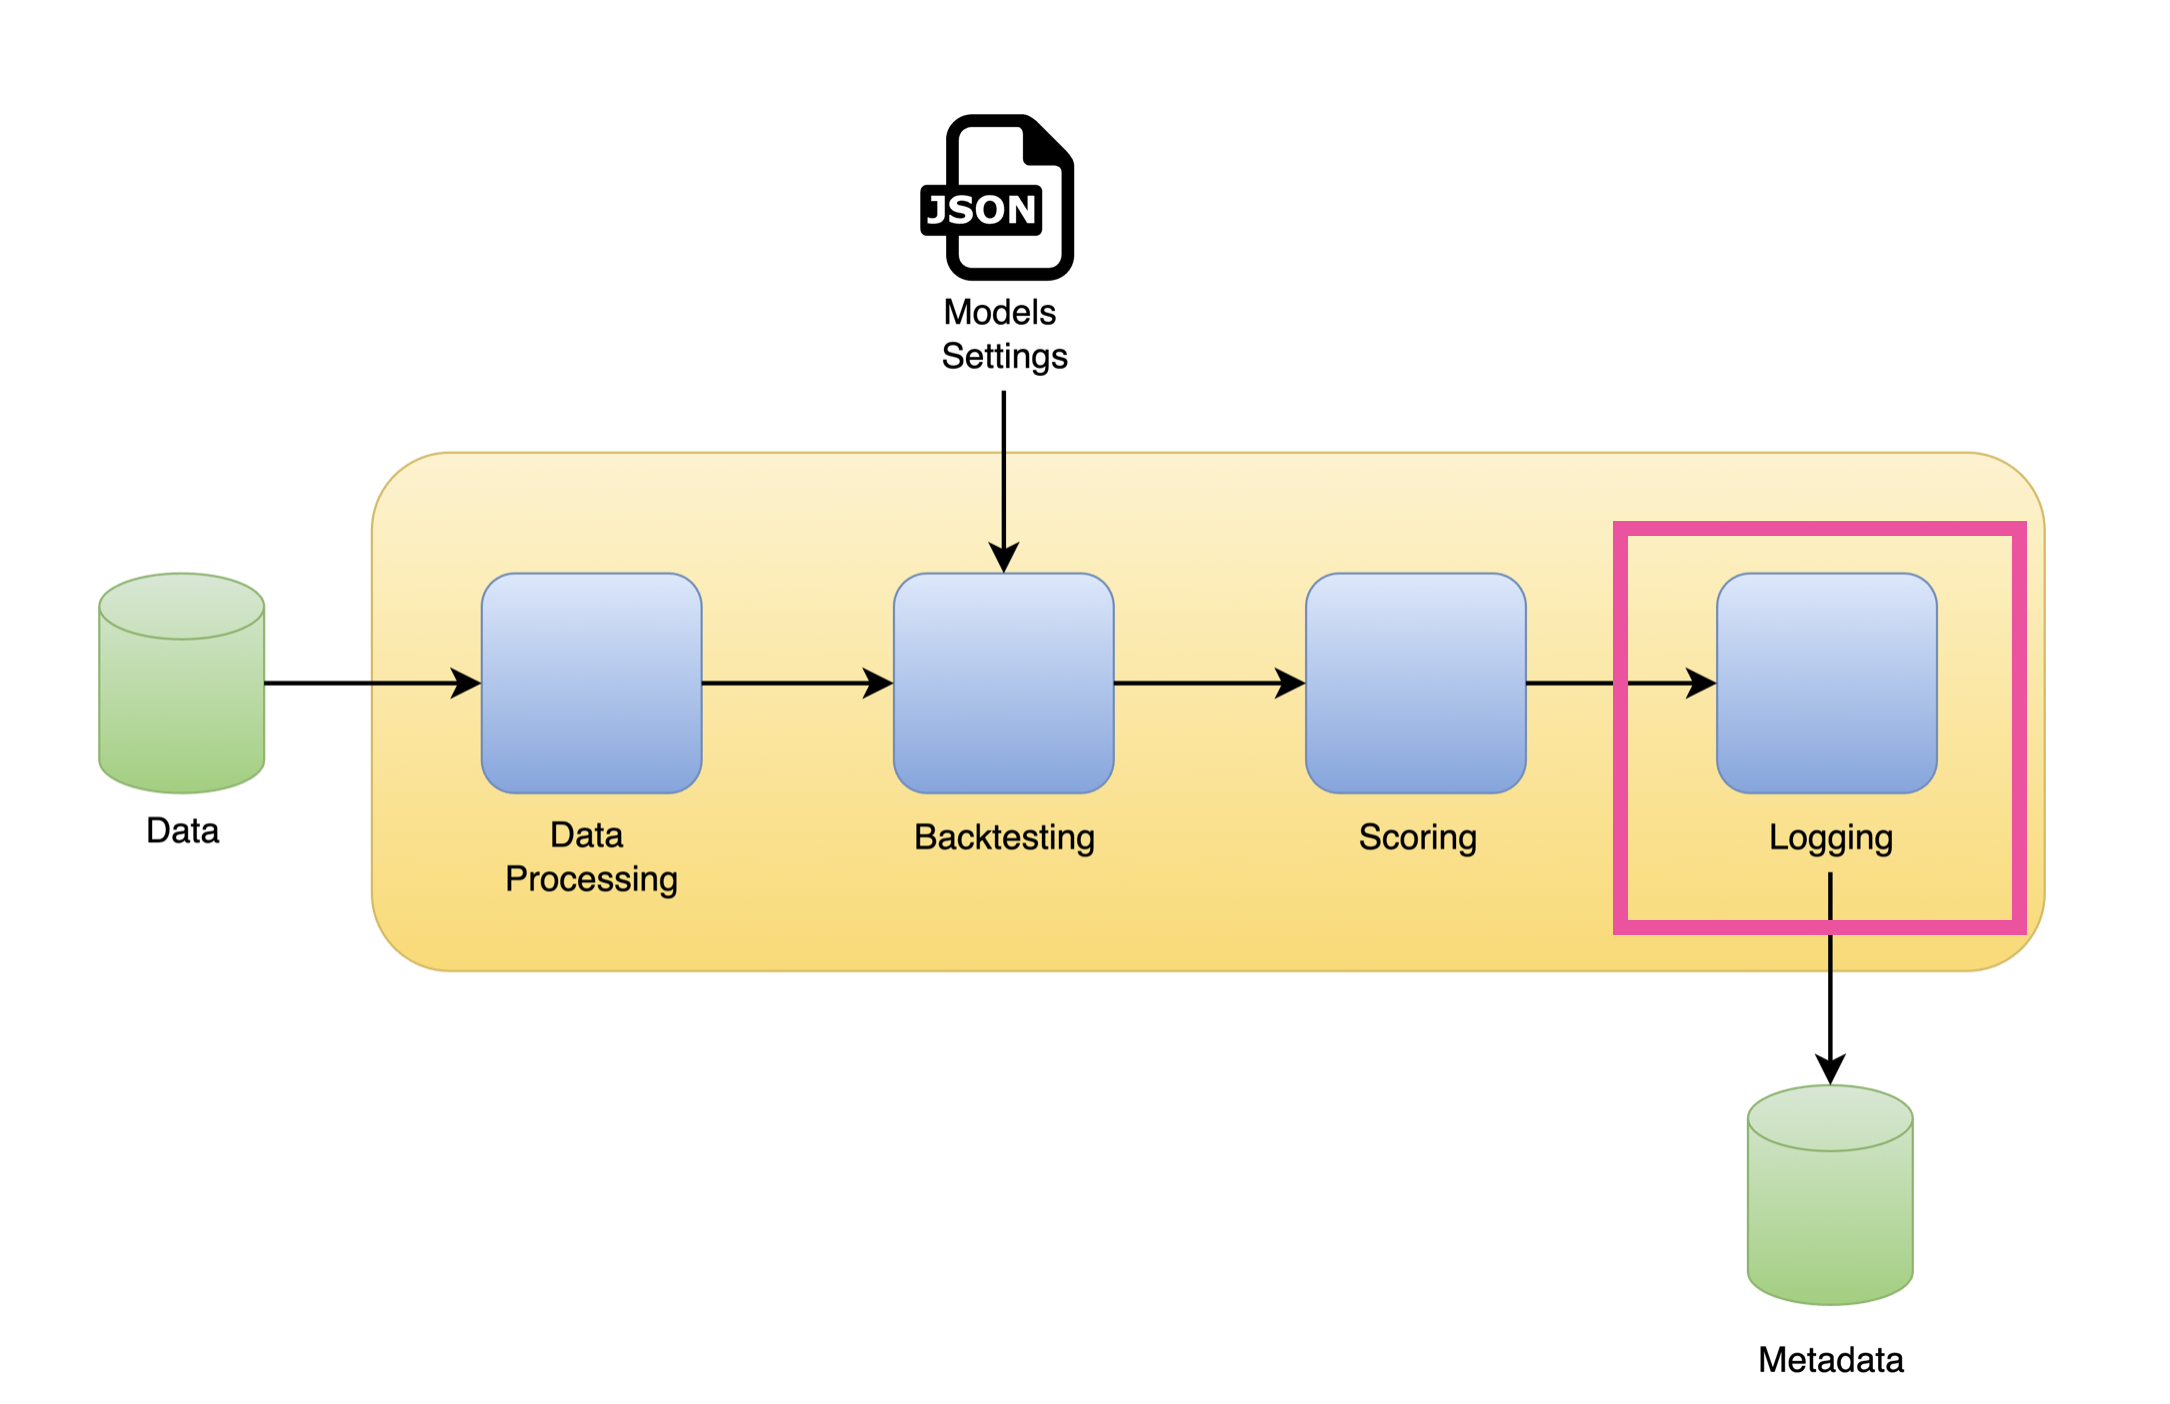
Log the backtesting
import mlflow import datetime experiment_name = "ml_forecast" mlflow_path = "file:///mlruns"tags = {"h": h, "step_size": step_size, "partitions": partitions, "intervals_type": "ConformalIntervals", "intervals_h": h, "intervals_n_windows": n_windows, "intervals_method": "conformal_distribution", "levels": levels }
Log the backtesting
try: mlflow.create_experiment(name = experiment_name, artifact_location= mlflow_path, tags = tags) meta = mlflow.get_experiment_by_name(experiment_name) print(f"Set a new experiment {experiment_name}") print("Pulling the metadata")except: print(f"Experiment {experiment_name} exists, pulling the metadata") meta = mlflow.get_experiment_by_name(experiment_name)
Set a new experiment ml_forecast
Pulling the metadata
run_time = datetime.datetime.now().strftime("%Y-%m-%d %H-%M-%S")
Log the backtesting
for index, row in score_df.iterrows():run_name = row["model_label"] + "-" + run_timewith mlflow.start_run(experiment_id = meta.experiment_id, run_name = run_name, tags = {"type": "backtesting","partition": row["partition"], "unique_id": row["unique_id"],"model_label": row["model_label"], "model_name": row["model_name"],"run_name": run_name}) as run:model_params = ml_models[row["model_label"]].get_params() model_params["model_name"] = row["model_name"] model_params["model_label"] = row["model_label"] model_params["partition"] = row["partition"] model_params["lags"] = list(range(1, 24)) model_params["date_features"] = ["month", "day", "dayofweek", "week", "hour"] mlflow.log_params(model_params)mlflow.log_metric("mape", row["mape"]) mlflow.log_metric("rmse", row["rmse"]) mlflow.log_metric("coverage", row["coverage"])
Let's practice!
Designing Forecasting Pipelines for Production

