Reviewing the input data

Designing Forecasting Pipelines for Production

Rami Krispin

Senior Manager, Data Science and Engineering

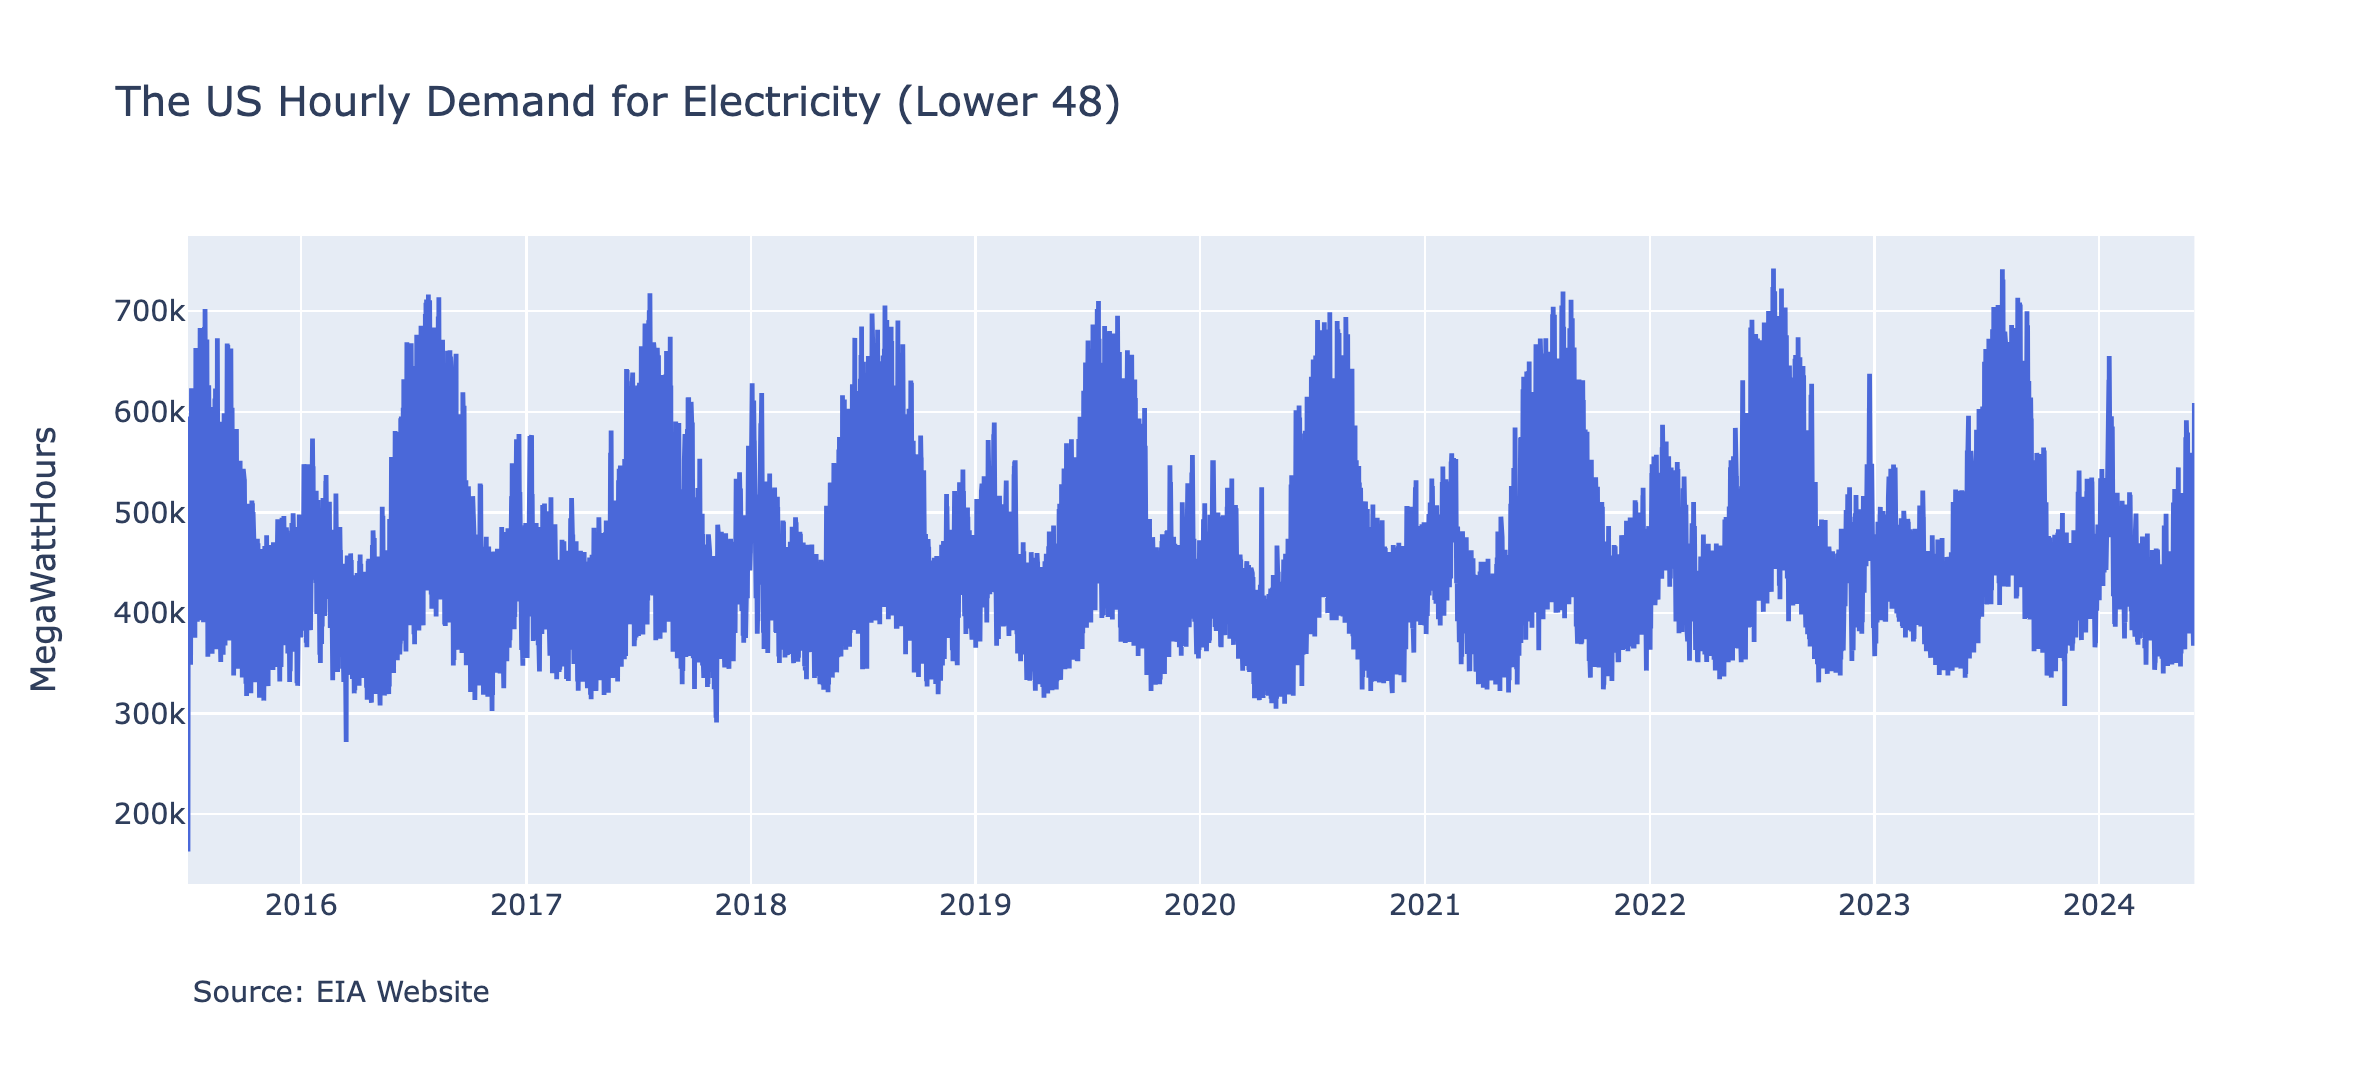
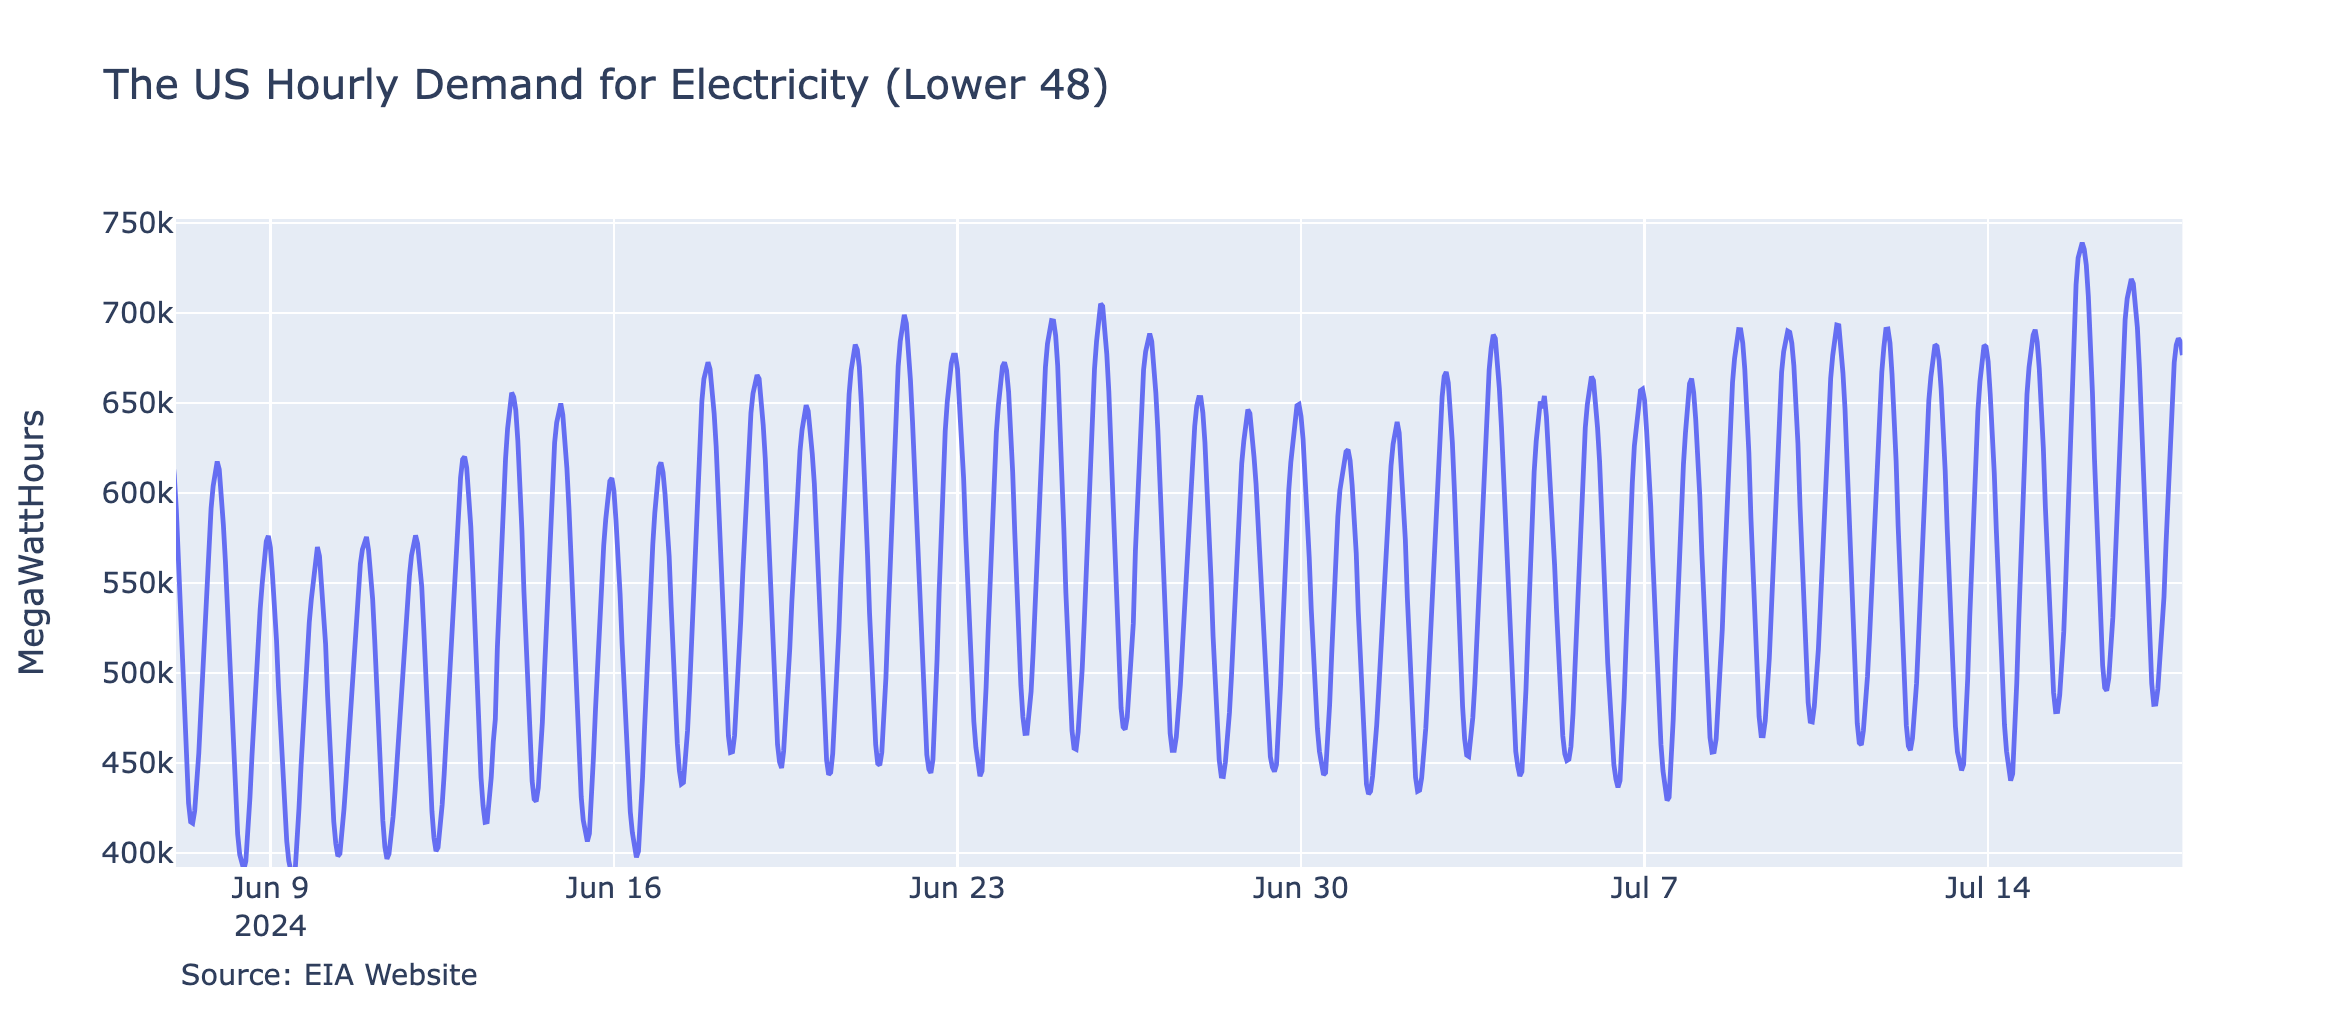
The US hourly electricity demand

Time series plot showing seasonal trends in electricity demand year-to-year

Designing Forecasting Pipelines for Production

Seasonality analysis

Time series plot showing seasonal trends in electricity demand at an hourly and daily level

Designing Forecasting Pipelines for Production

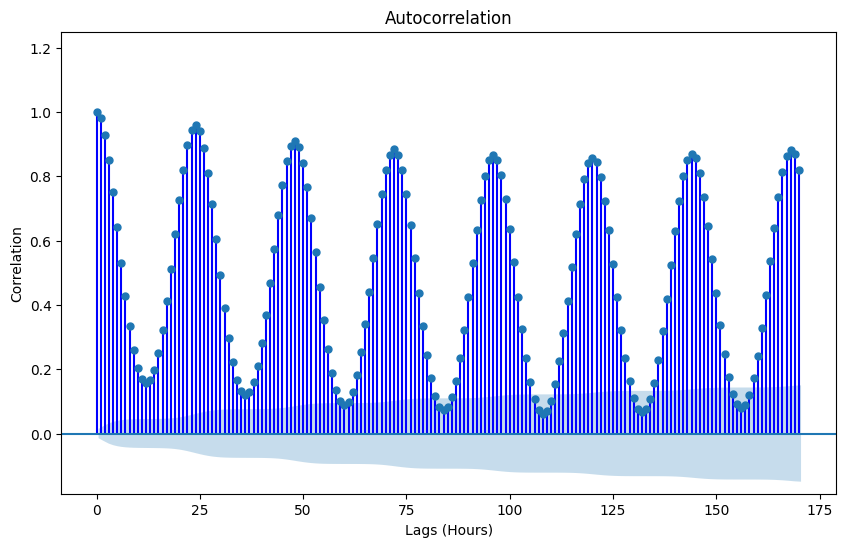
Autocorrelation analysis

ACF plot showing daily and weekly lags

Designing Forecasting Pipelines for Production

The EIA API

EIA Website

Designing Forecasting Pipelines for Production

The EIA API

EIA API

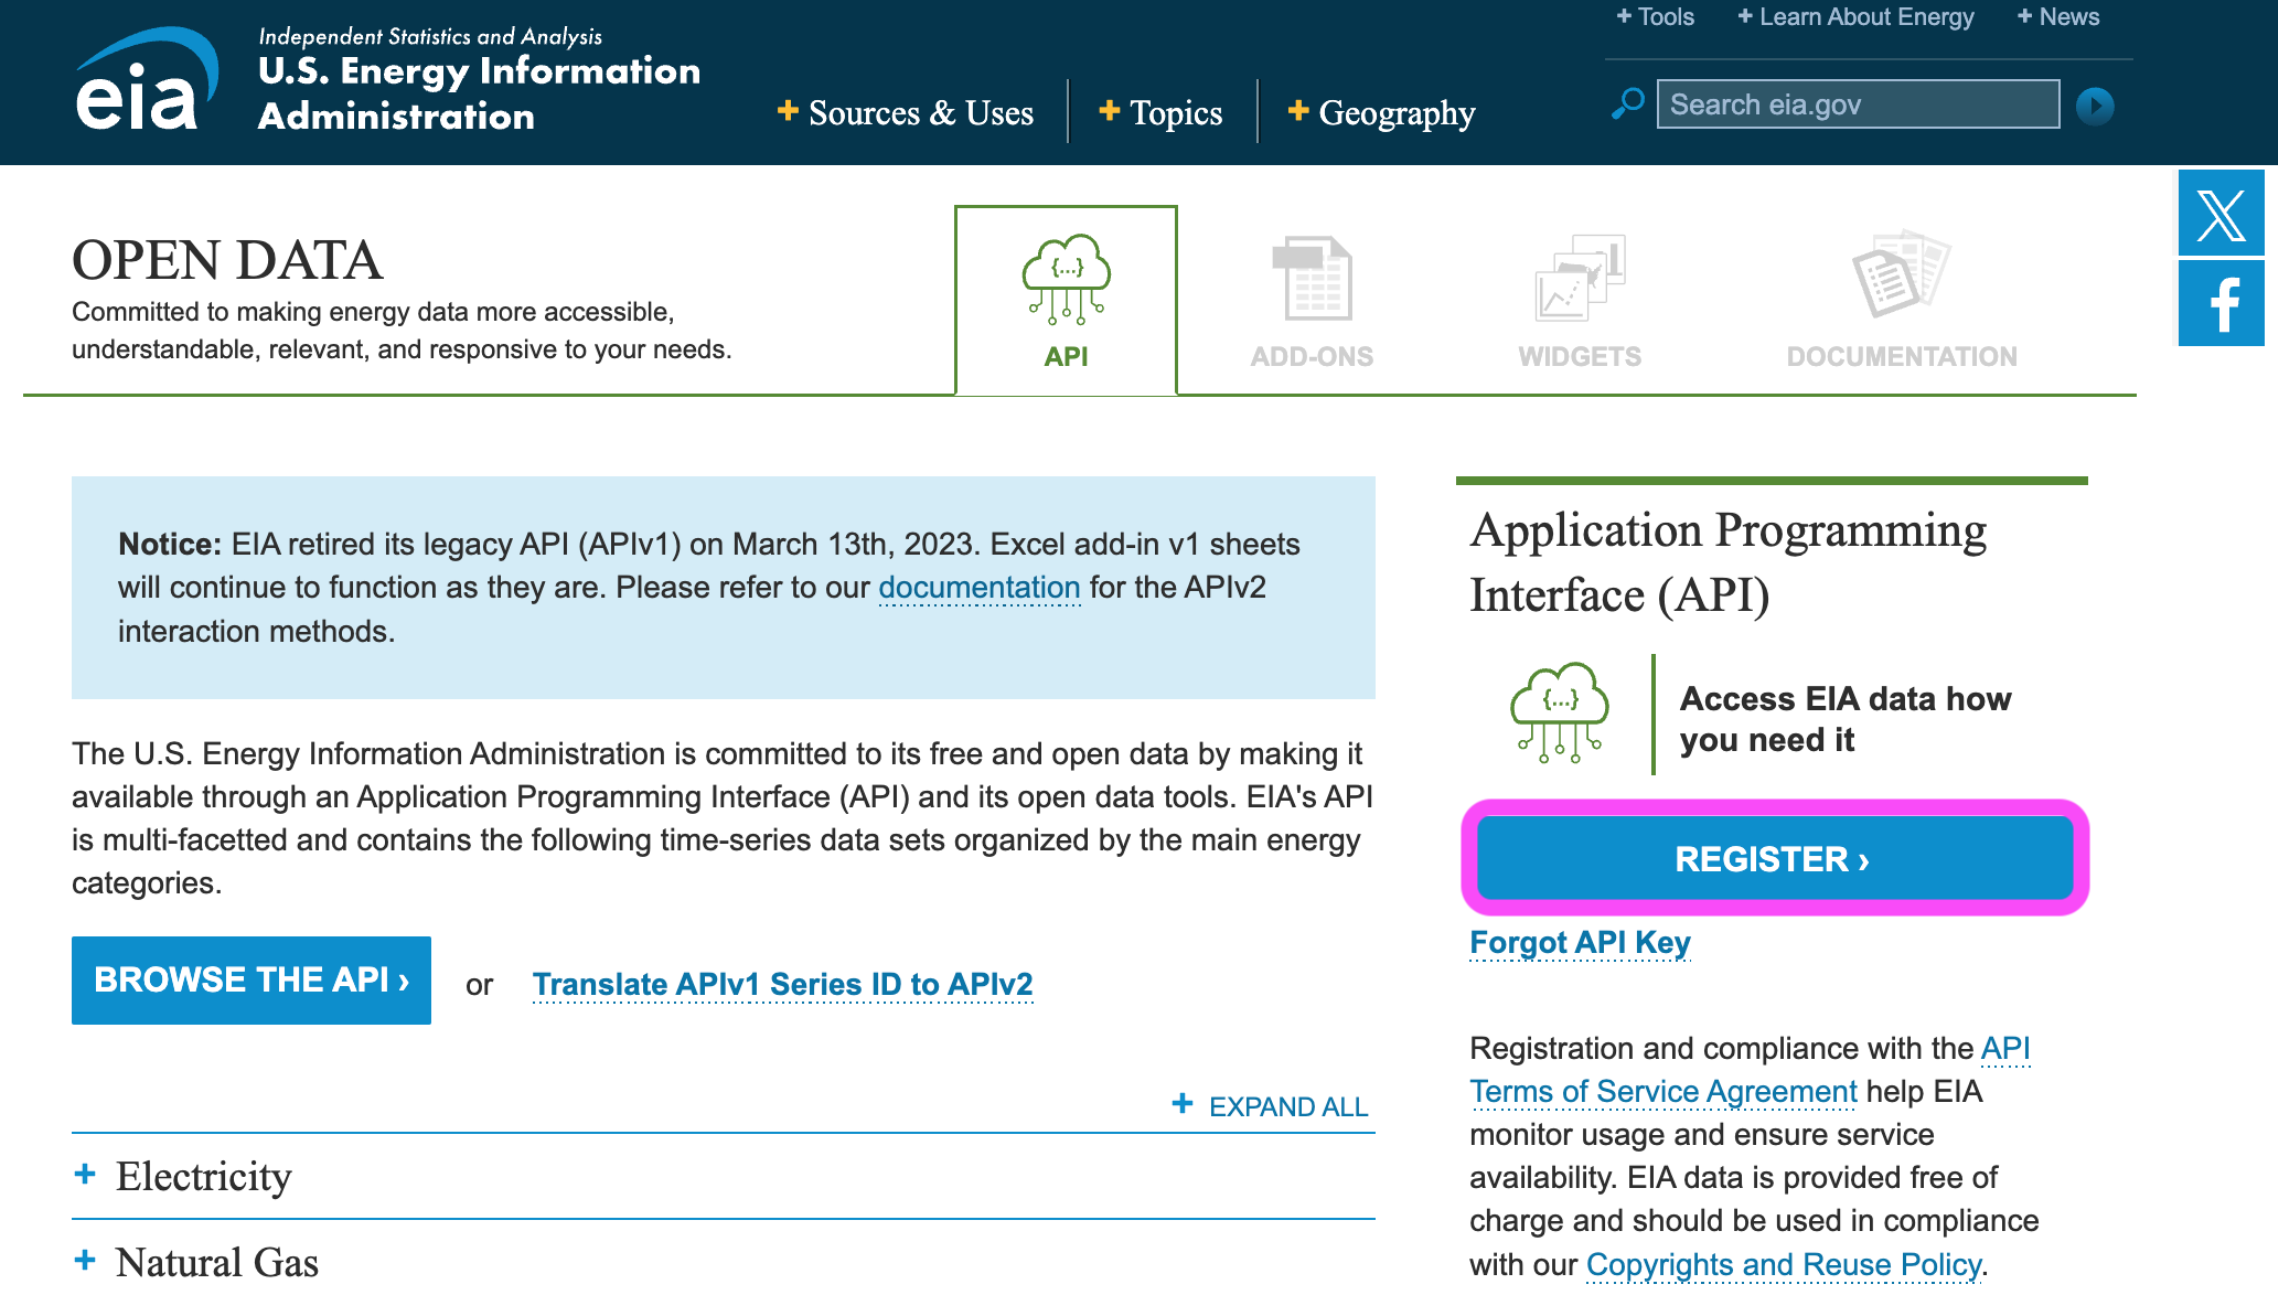
  • No API key required to complete this course 🎉
1 https://www.eia.gov/opendata/
Designing Forecasting Pipelines for Production

The EIA API

import requests
import pandas as pd
import os


Designing Forecasting Pipelines for Production

The EIA API

import requests
import pandas as pd
import os

api_url = "https://api.eia.gov/v2/"
api_path = "electricity/rto/region-data/"


Designing Forecasting Pipelines for Production

The EIA API

import requests
import pandas as pd
import os

api_url = "https://api.eia.gov/v2/"
api_path = "electricity/rto/region-data/"
get_request = api_url + api_path + "data/&data[]=value"

print(get_request)
https://api.eia.gov/v2/electricity/rto/region-data/data/&data[]=value
Designing Forecasting Pipelines for Production

The EIA API

eia_api_key = os.getenv('EIA_API_KEY')

get_request = get_request + "?api_key=" + eia_api_key
  • eia_api_key is personal and must be sourced from the EIA website
1 https://www.eia.gov/opendata/
Designing Forecasting Pipelines for Production

The EIA API

data = requests.get(get_request).json()
df = pd.DataFrame(data['response']['data'])
Designing Forecasting Pipelines for Production

The EIA API

data = requests.get(get_request).json()
df = pd.DataFrame(data['response']['data'])

print(df.head())
     period           respondent    respondent-name                              value
0    2022-04-06T07    AVA           Avista Corporation                           462894.0    
1    2024-04-06T07    AZPS          Arizona Public Service Company               463663.0    
2    2024-04-07T07    BANC          Balancing Authority of Northern California   464916.0    
3    2024-04-07T07    BPAT          Bonneville Power Administration              459376.0    
4    2024-04-07T07    CAL           California                                   441989.0    
Designing Forecasting Pipelines for Production

The EIA API

EIA API

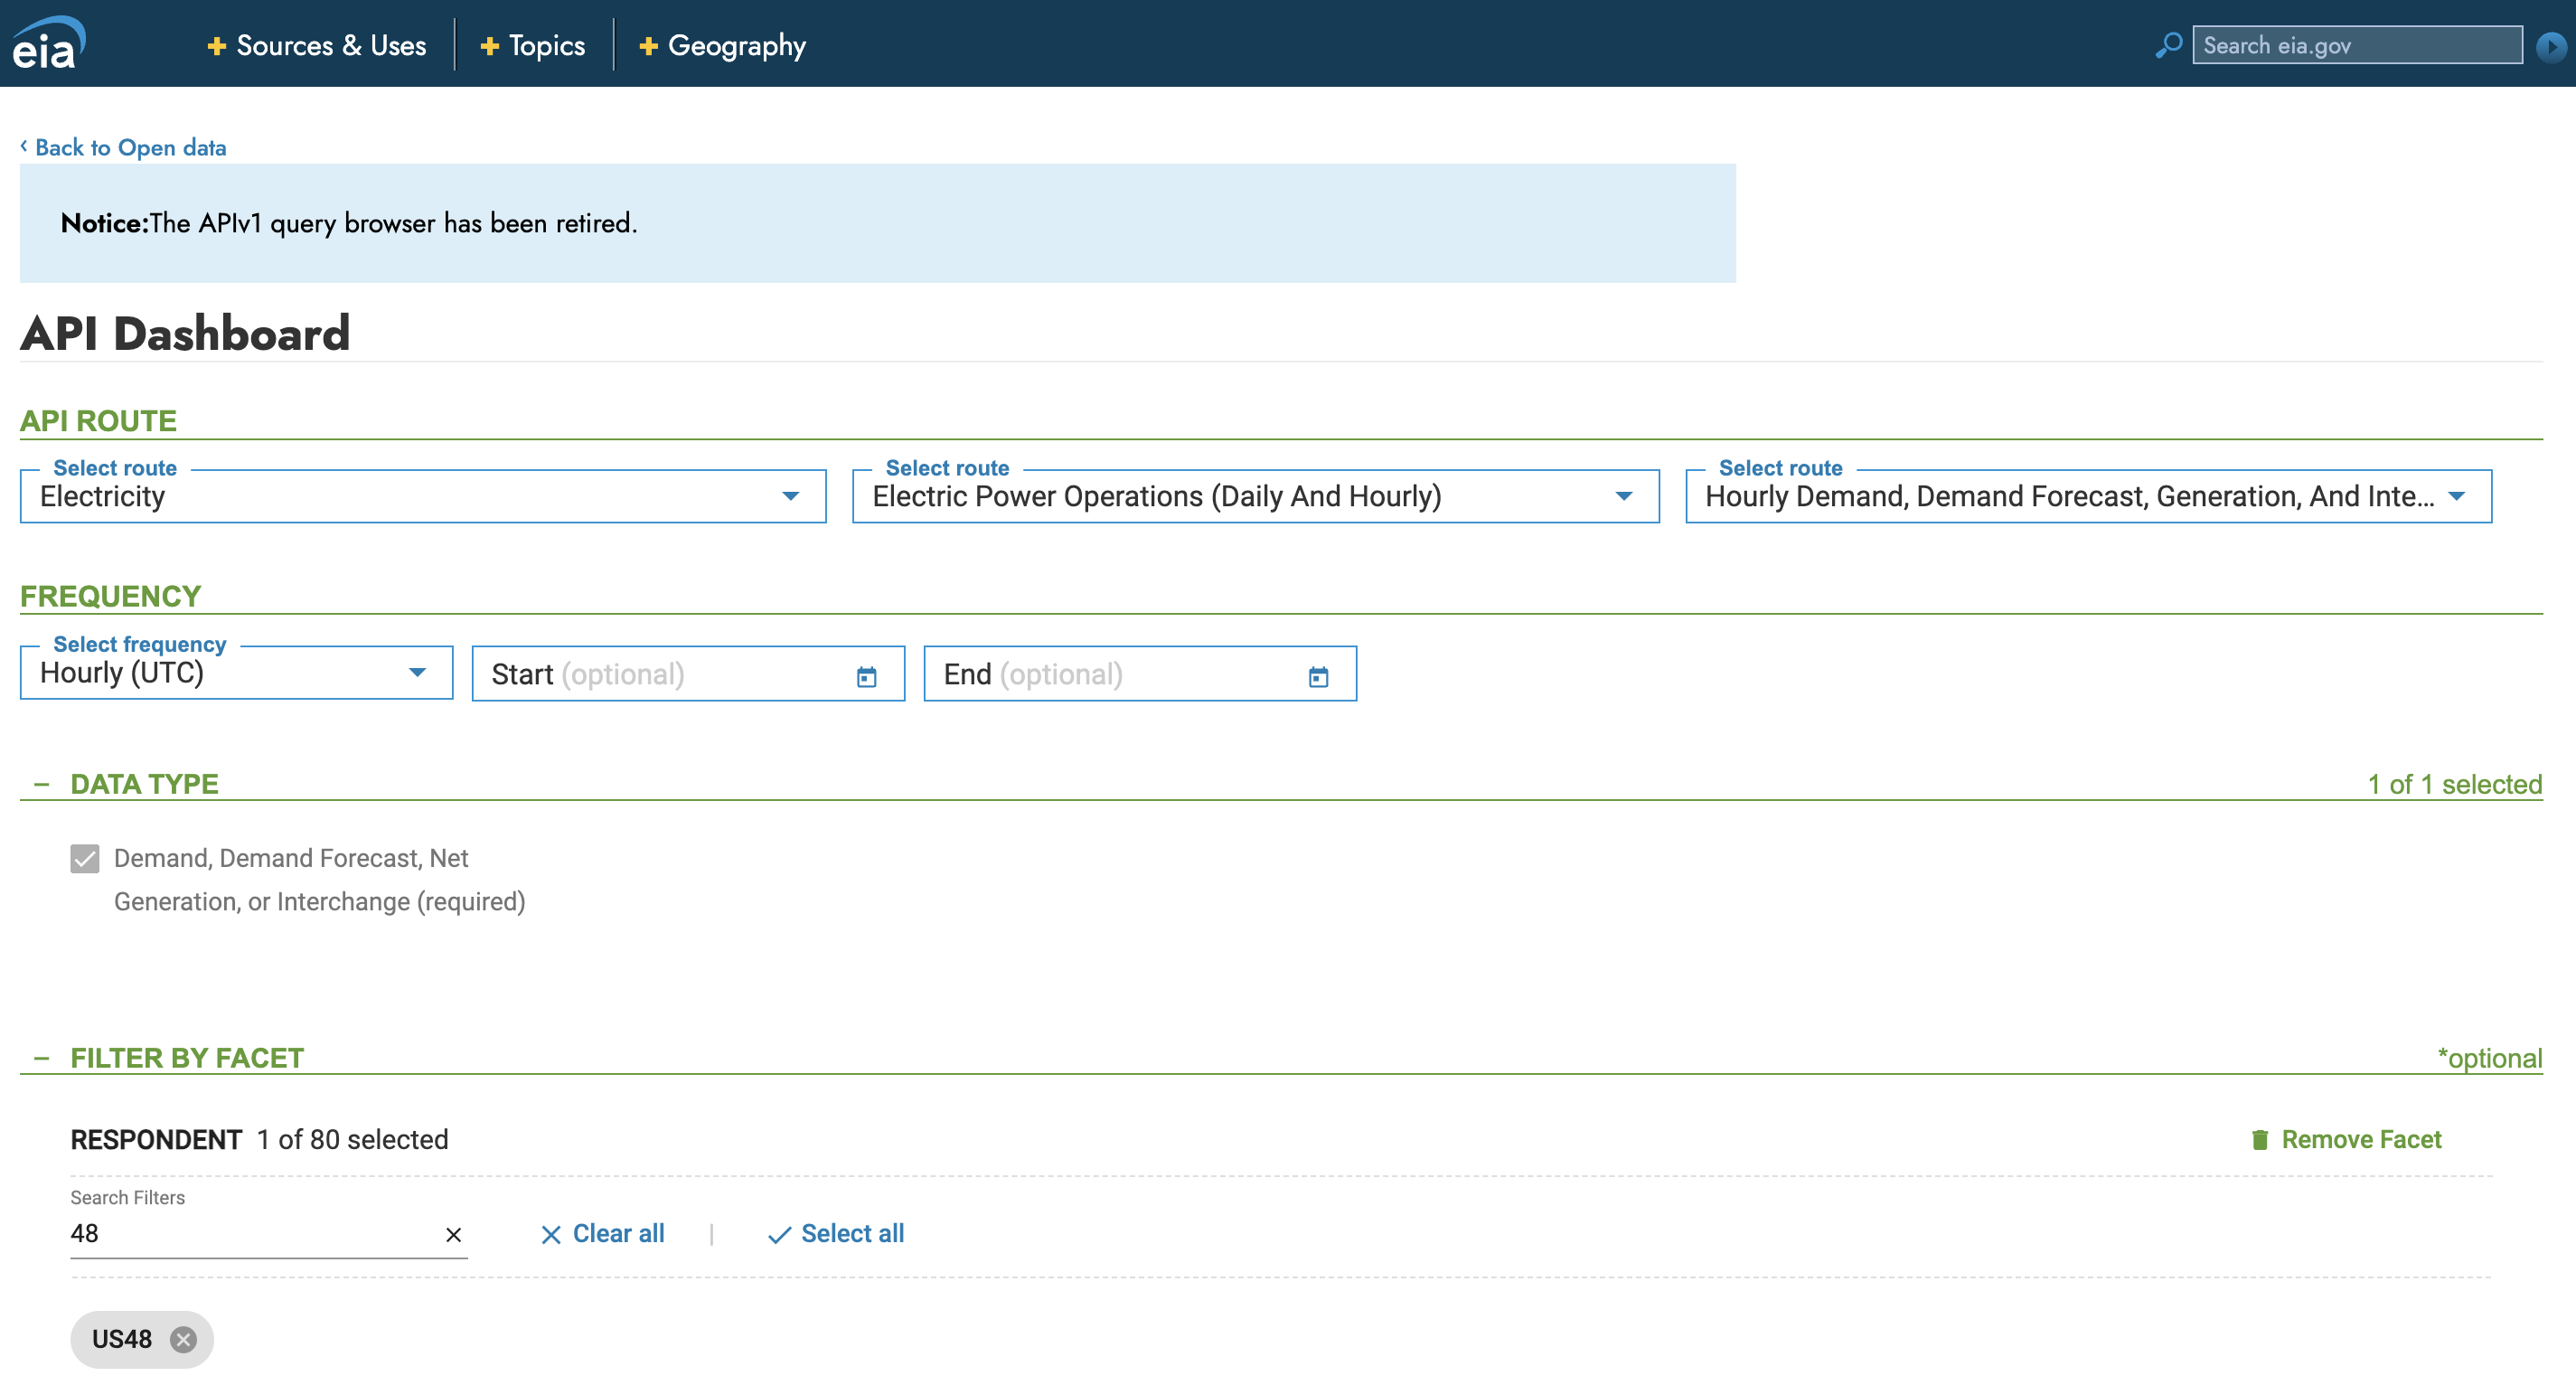
1 EIA API website: https://www.eia.gov/opendata/ 2 EIA API dashboard: https://www.eia.gov/opendata/browser/
Designing Forecasting Pipelines for Production

Data preparation

Data input format for statsforecast and mlforecast packages:

  1. unique_id - the series ID
  2. ds - the series timestamp
  3. y - the series values
df = pd.read_csv("data/data.csv")
ts = df[["period", "value"]]
ts["period"] = pd.to_datetime(ts["period"])
ts = ts.sort_values("period")
Designing Forecasting Pipelines for Production

Data preparation

Data input format:

  1. unique_id - the series ID
  2. ds - the series timestamp
  3. y - the series values
ts = ts[["period", "value"]]
ts["period"] = pd.to_datetime(ts["period"])
ts = ts.sort_values("period")

ts = ts.rename(columns = {"period": "ds", "value": "y"})
ts["unique_id"] = 1
Designing Forecasting Pipelines for Production

Data preparation

print(ts.head())
     ds                     y           unique_id
0    2022-04-06 23:00:00    462894.0    1
1    2022-04-07 00:00:00    463663.0    1
2    2022-04-07 01:00:00    464916.0    1
3    2022-04-07 02:00:00    459376.0    1
4    2022-04-07 03:00:00    441989.0    1
Designing Forecasting Pipelines for Production

Let's practice!

Designing Forecasting Pipelines for Production

Preparing Video For Download...