Welcome to the course!
Inference for Linear Regression in R
Jo Hardin
Professor, Pomona College
In this course you will
Make inferential claims about models.
Use least squares estimation.
Create confidence intervals for the slope.
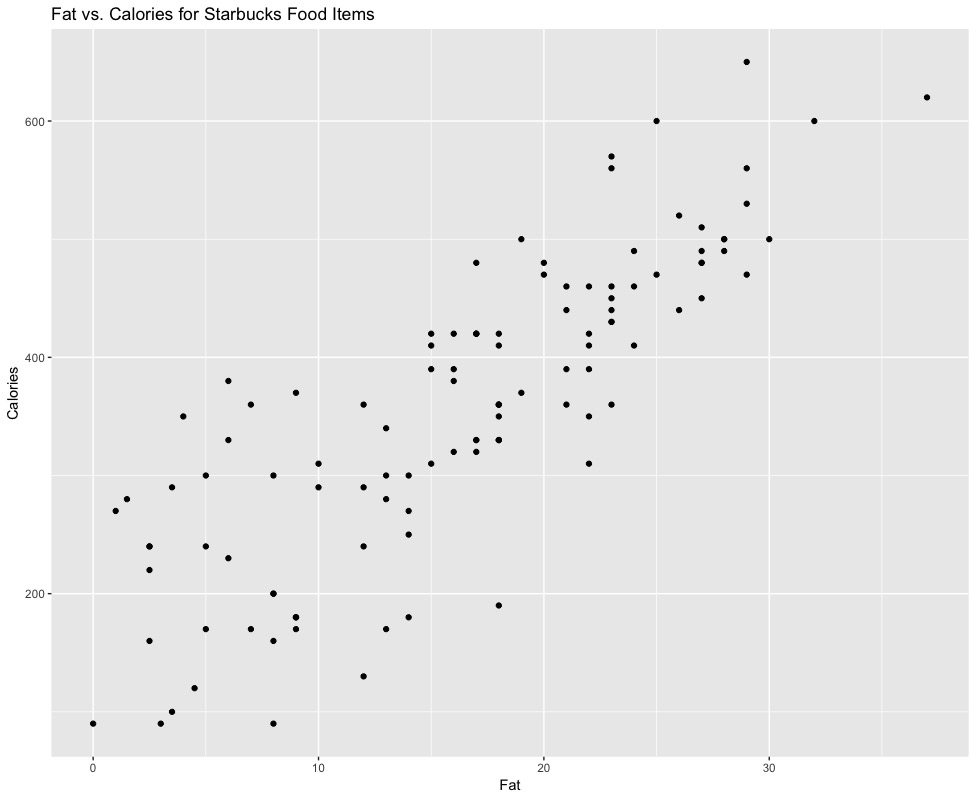
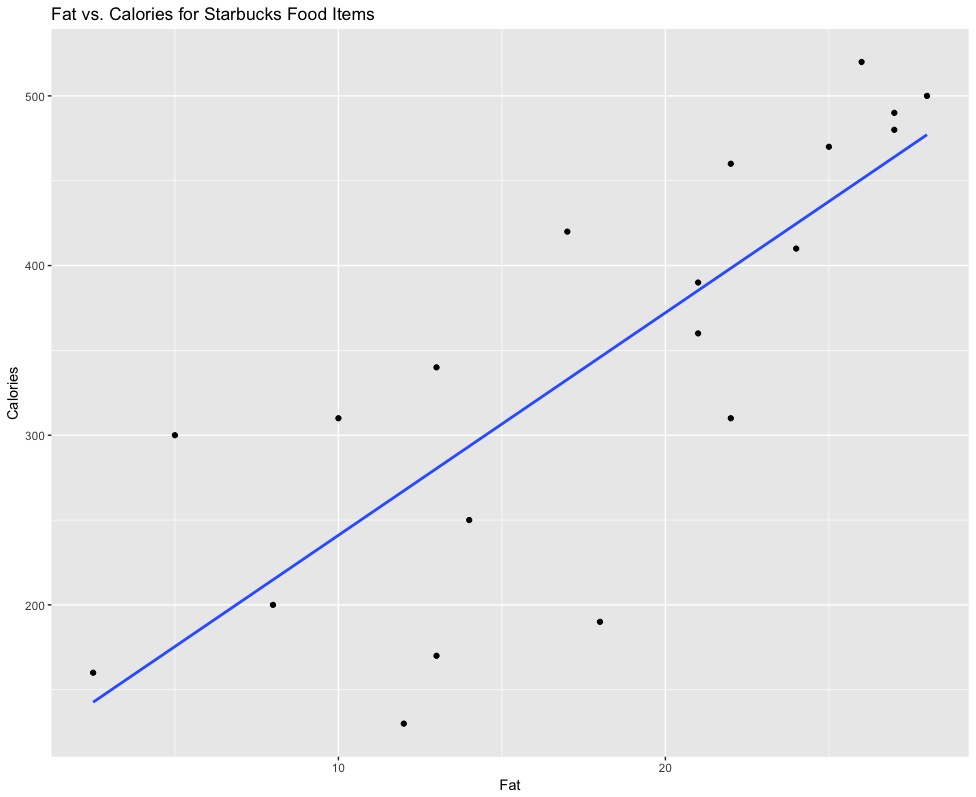
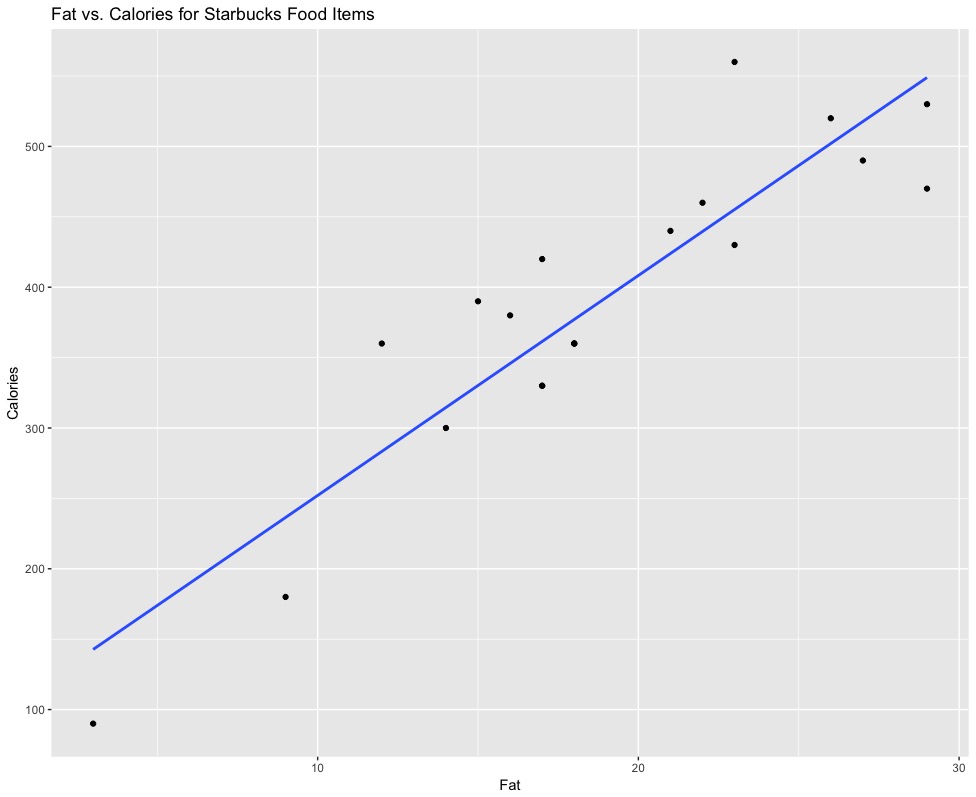
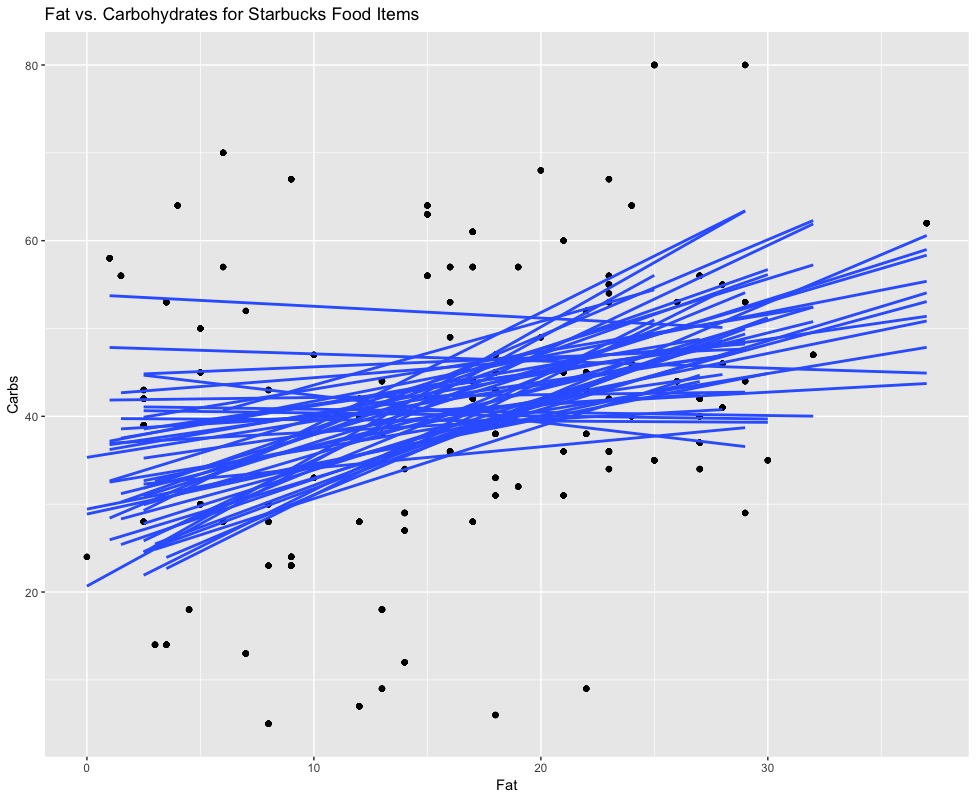
Sampling variability
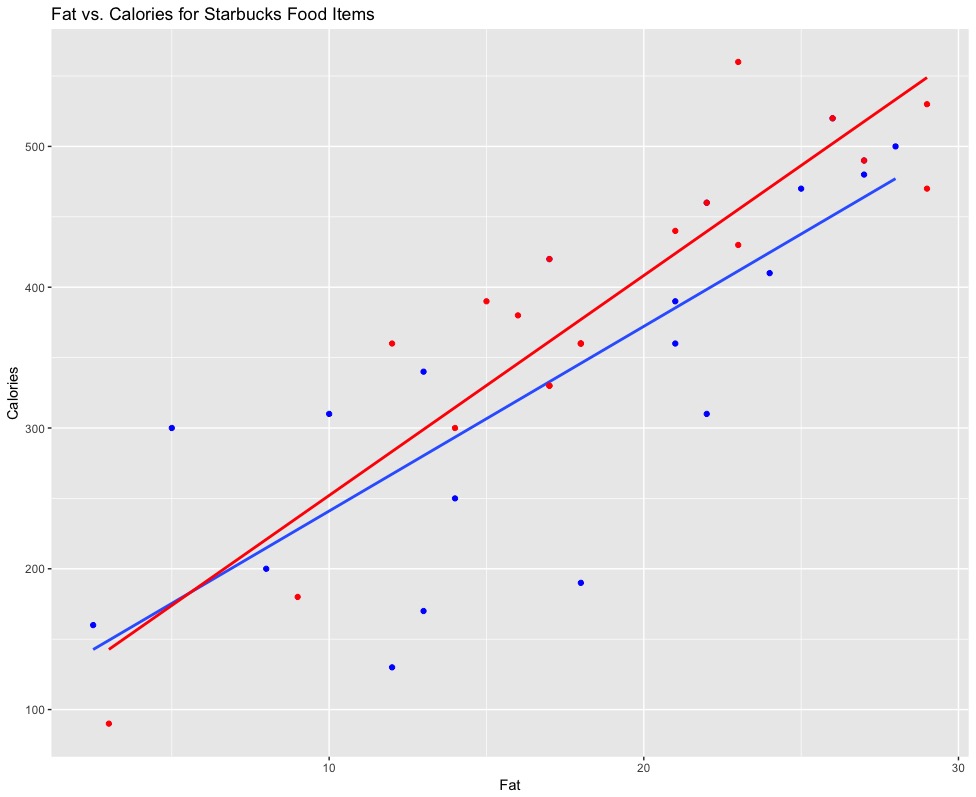
Variability in the regression line
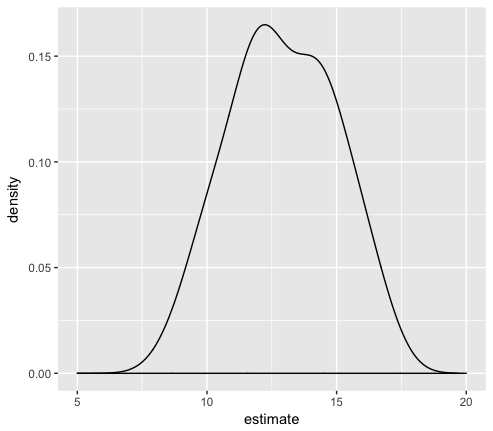
Interpret the density plot
Slopes between 8 and 17
None close to zero
Strong evidence the association is positive
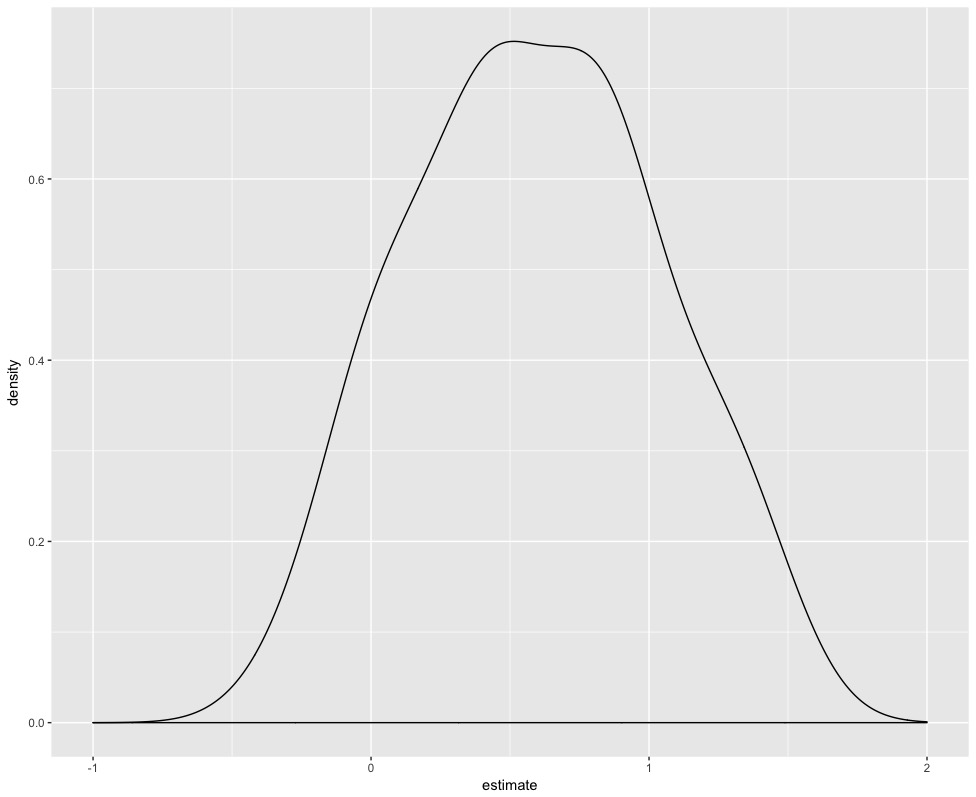
Interpreting the density plot
Some slopes close to zero
High variability
We can't make any conclusions
Let's practice!
Inference for Linear Regression in R
Preparing Video For Download...