Simulation-based Inference
Inference for Linear Regression in R

Jo Hardin
Professor, Pomona College
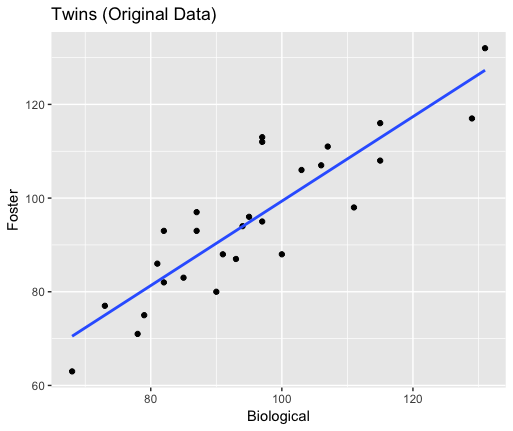
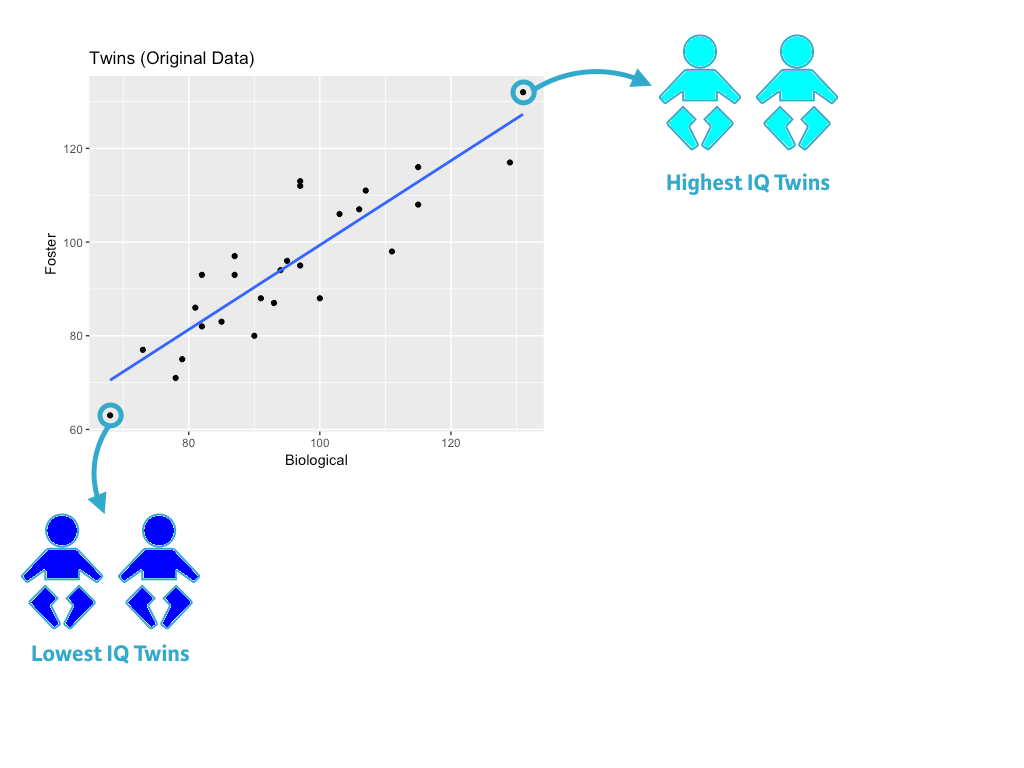
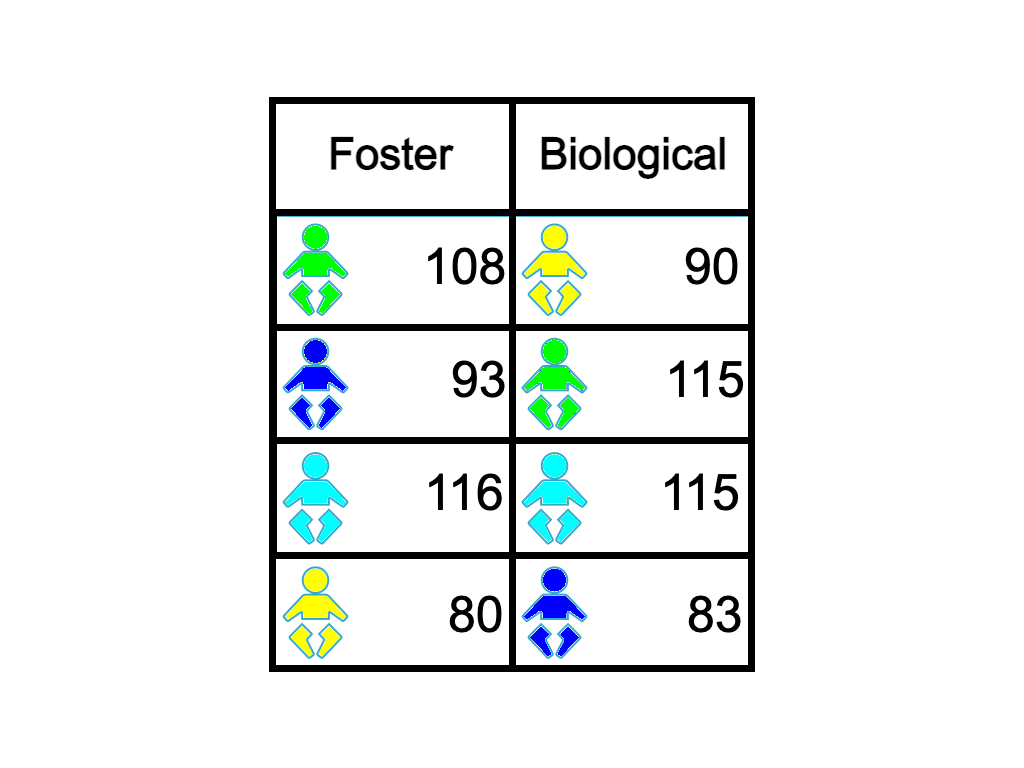
Twin data
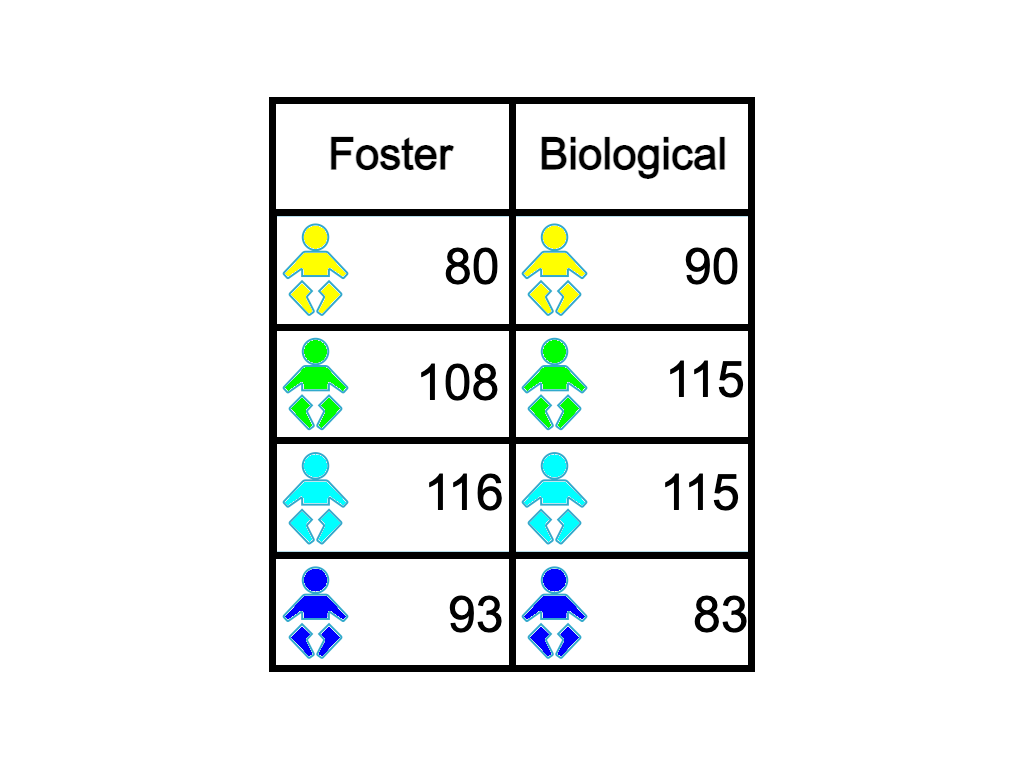
Permuted twin data
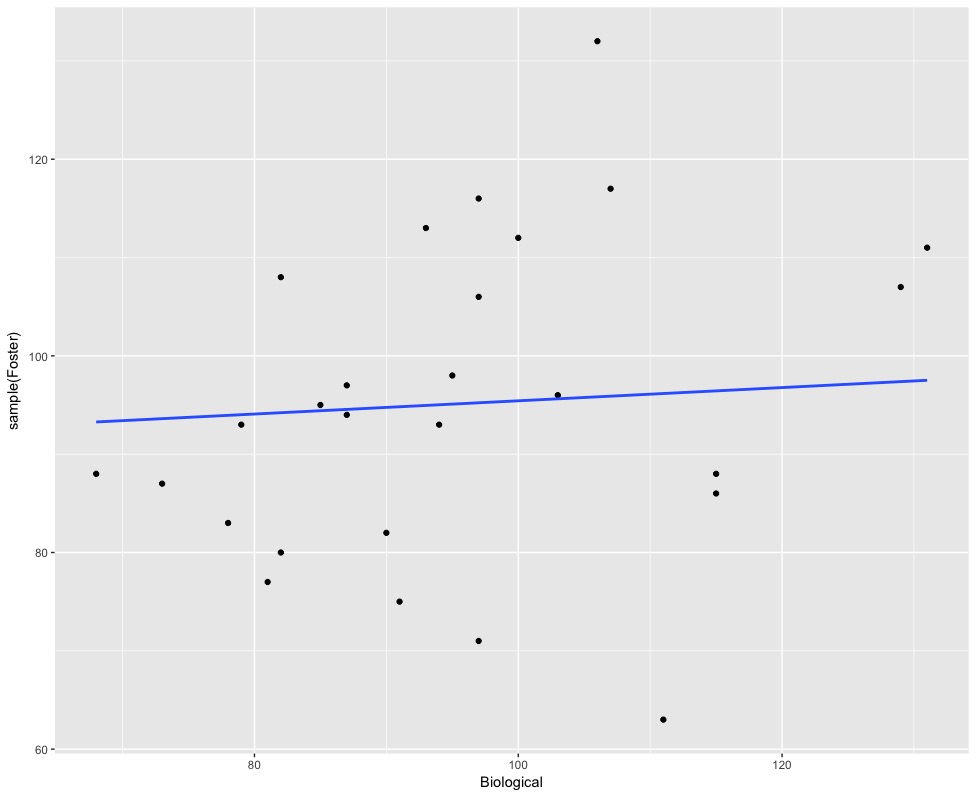
Permuted data (1) plotted
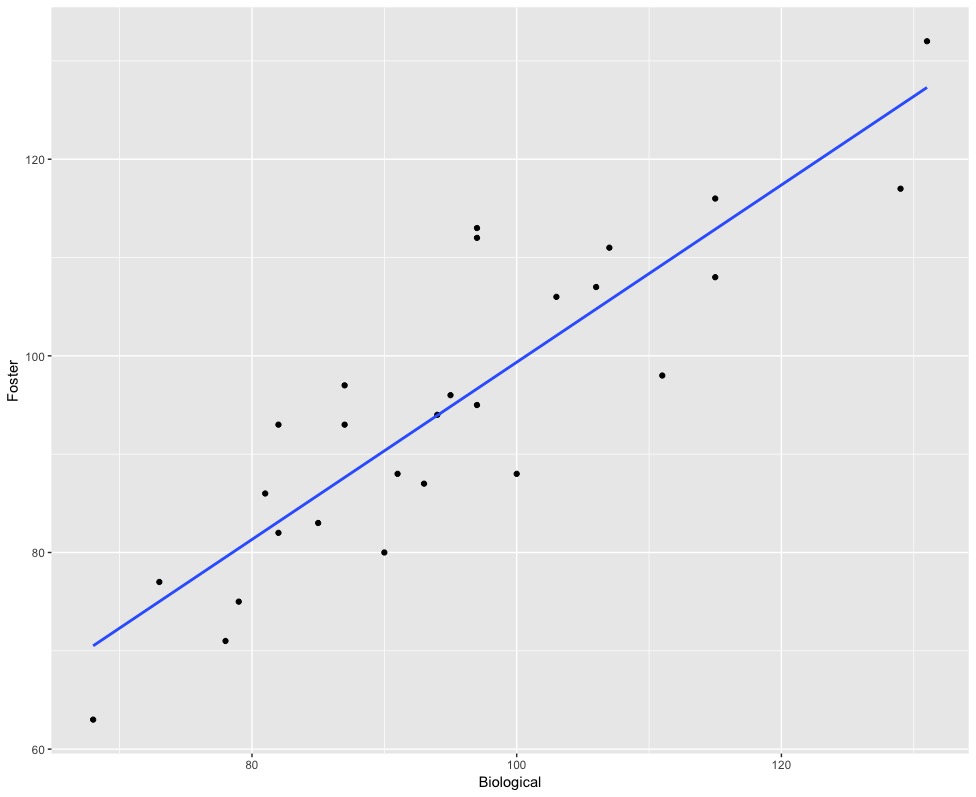
Original data
Permuted data (1)
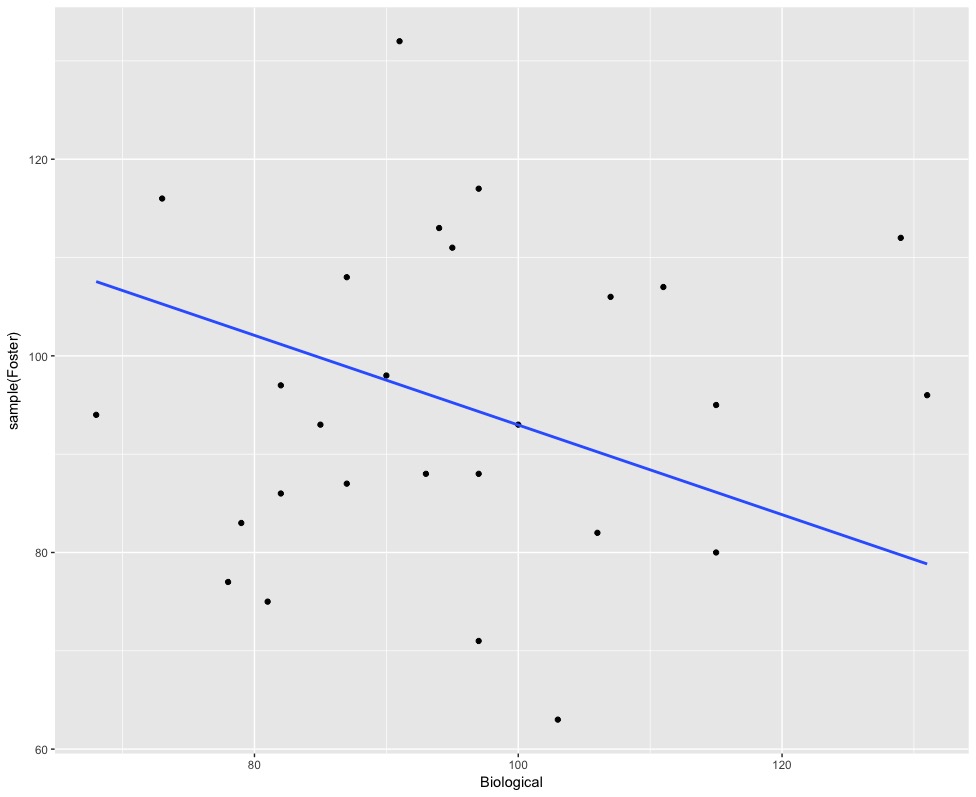
Permuted data (2) plotted
Original data
Permuted data (2)
Permuted data (1) and (2)
Permuted data (1)
Permuted data (2)
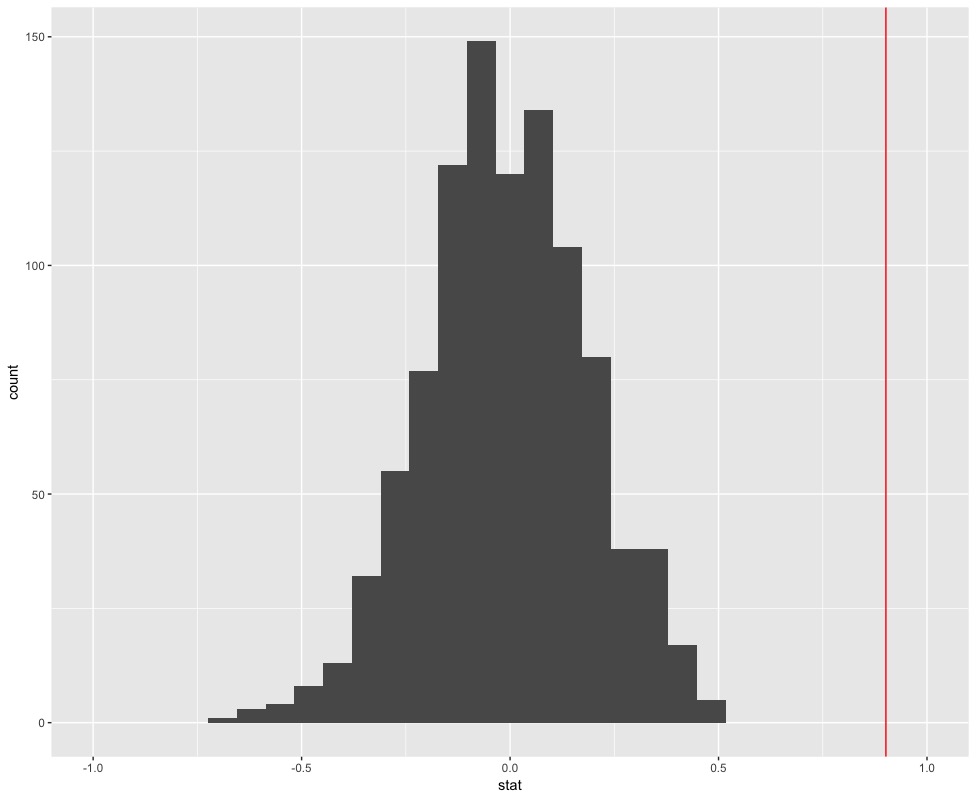
Many permuted slopes
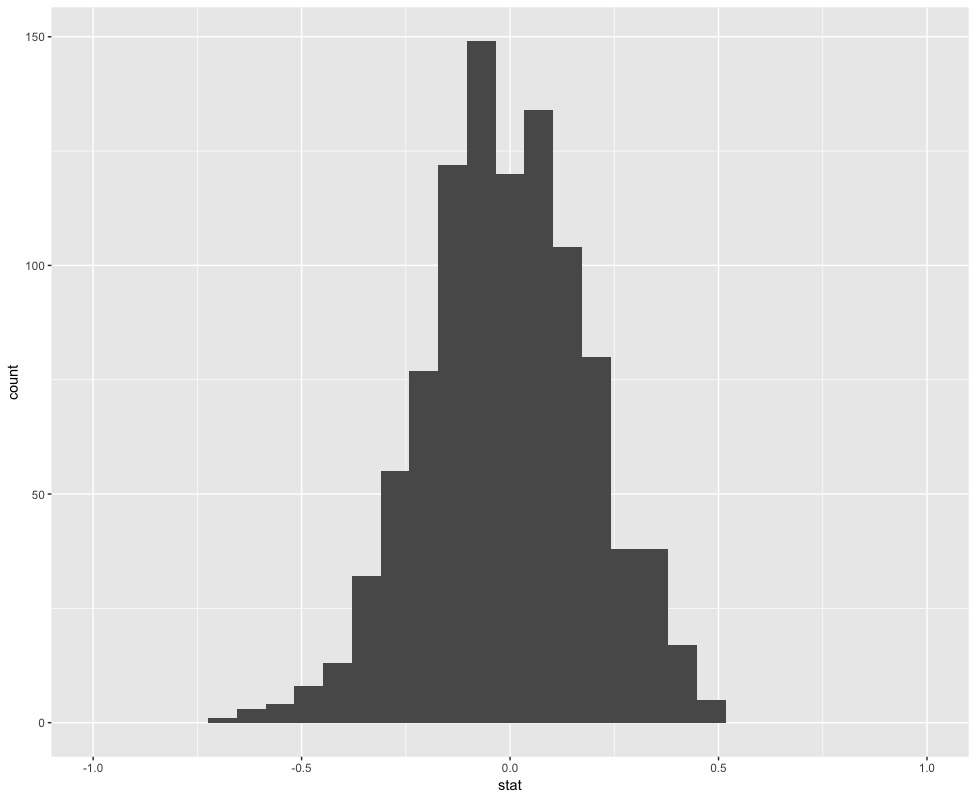
Permuted slopes with observed slope in red