Understanding the visualizations
Power BI for End Users

Deepesh Vashistha
BI Specialist
A gallery of common visualizations
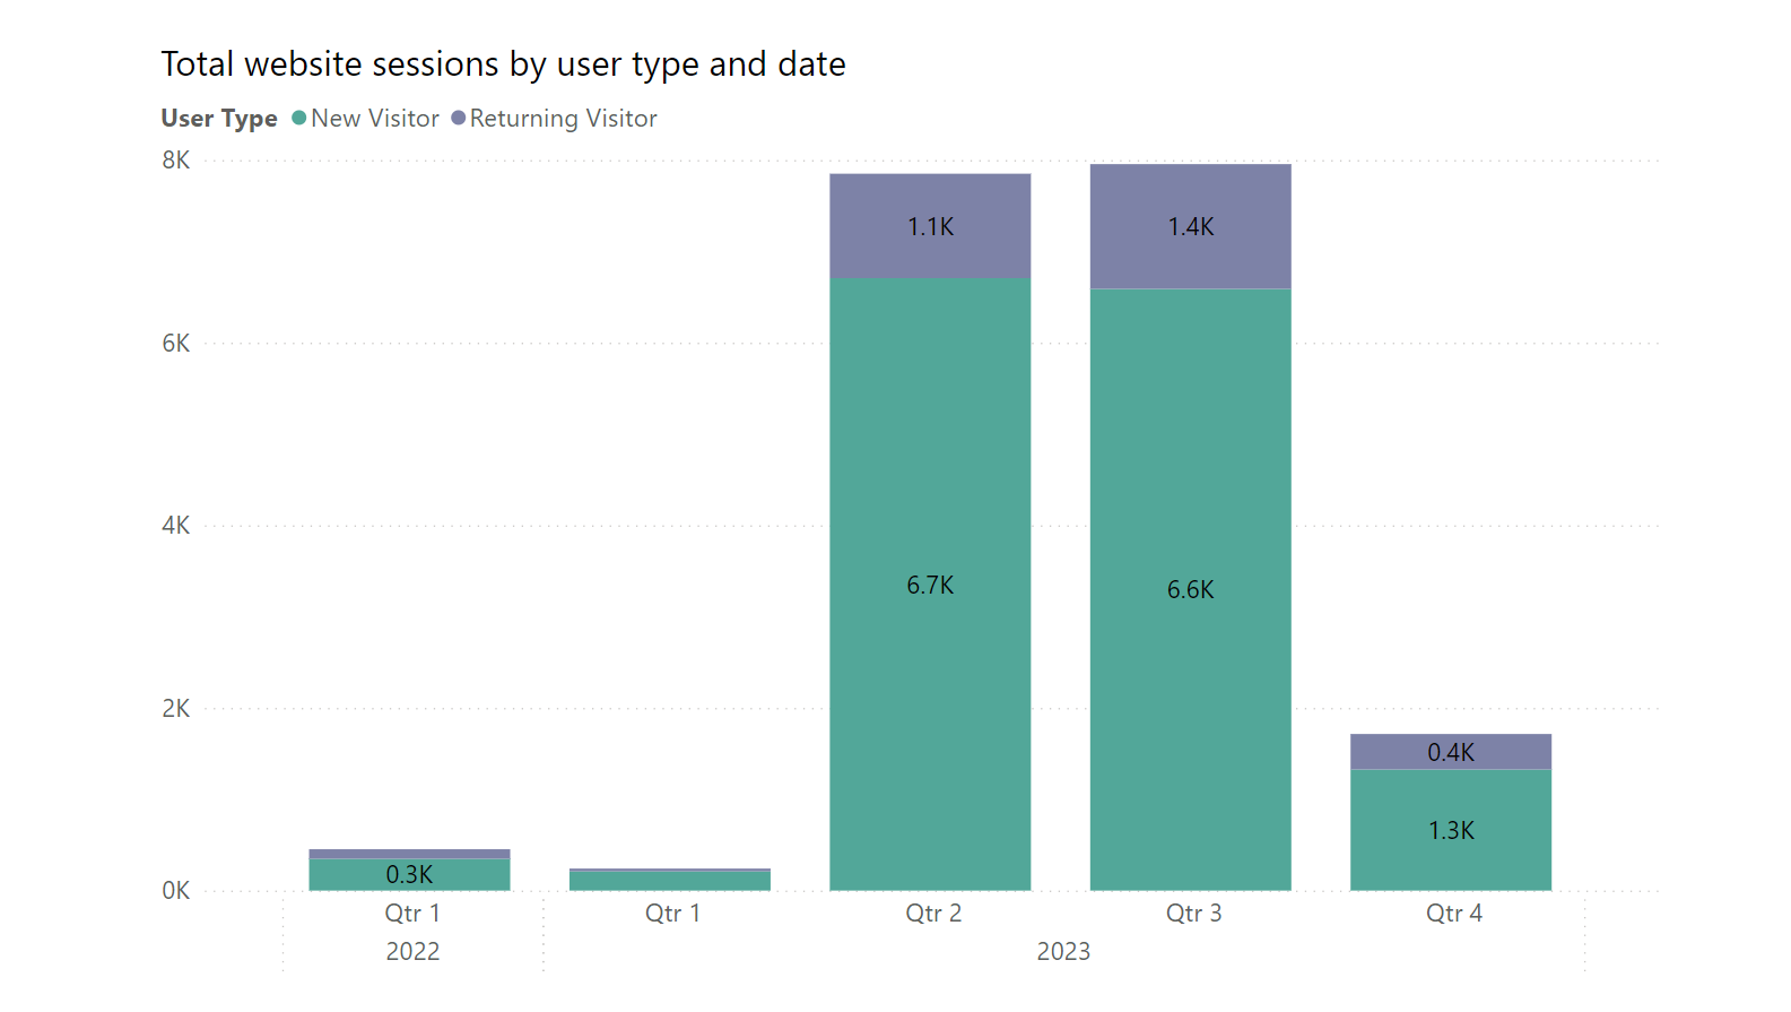
- Bar chart: E.g., sales figures by product category
A gallery of common visualizations
- Bar chart: E.g., sales figures by product category
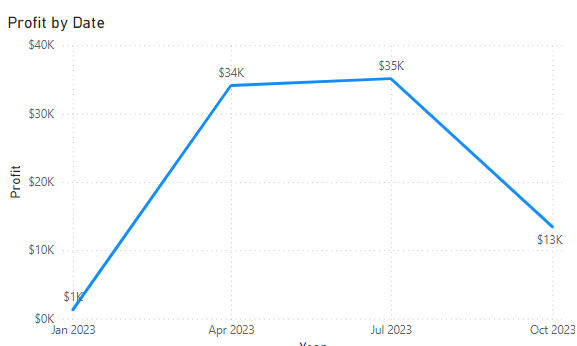
- Line graph: E.g., website traffic over months
A gallery of common visualizations
- Bar chart: E.g., sales figures by product category
- Line graph: E.g., website traffic over months
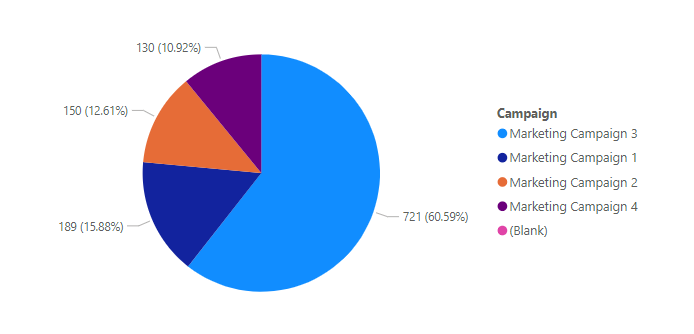
- Pie chart: E.g., market share of different brands
A gallery of common visualizations
- Bar chart: E.g., sales figures by product category
- Line graph: E.g., website traffic over months
- Pie chart: E.g., market share of different brands
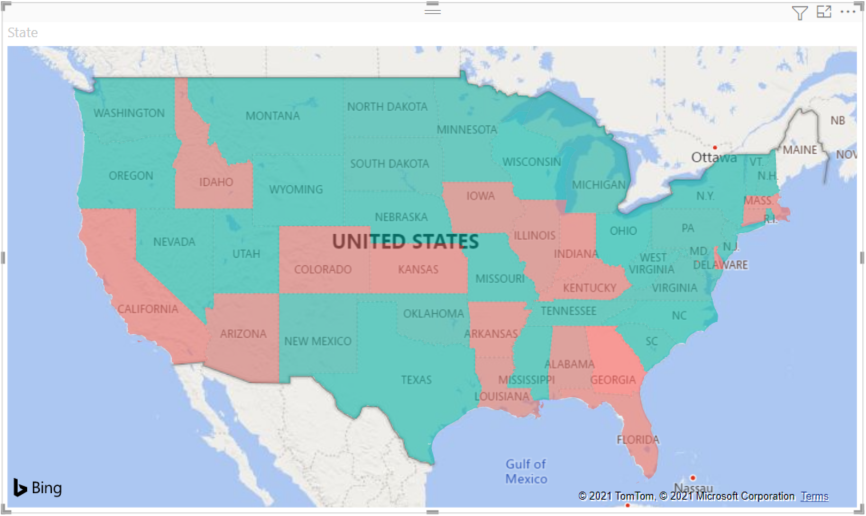
- Map chart: E.g., sales performance across regions)
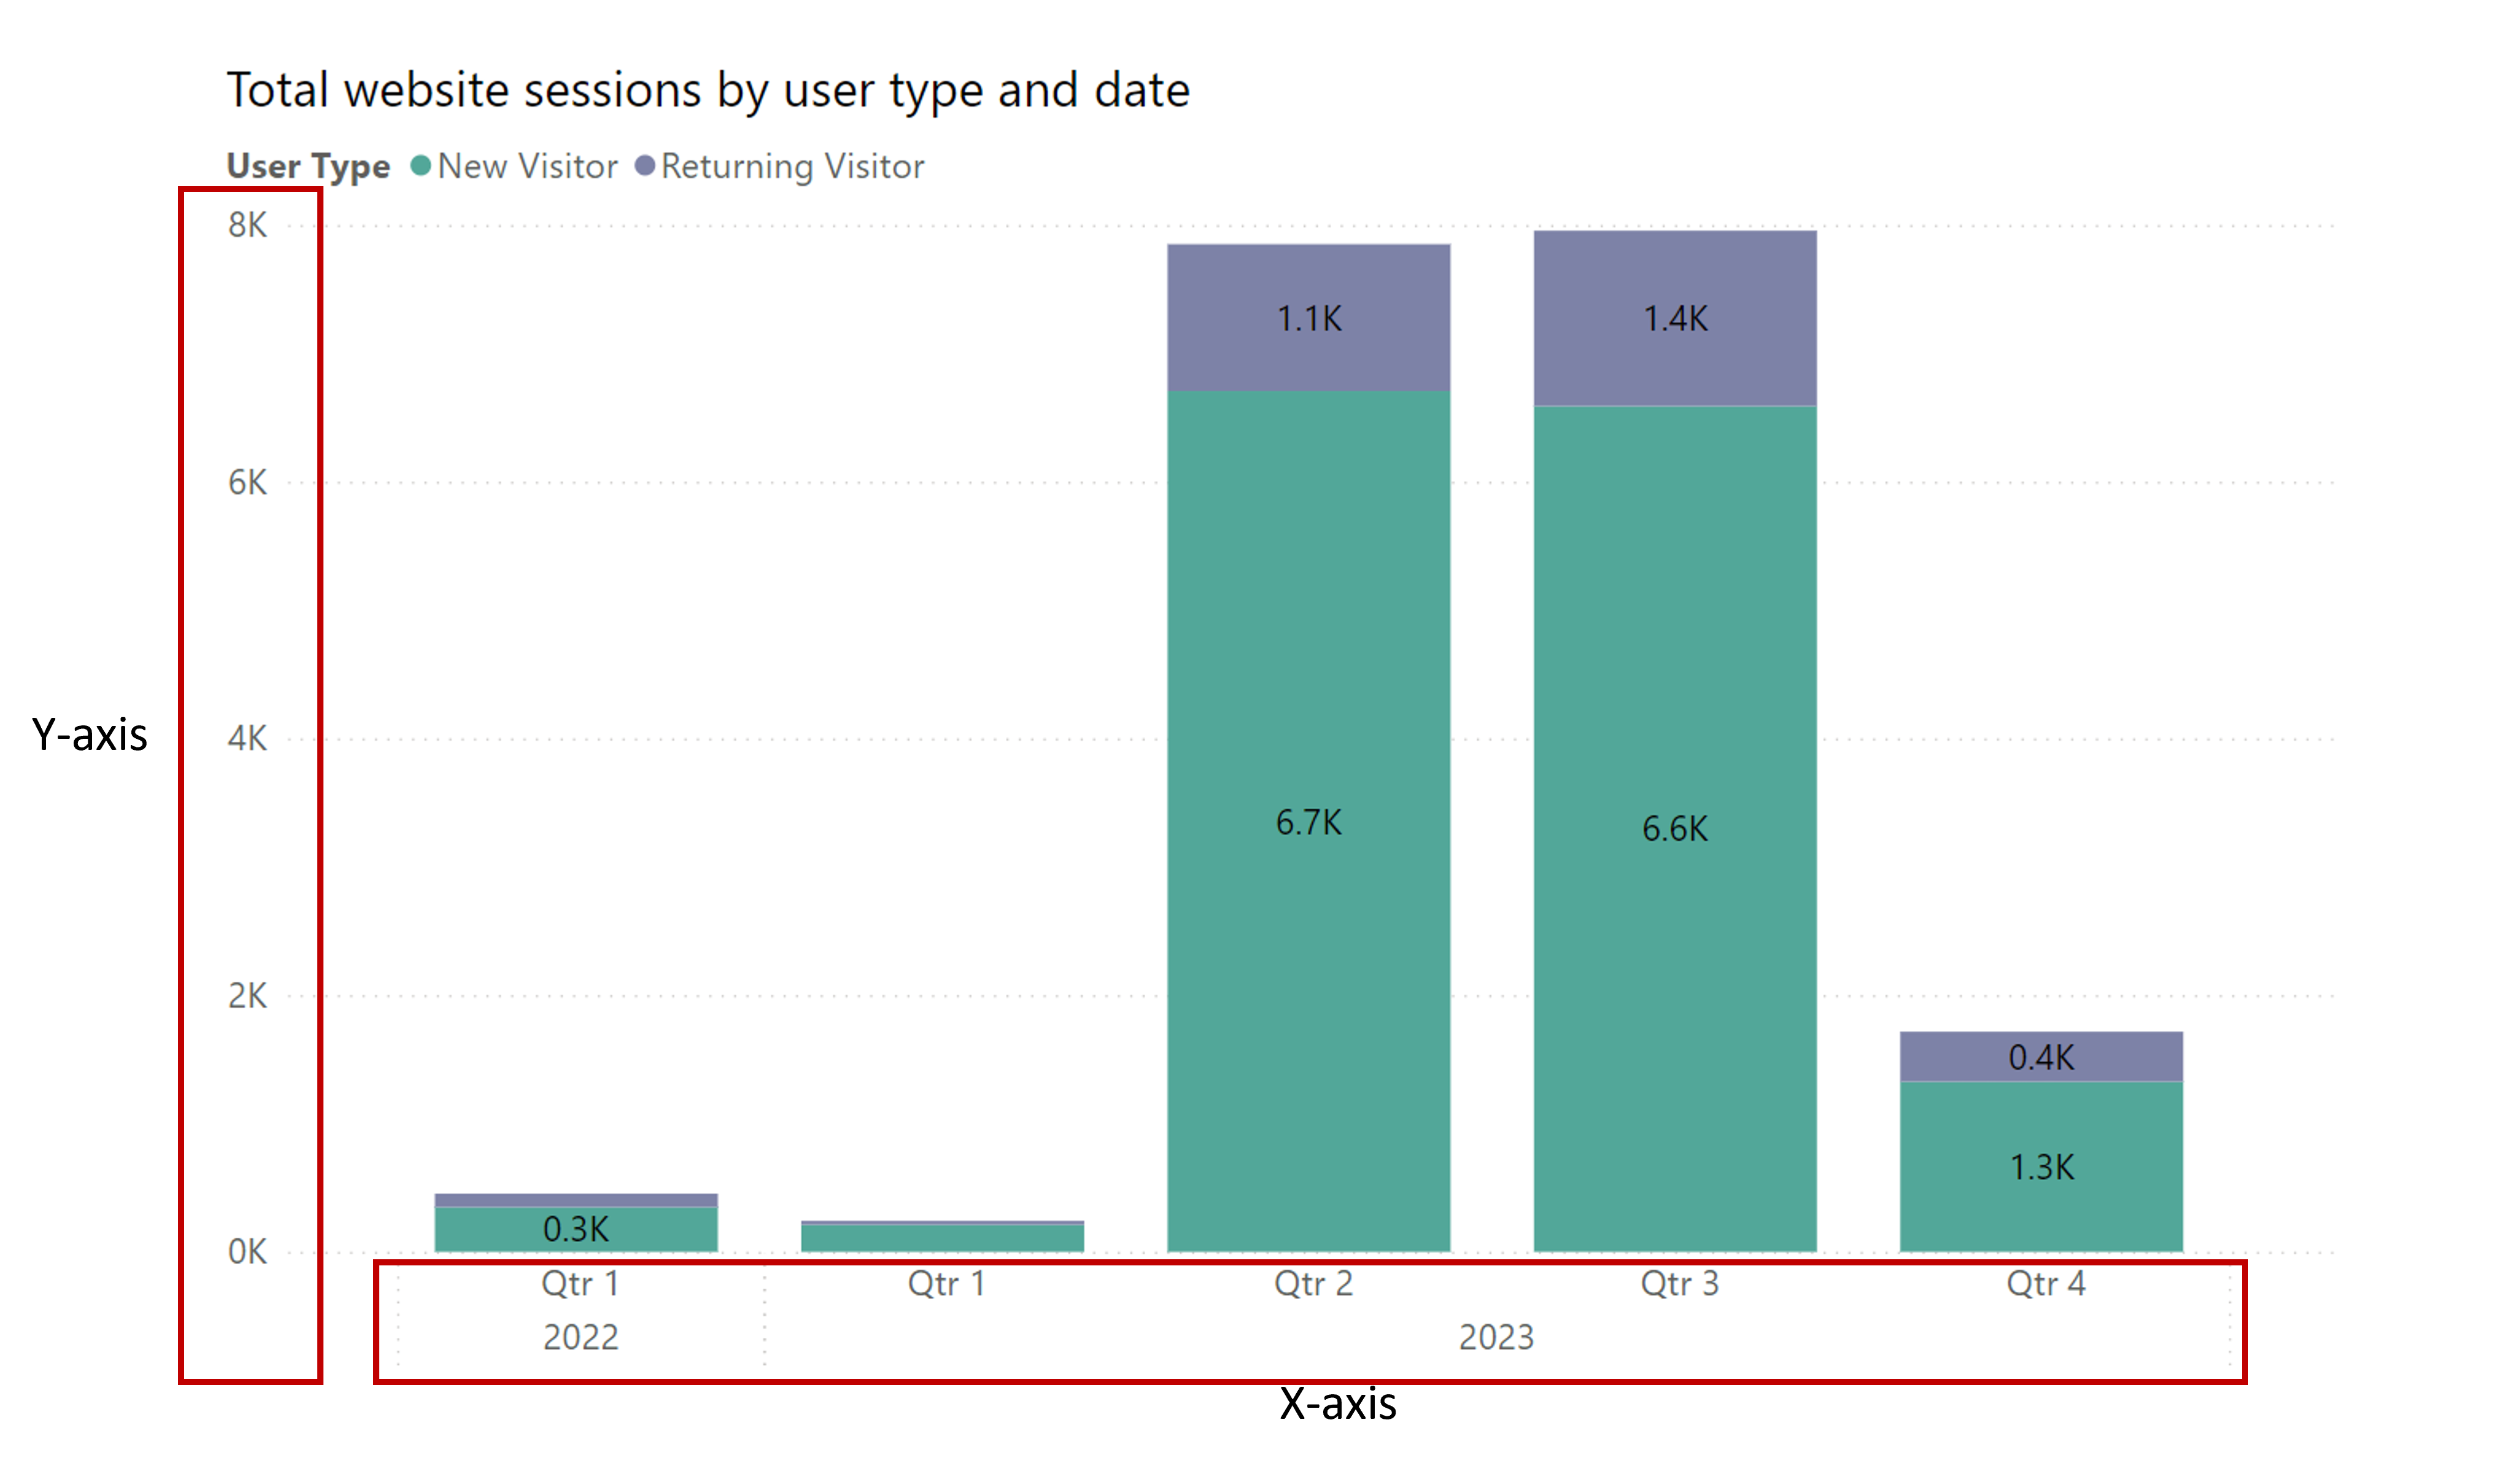
Building blocks of visualizations
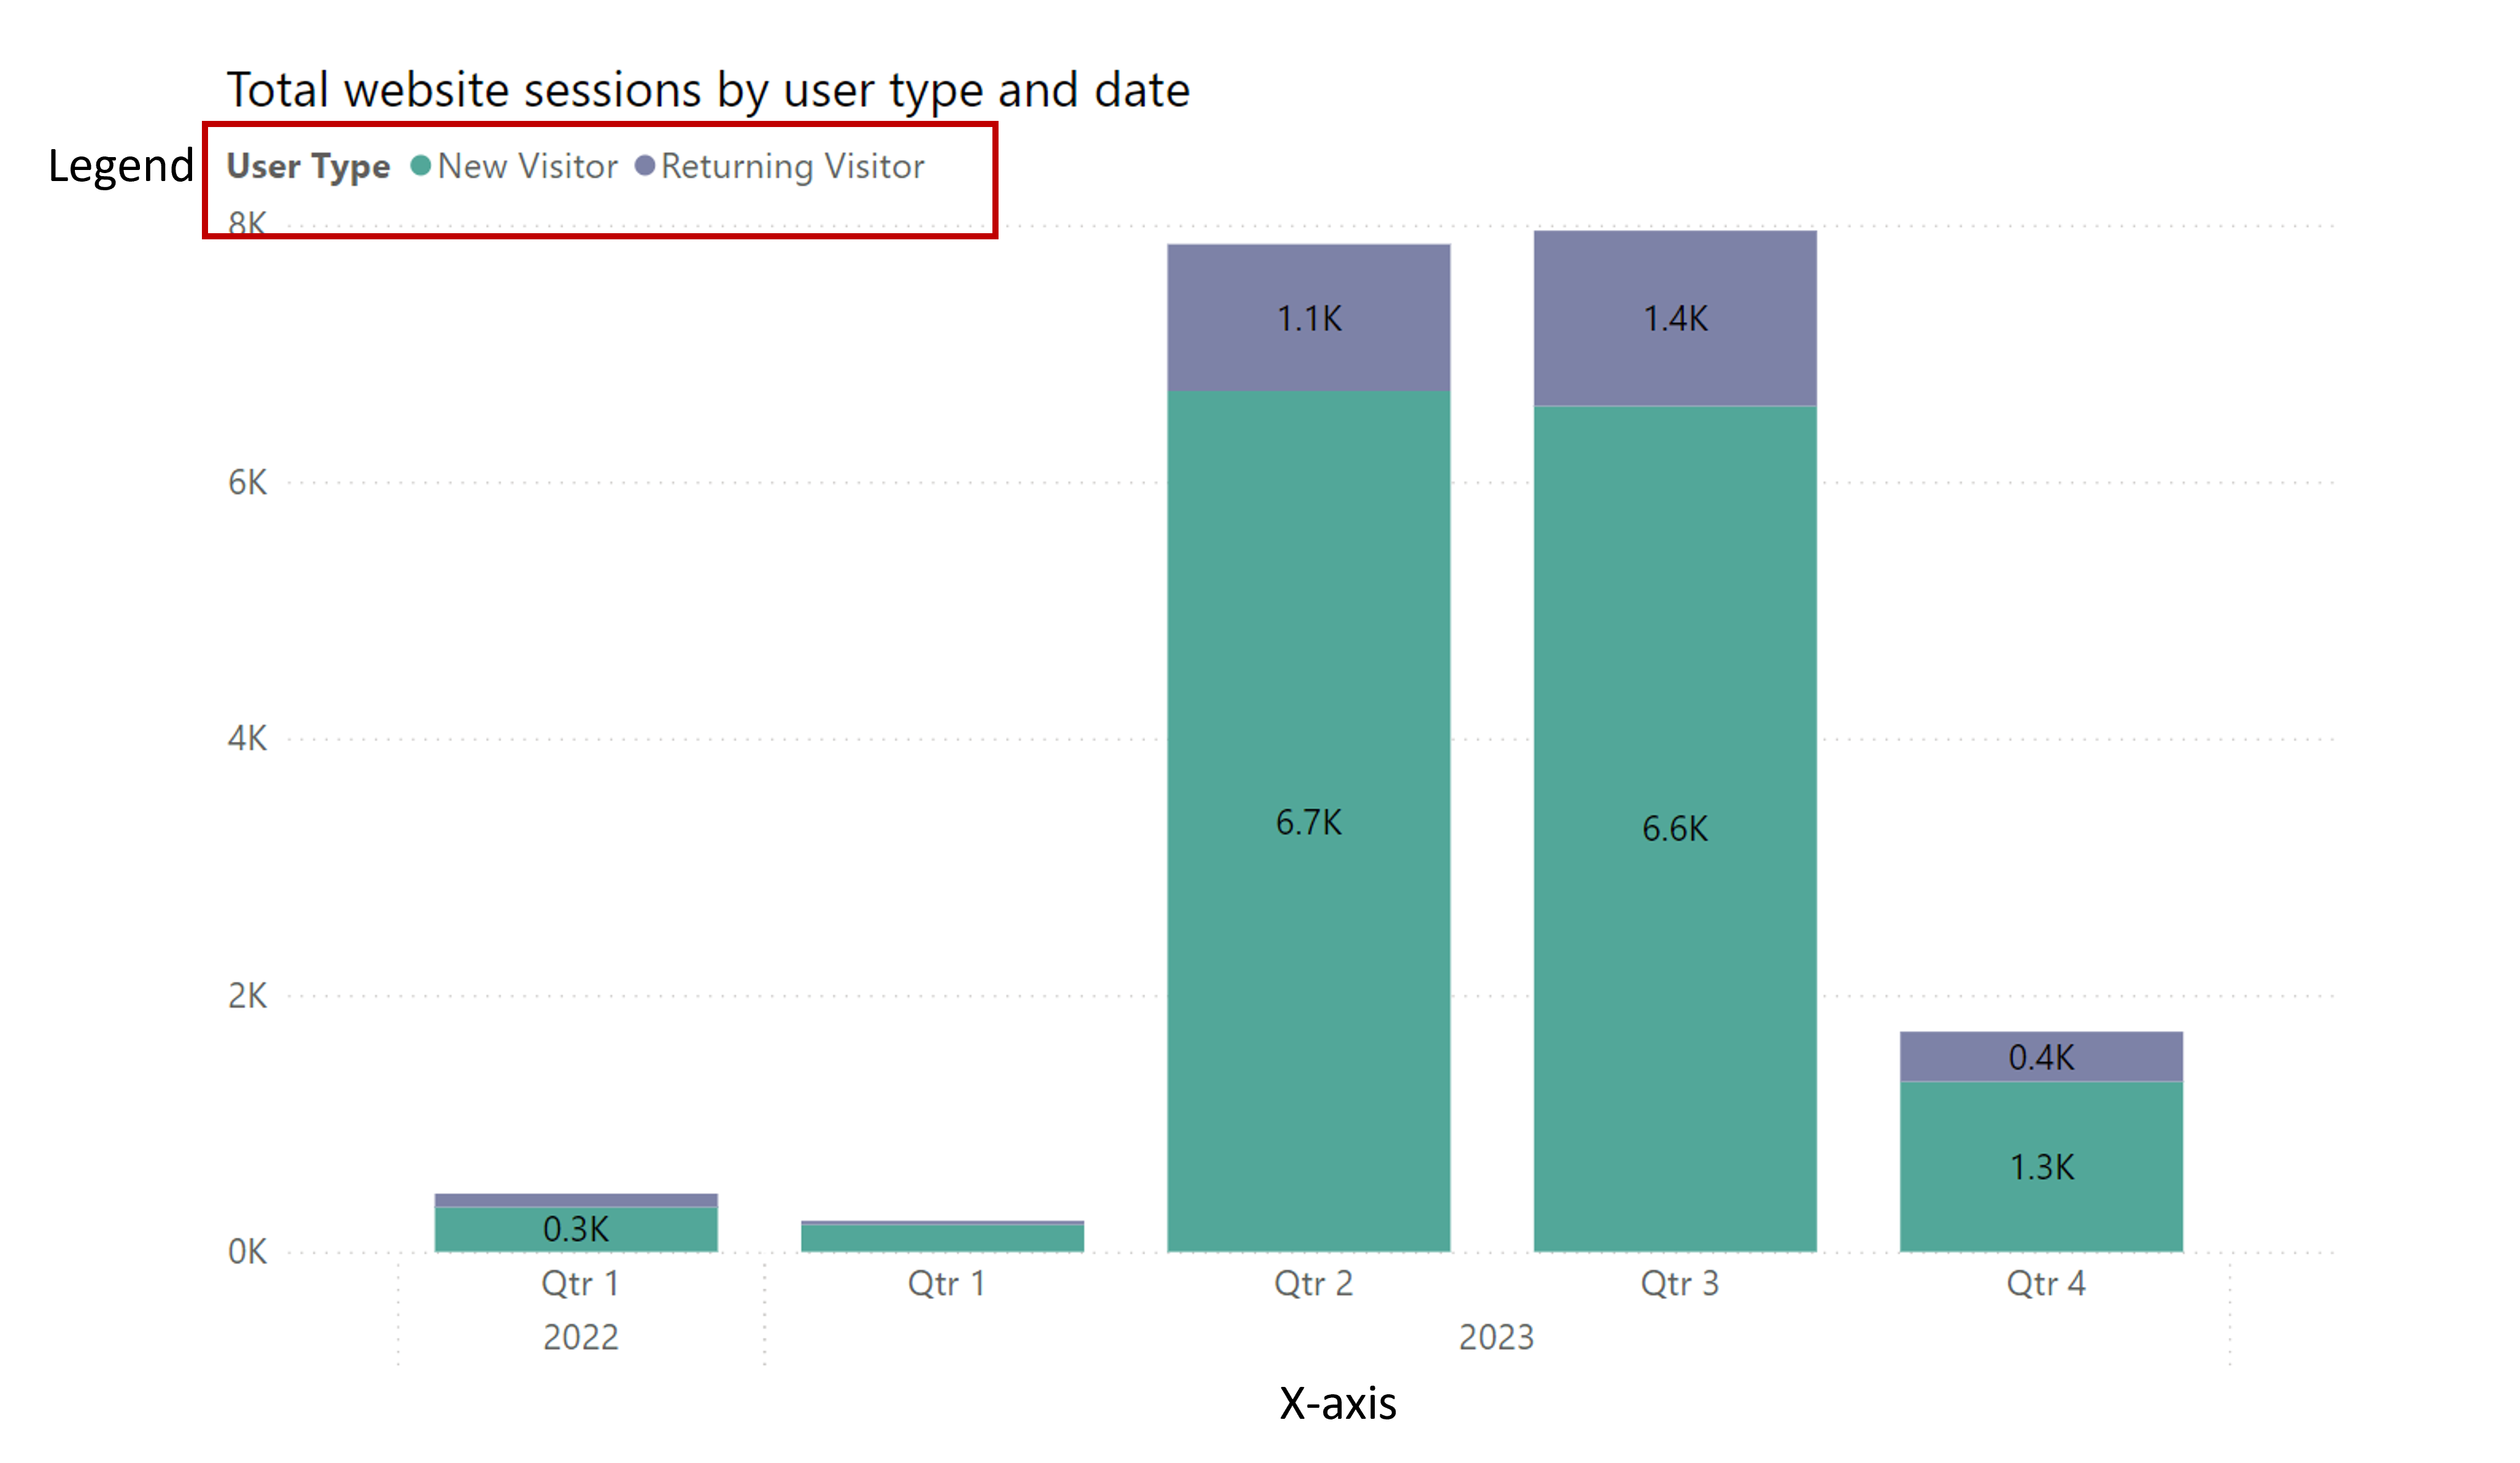
Building blocks of visualizations
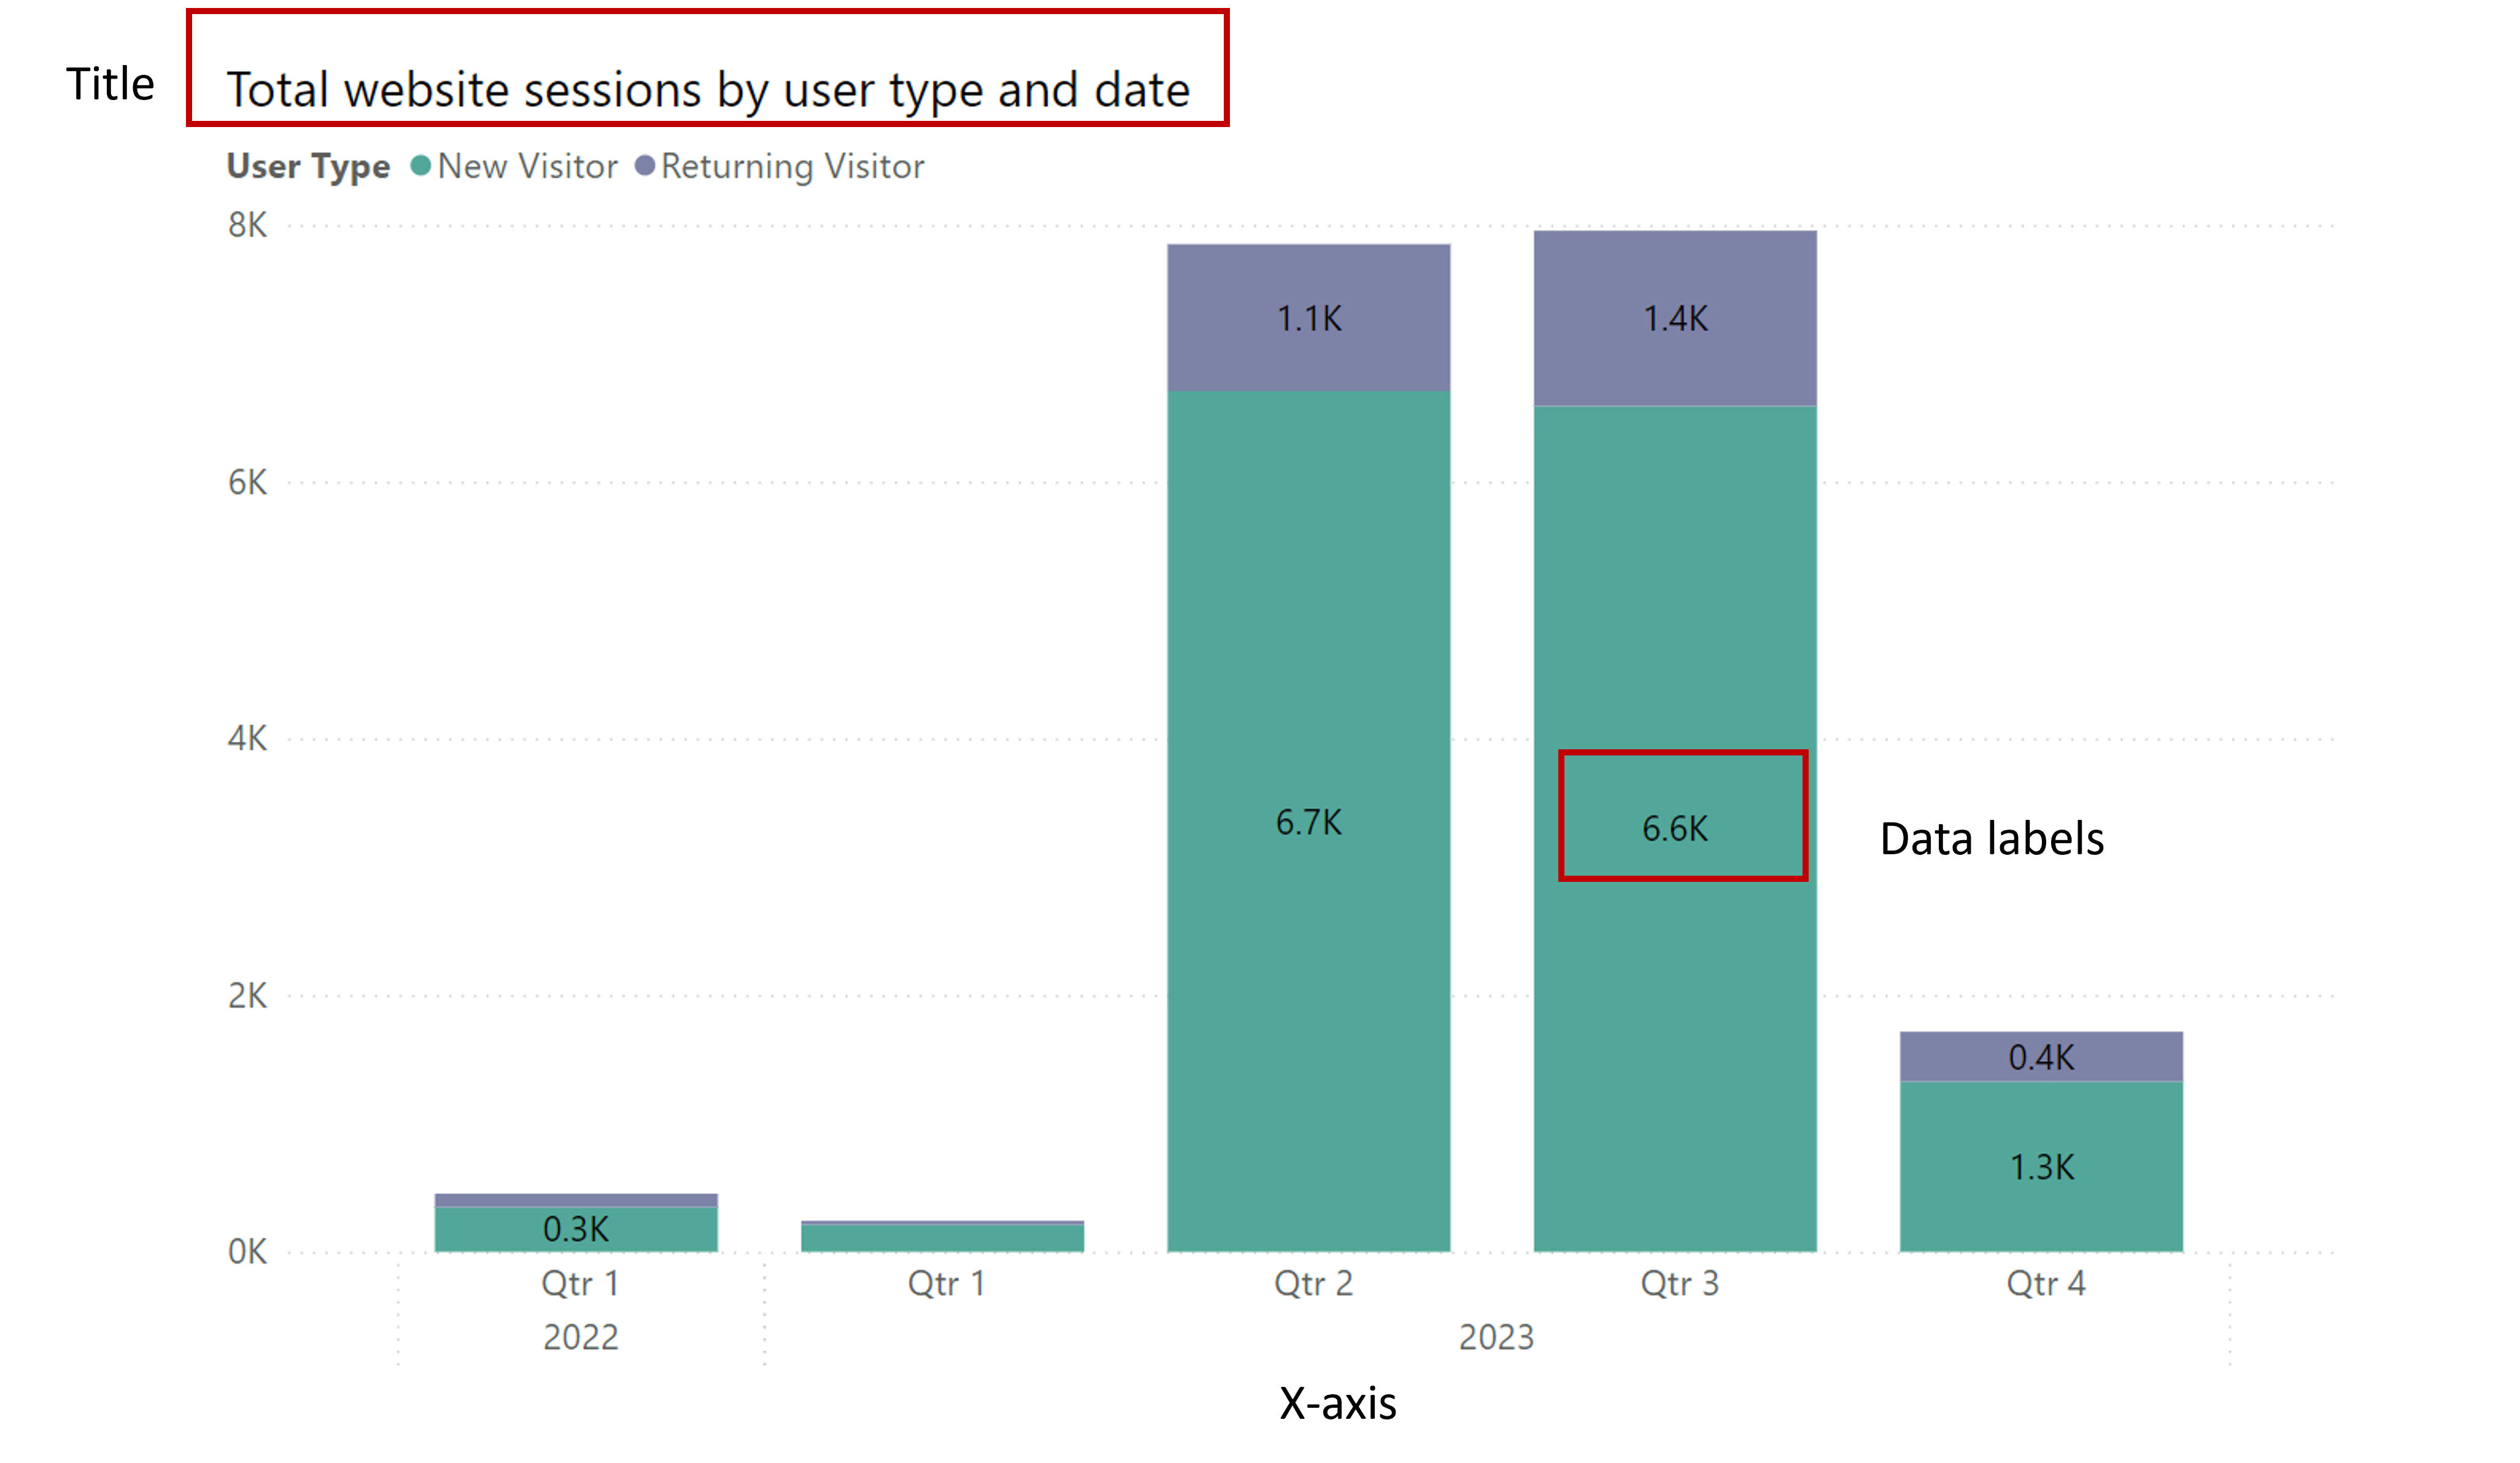
Building blocks of visualizations
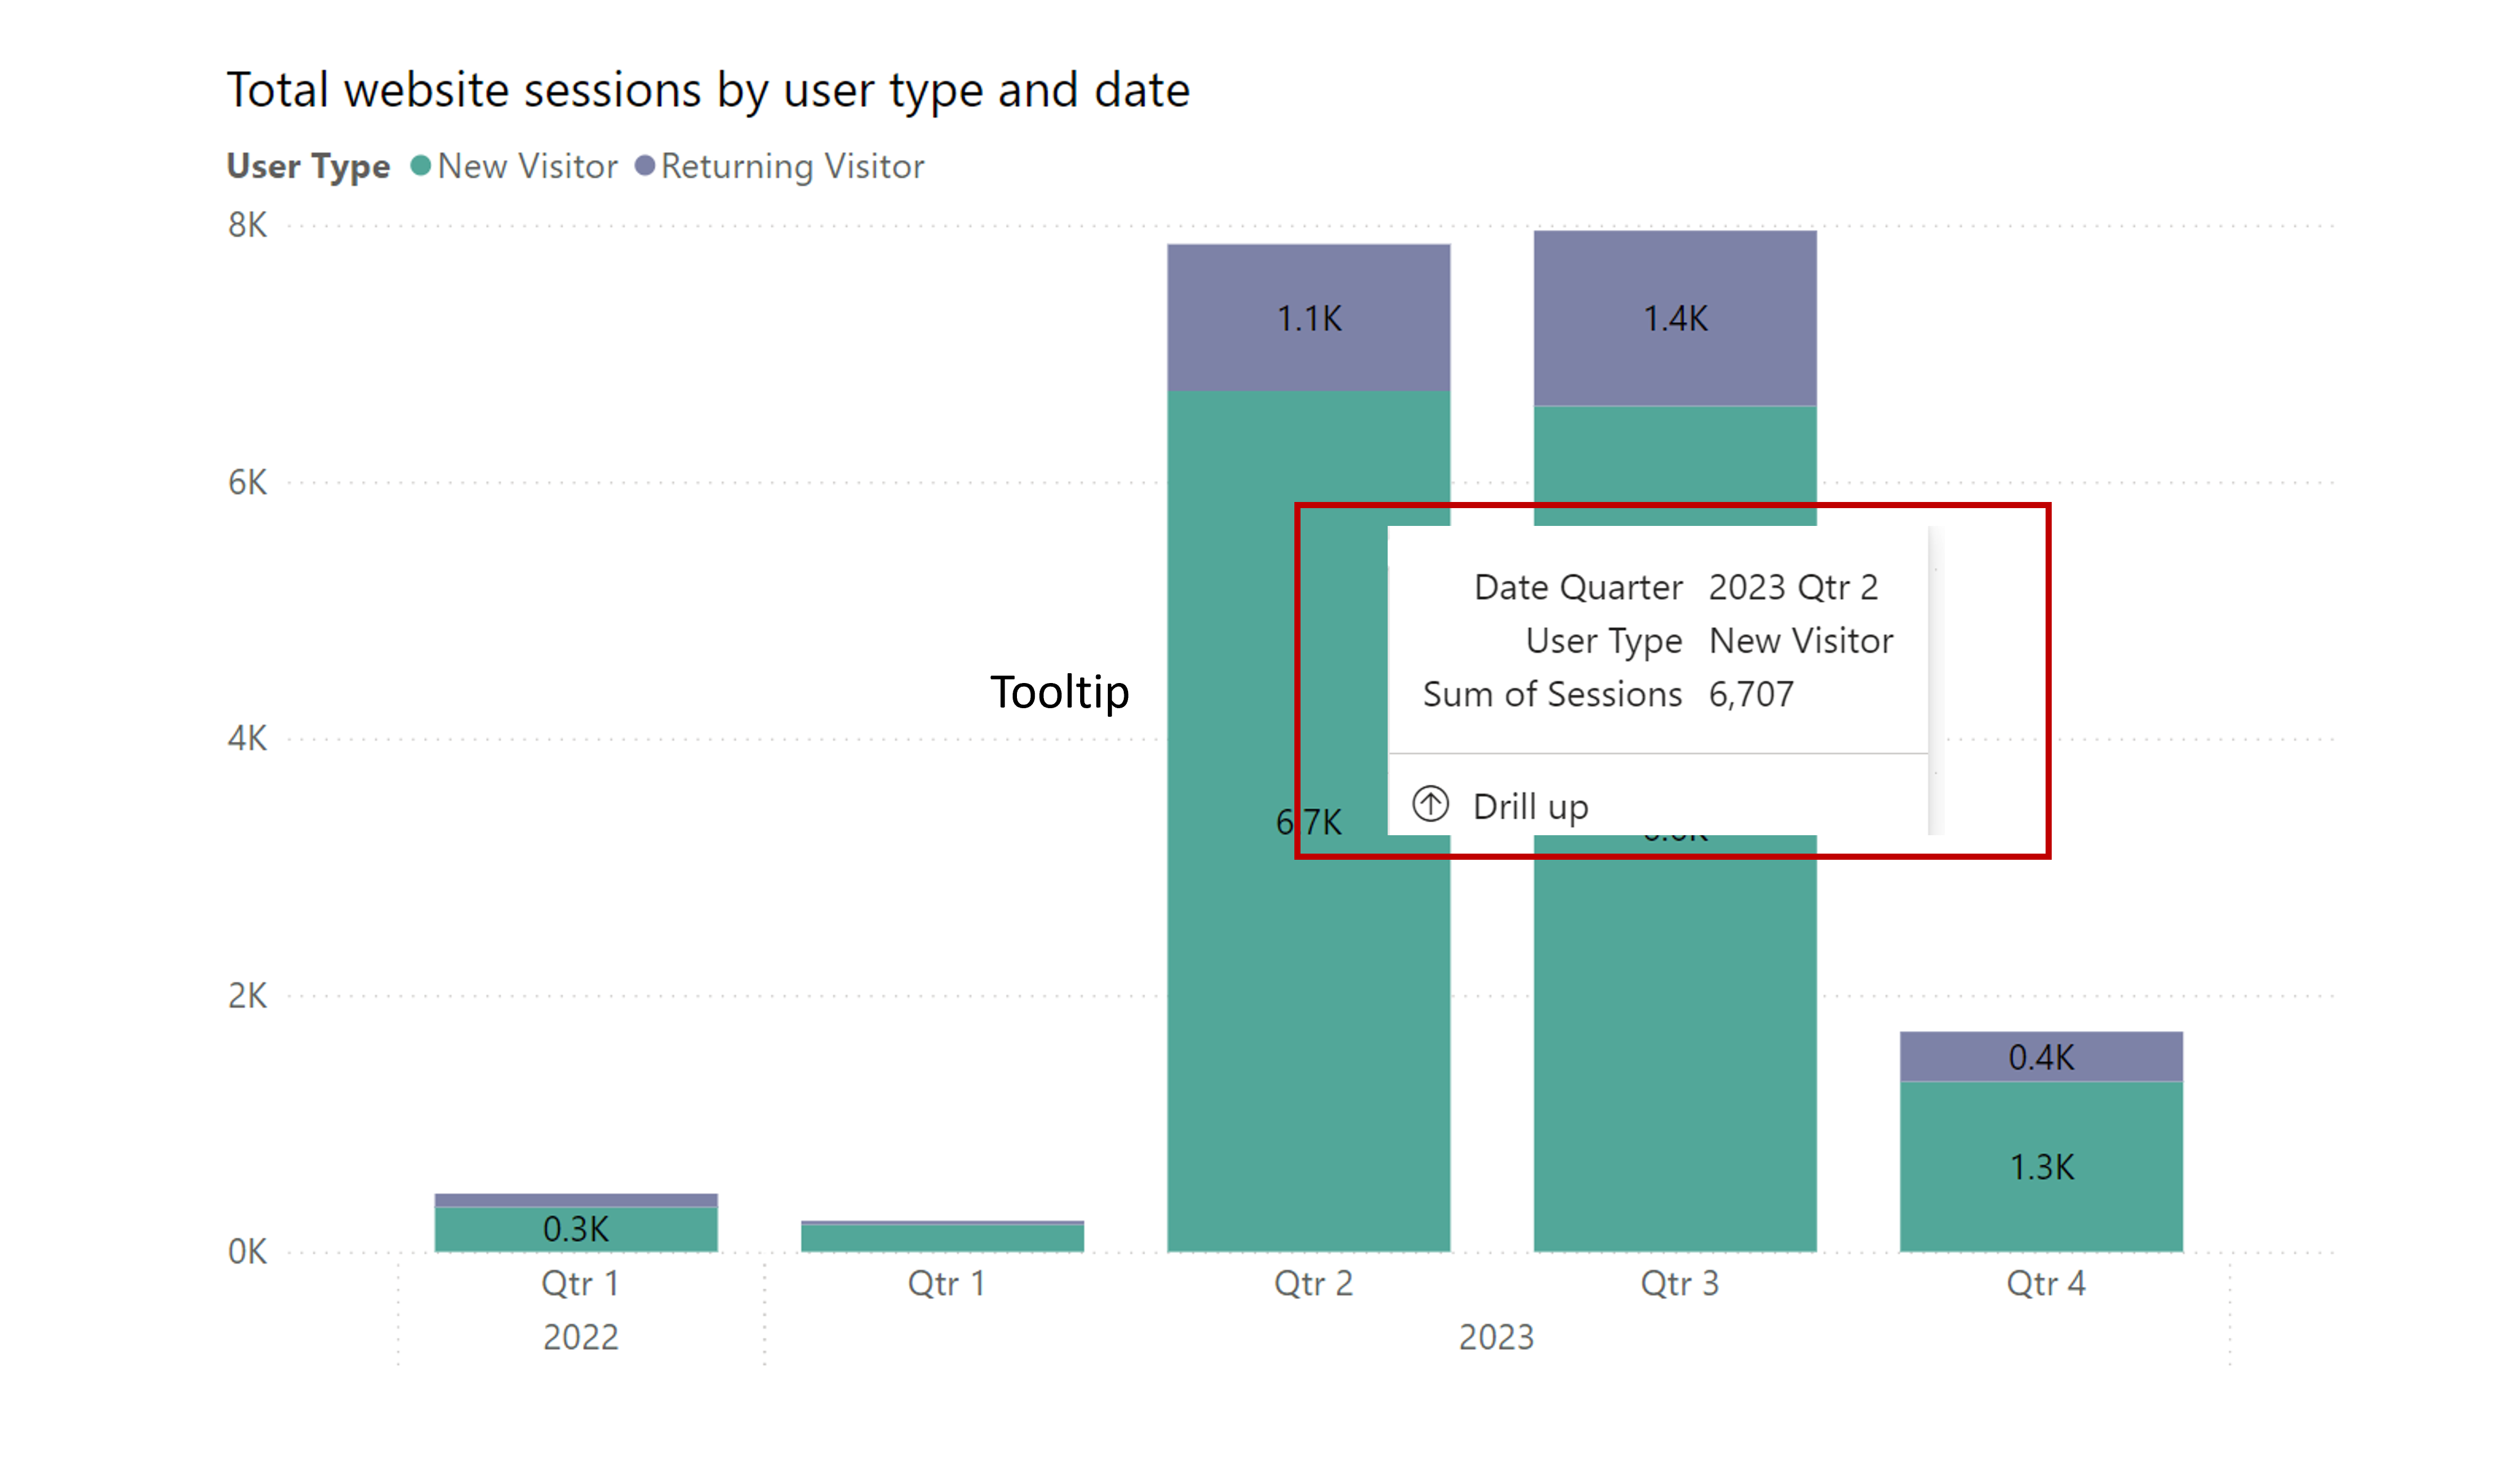
Building blocks of visualizations
Building blocks of visualizations
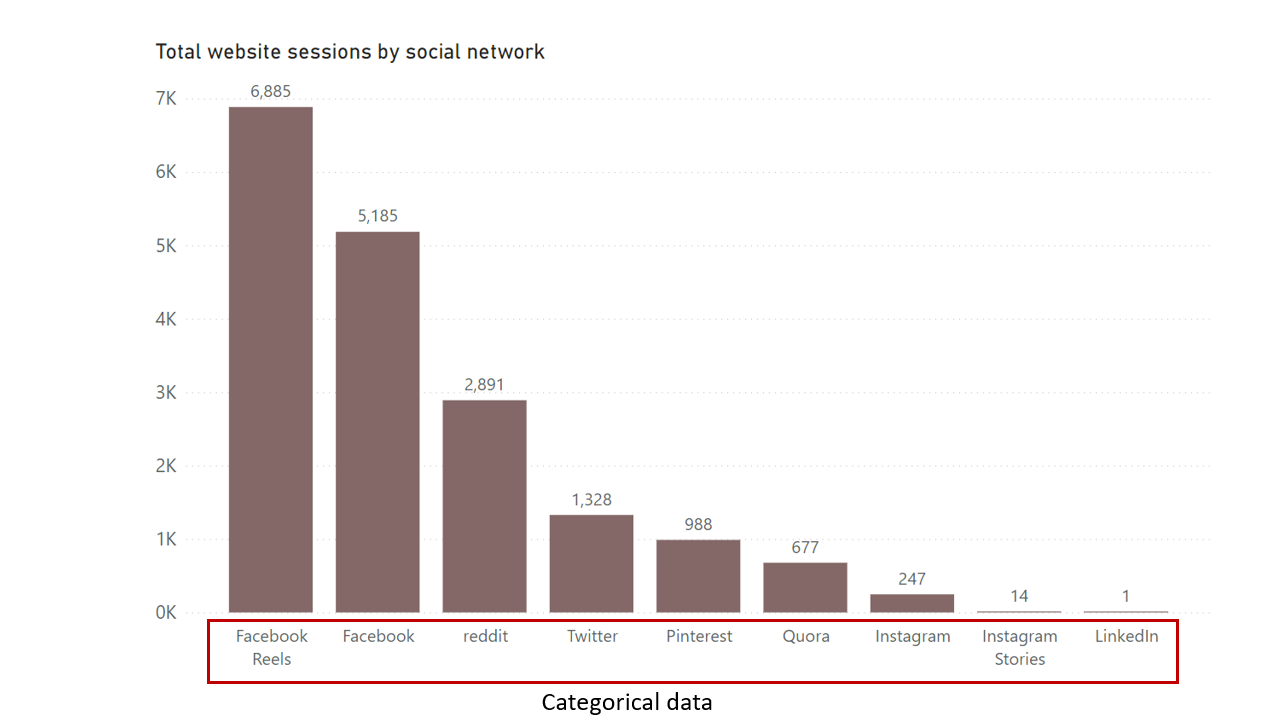
Categorical vs numerical data representation
Categorical vs numerical data representation
- Categorical data -
- Qualities or categories
- Represent categories or classifications, like customer segments (Gold, Silver, Bronze)
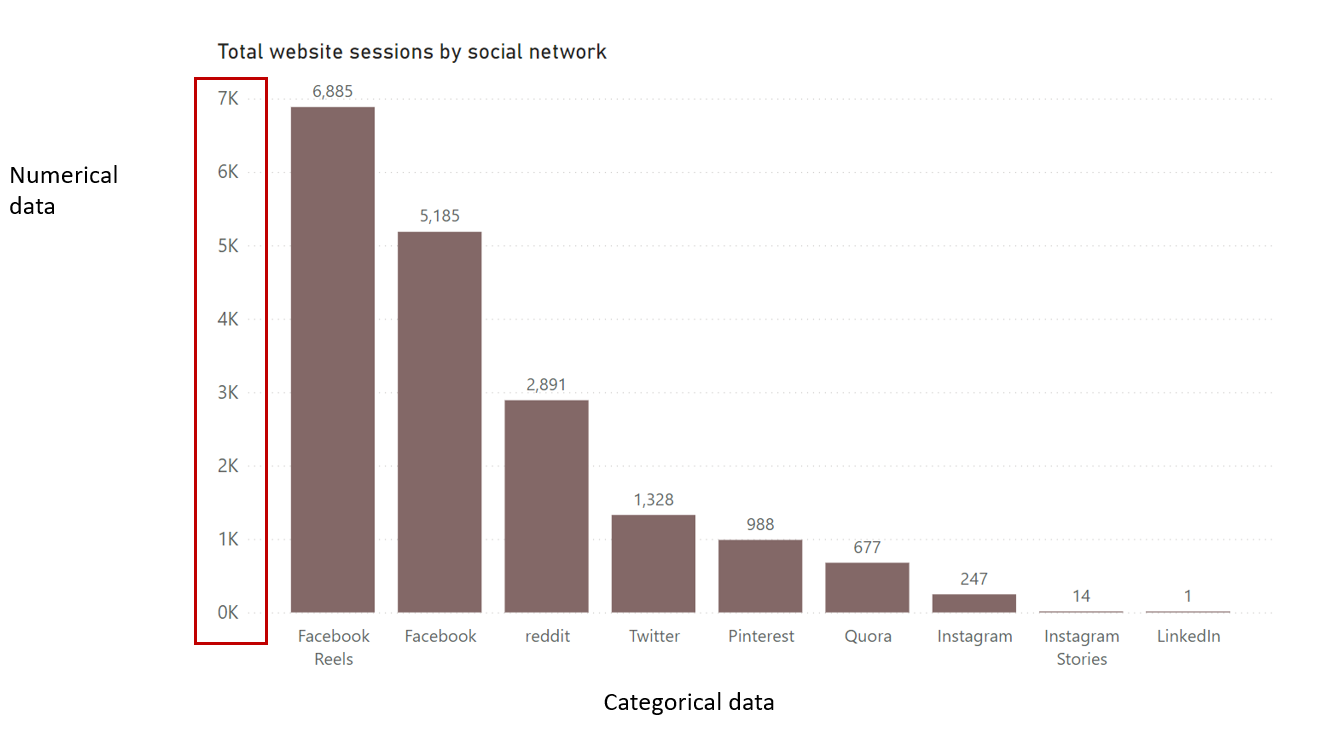
Categorical vs numerical data representation
- Categorical data -
- Qualities or categories
- Represent categories or classifications, like customer segments (Gold, Silver, Bronze)
- Numerical -
- Quantities or measurements
- Represents quantities or measurements, like sales figures, customer age, or product price
Let's practice!
Power BI for End Users
 Preparing Video For Download...