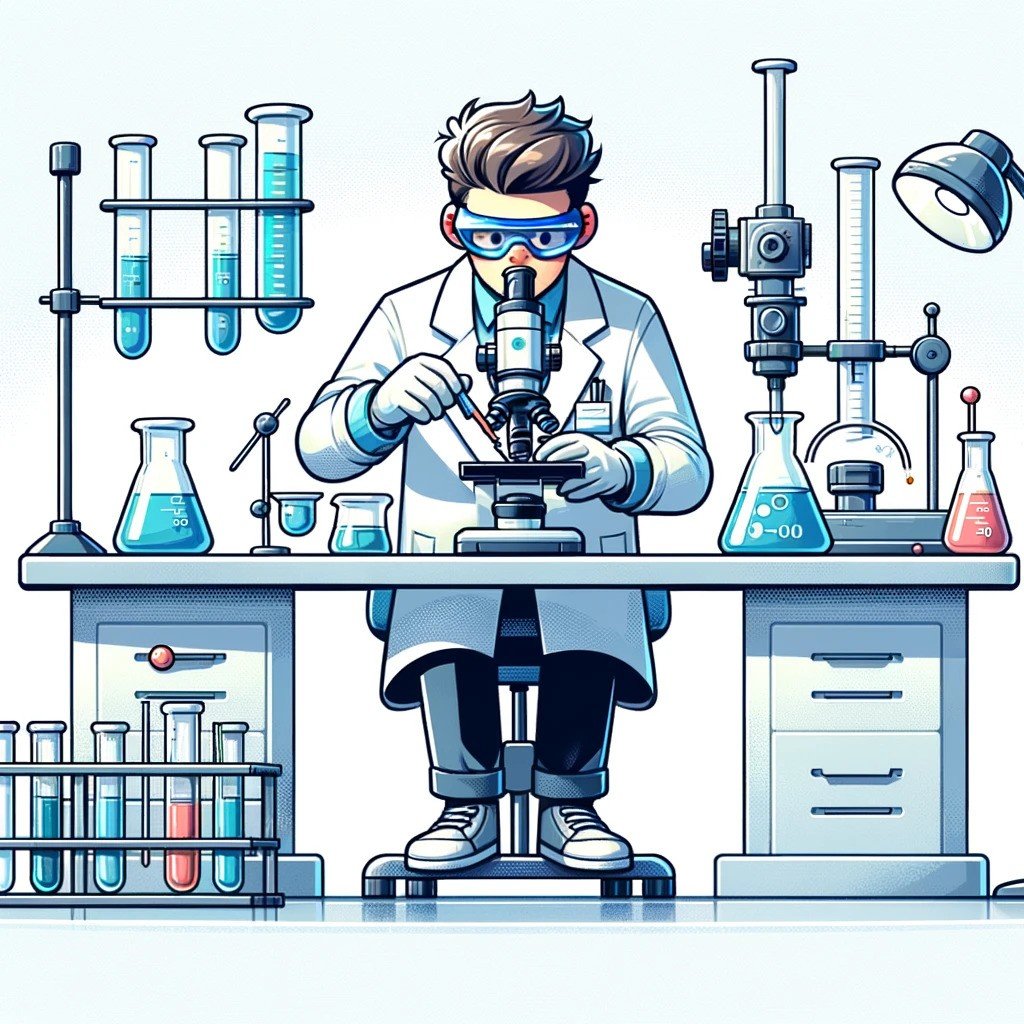
Setting up experiments
Experimental Design in Python

James Chapman
Curriculum Manager, DataCamp
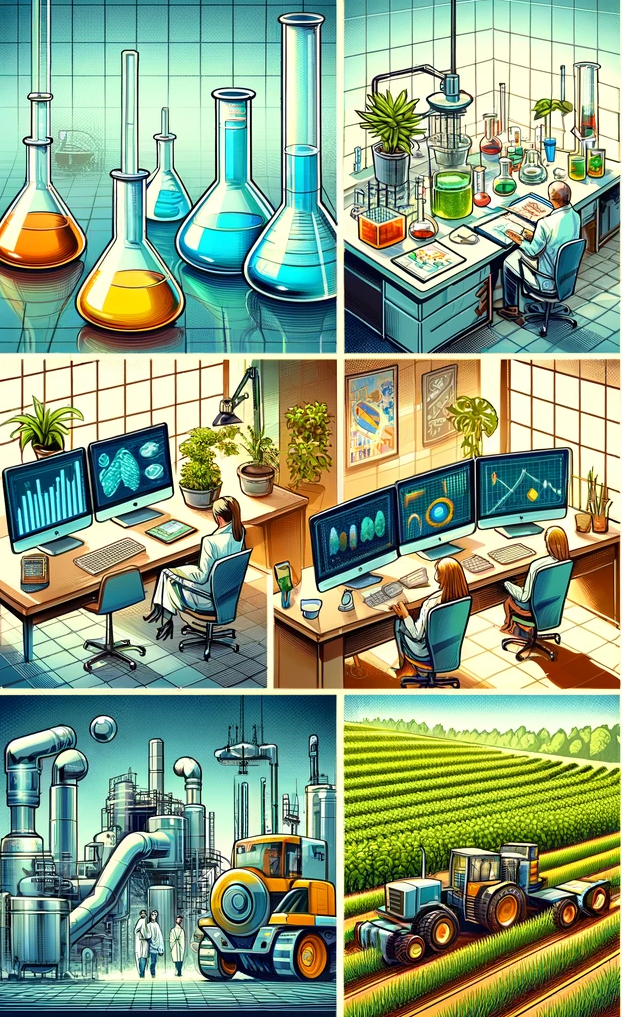
Experimental Design definition
1 https://www.sciencedirect.com/topics/earth-and-planetary-sciences/experimental-design
Why experimental design?
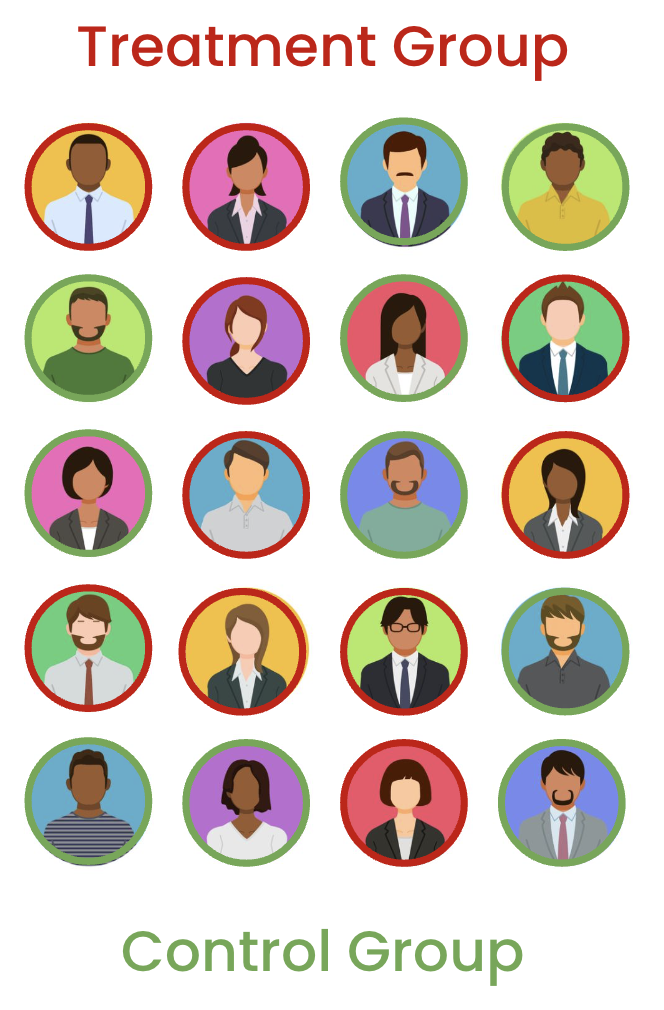
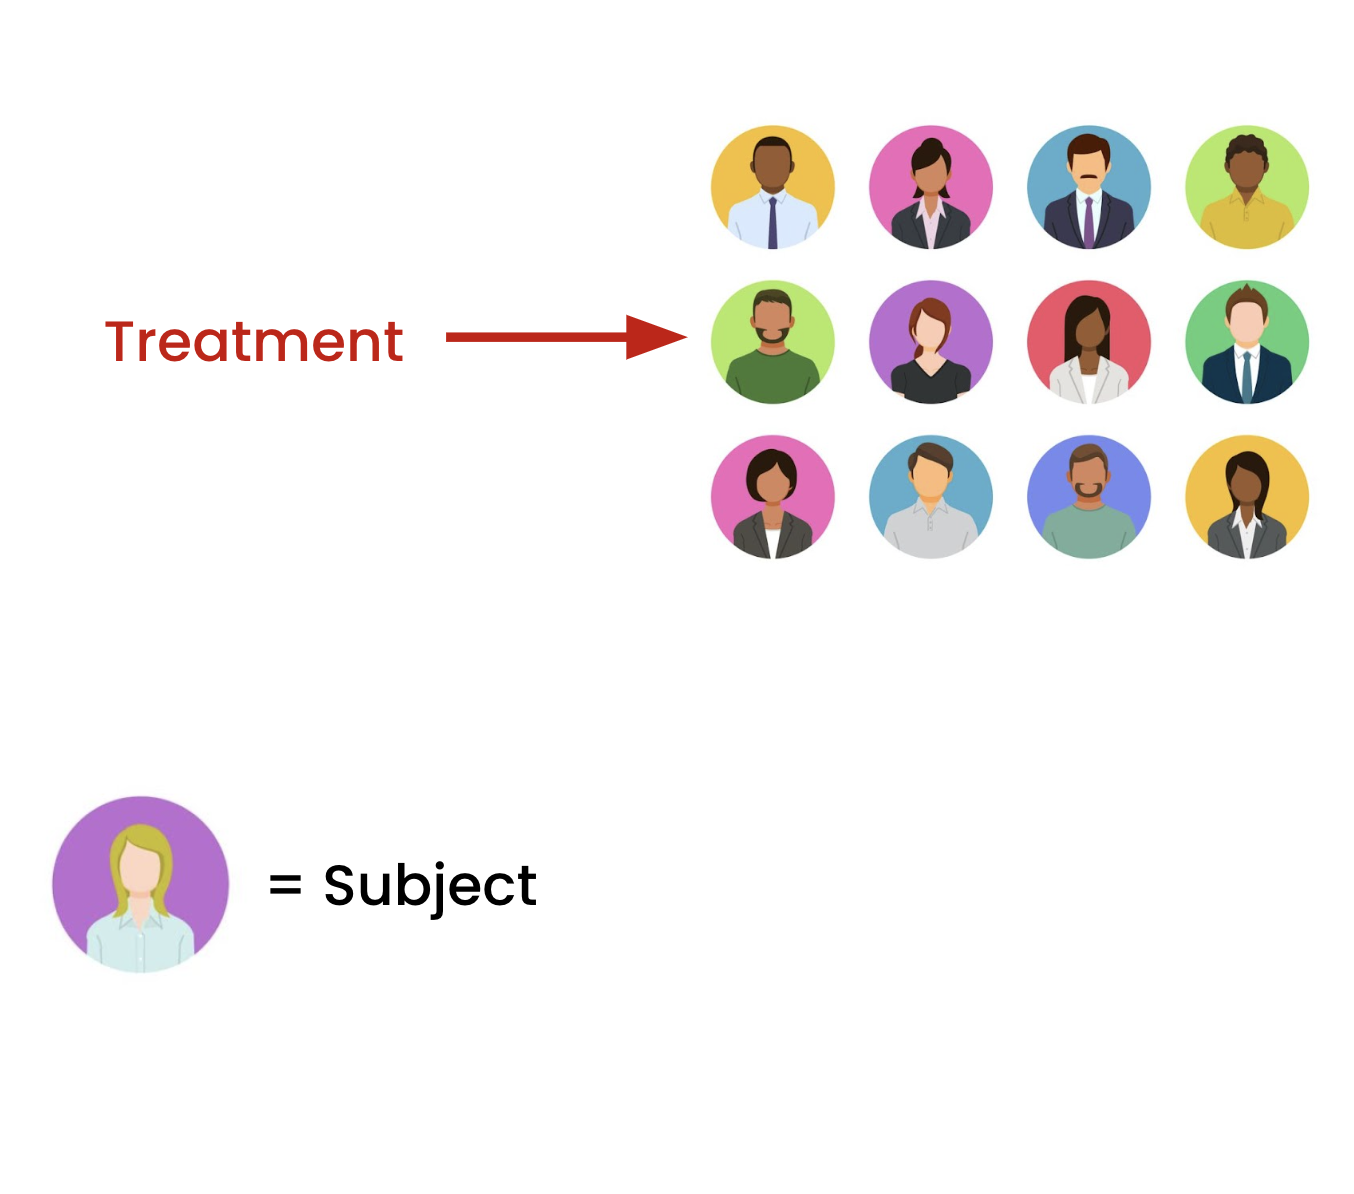
Some terminology...
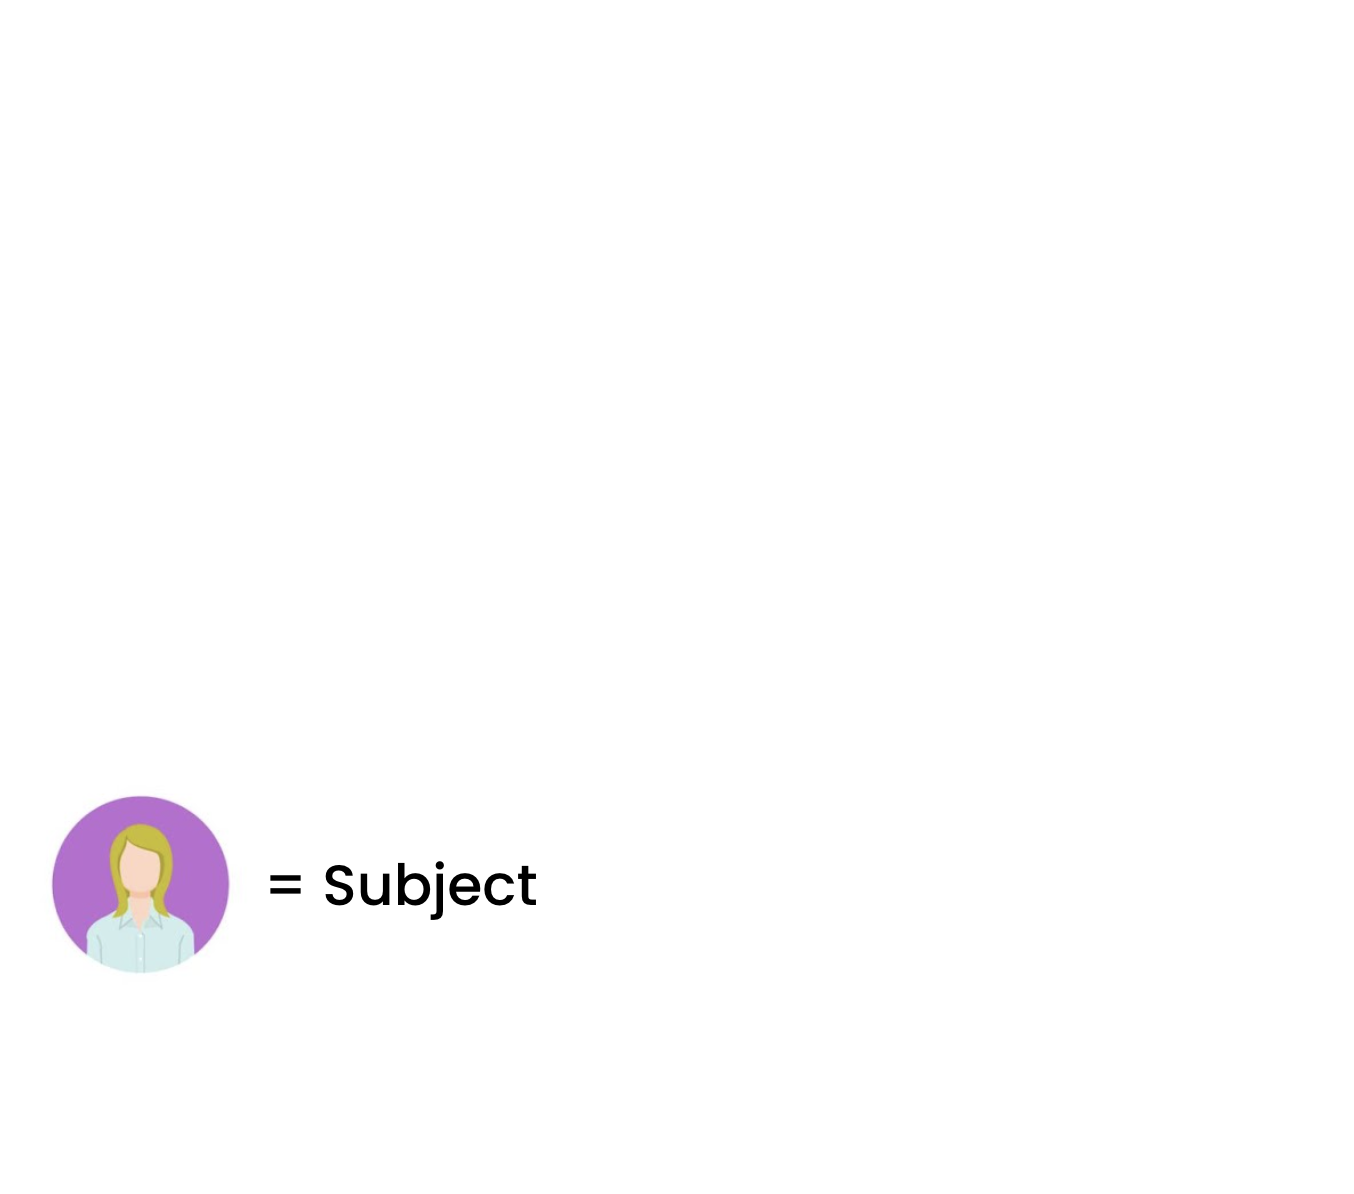
Some terminology...
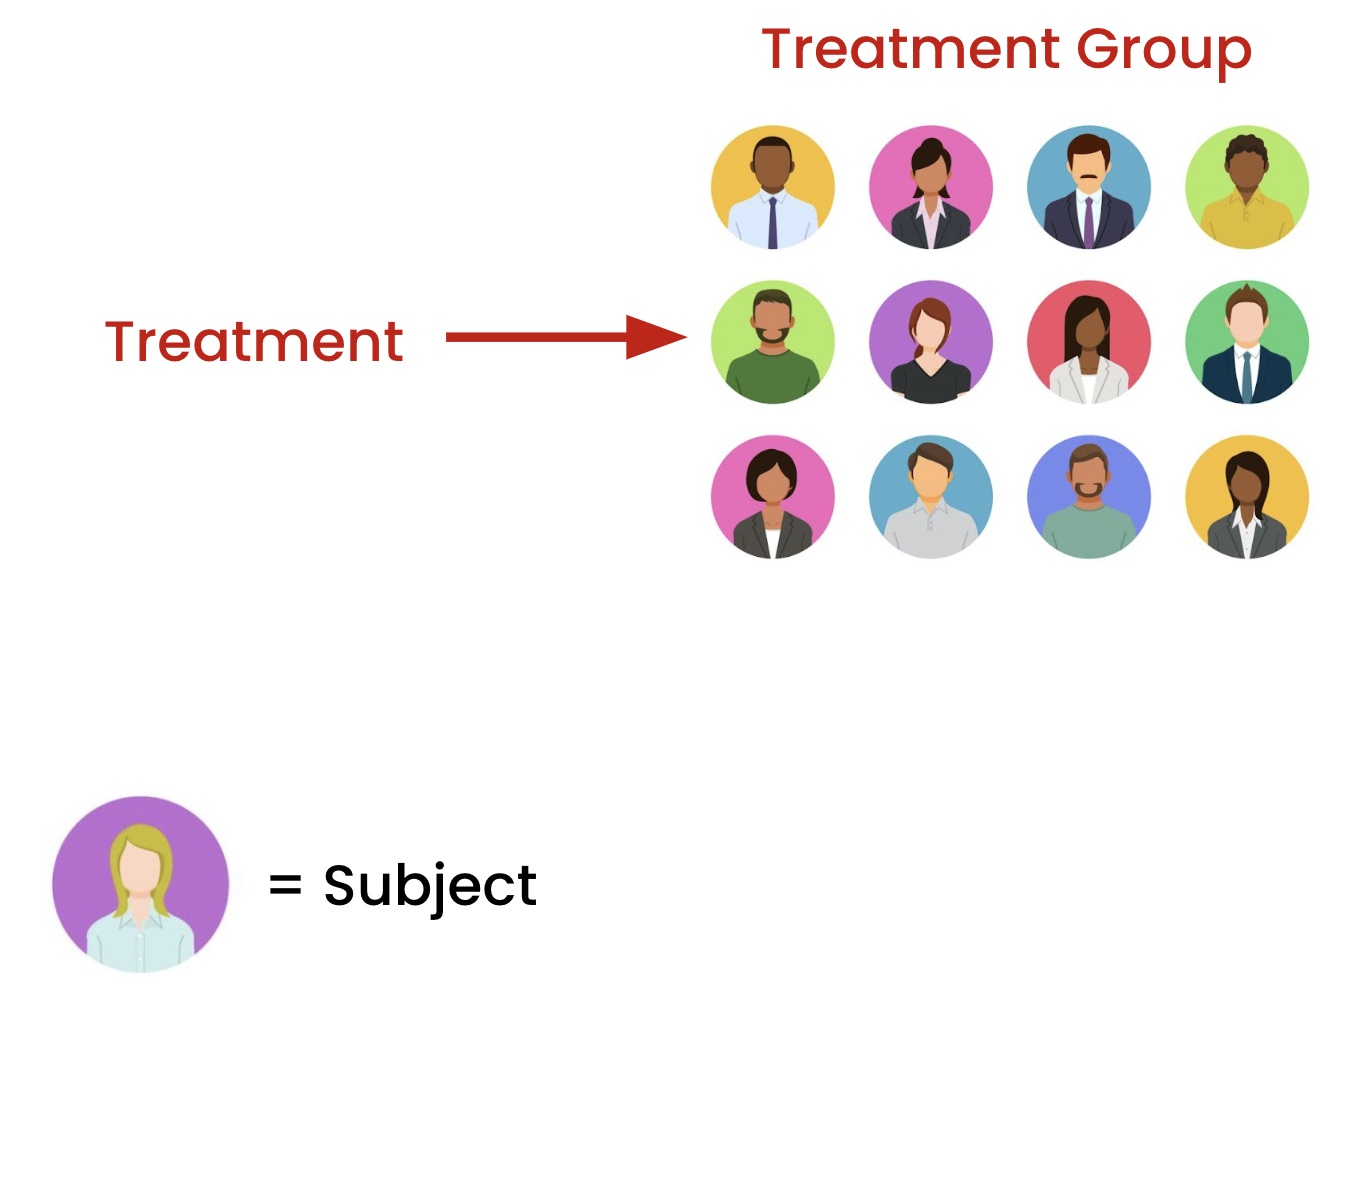
Some terminology...
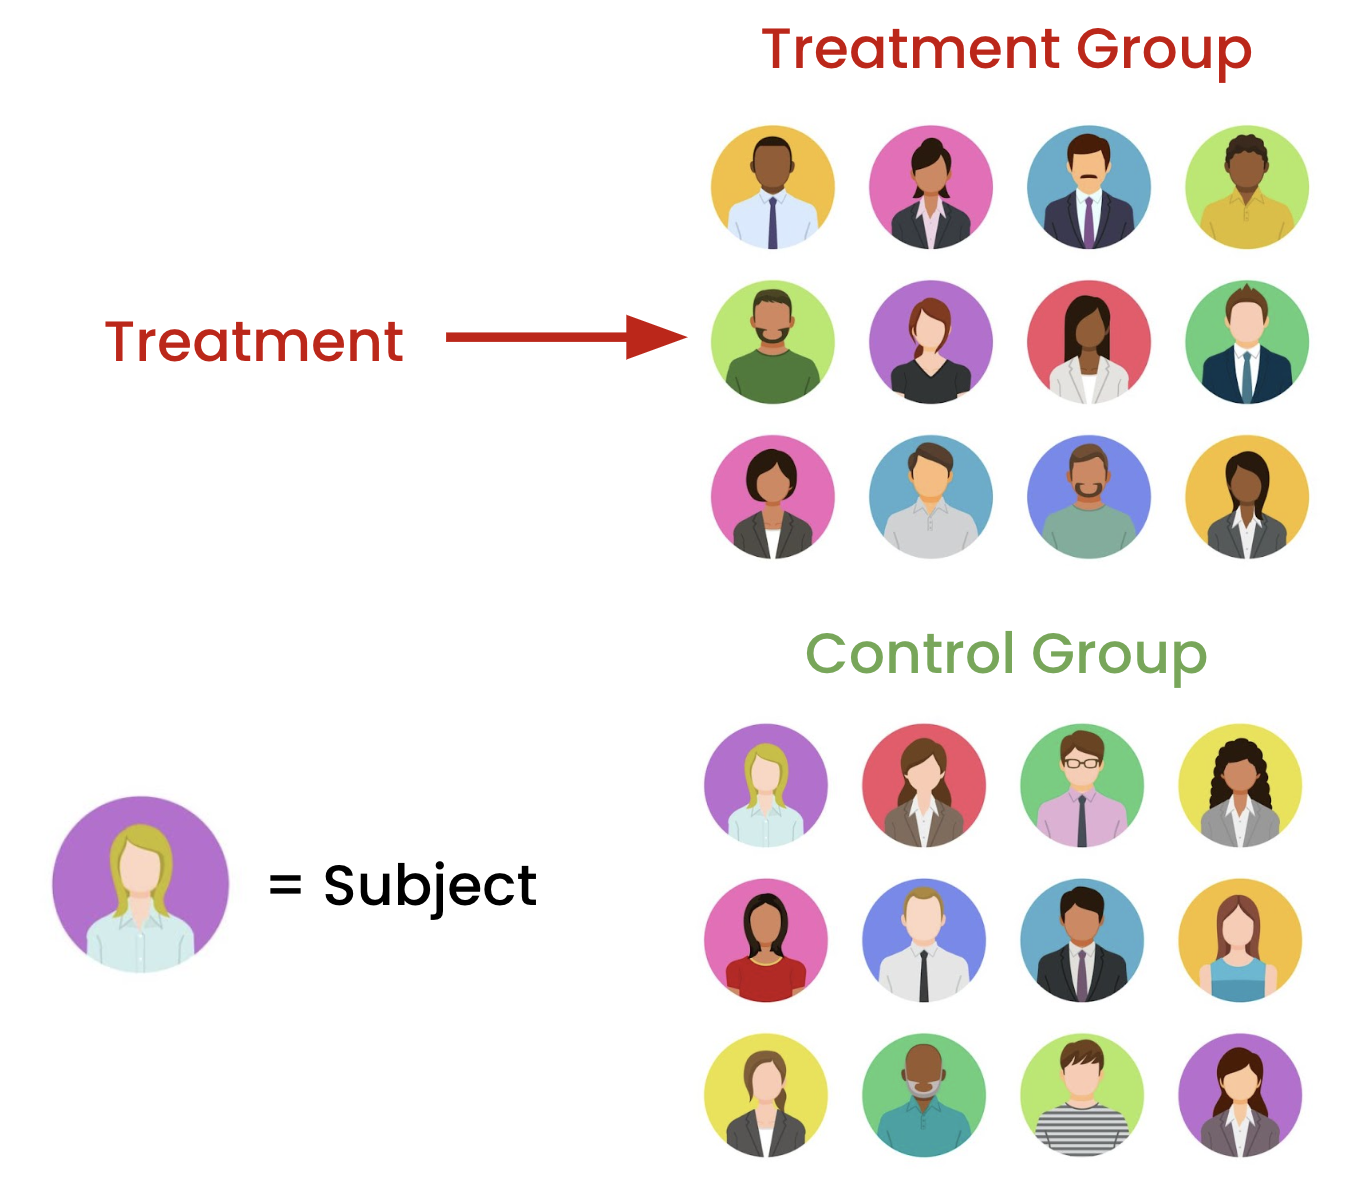
Some terminology...
Assignment summary