Introduction to analysis methods

Decoding Decision Modeling

Tiago Brasil

Lead Data Engineer

Analyze to thrive

Analysis is crucial in decision-making as it provides insights into relevant data, uncovers patterns, identifies trends, evaluates alternatives, and their potential outcomes.
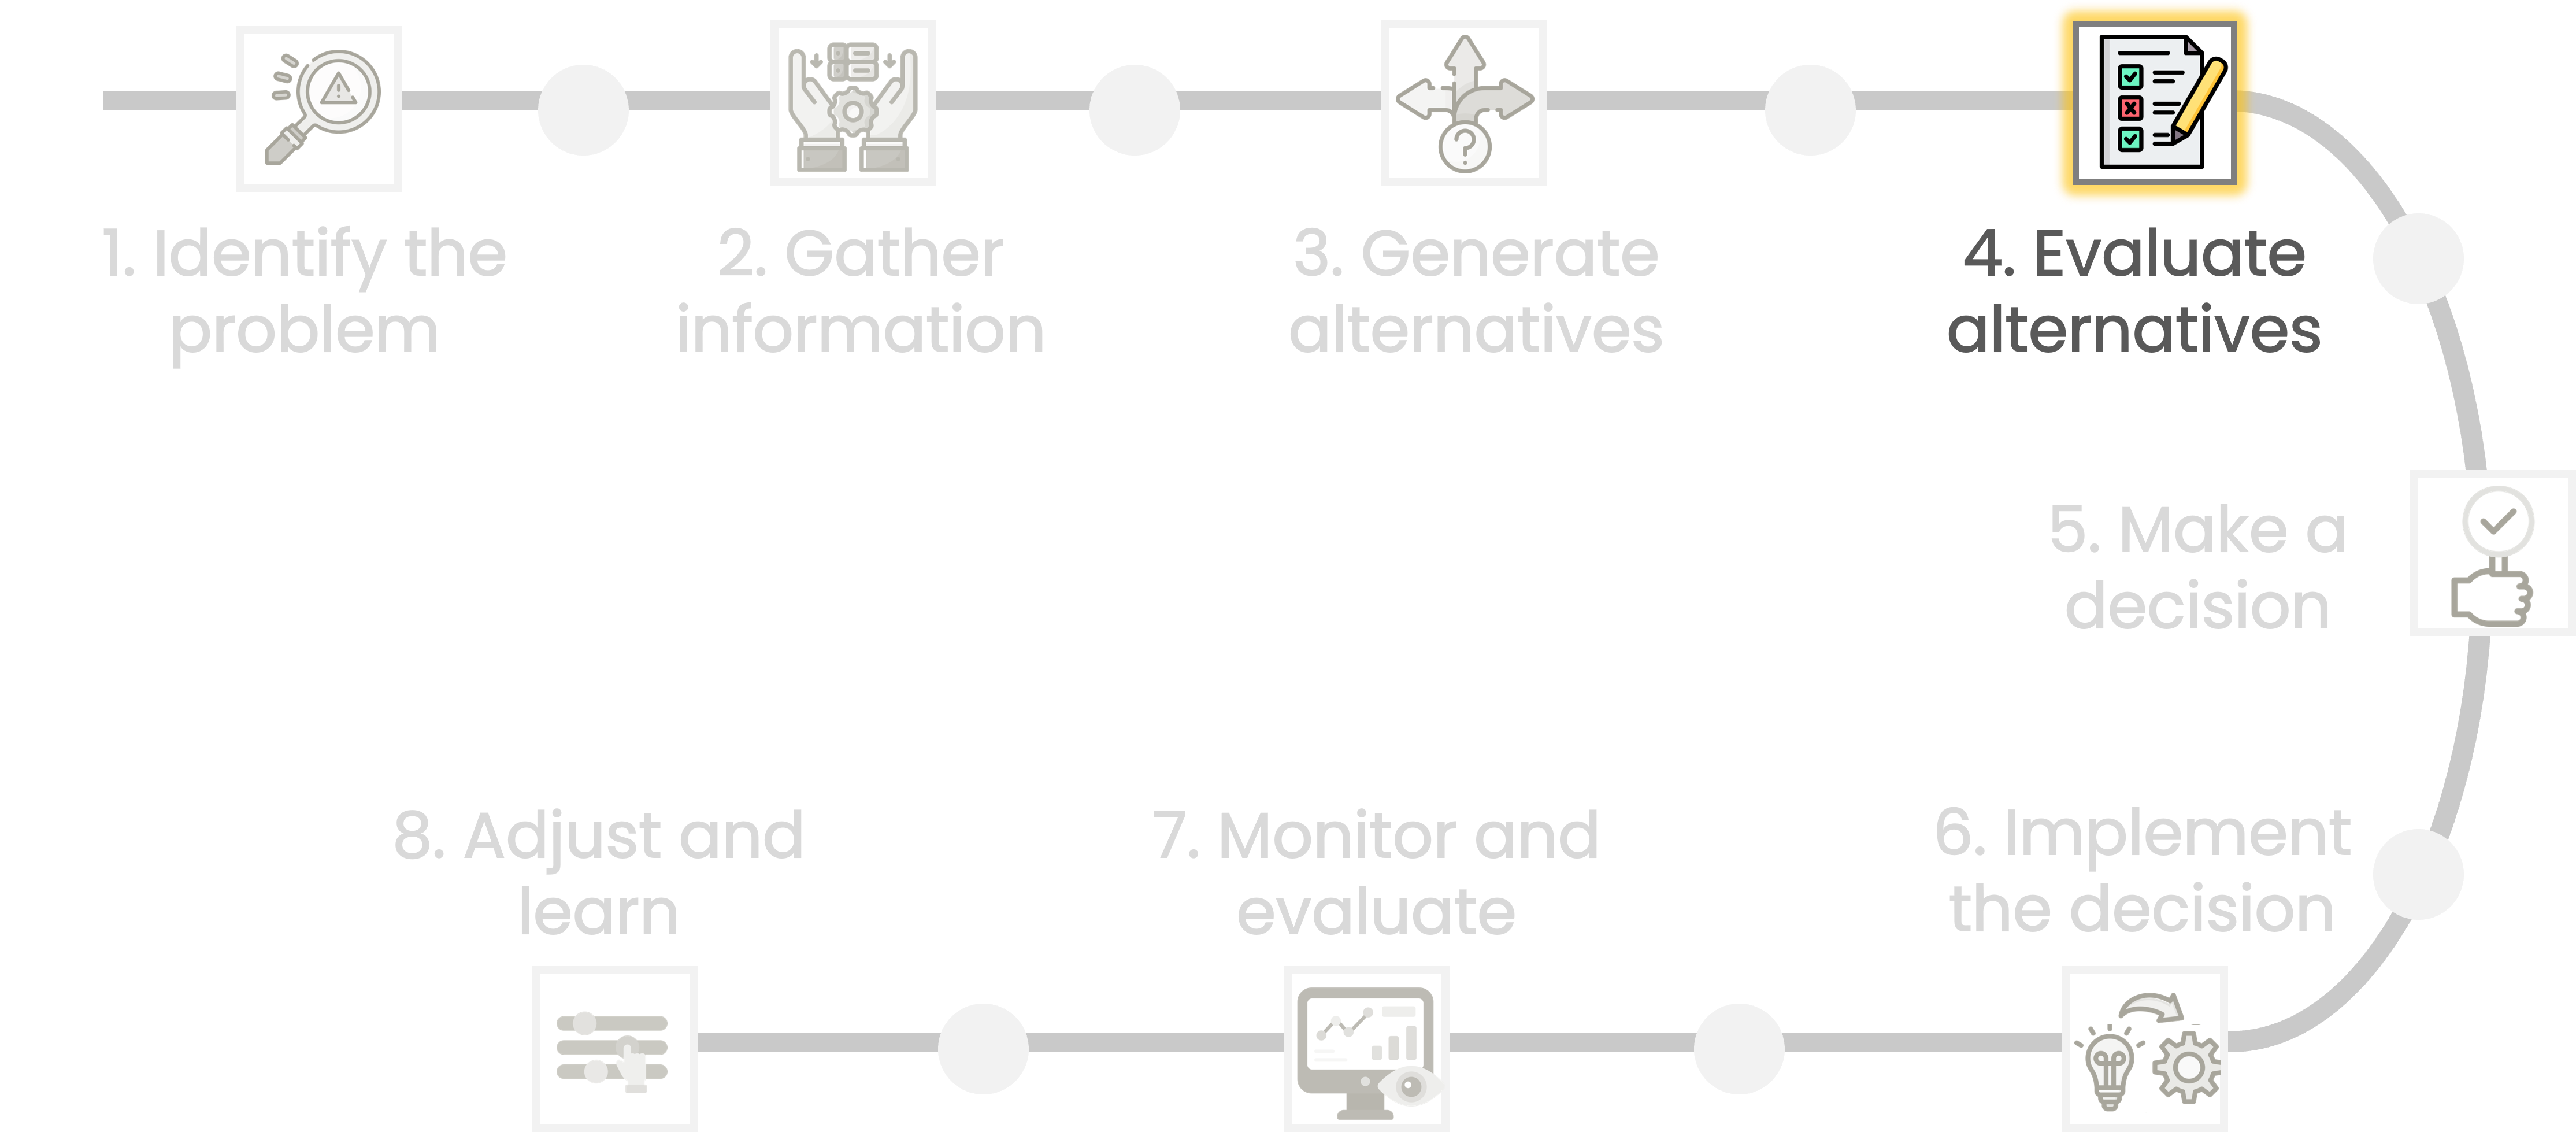
A flowchart illustrating the decision-making process with eight steps. The fourth step, "Evaluate alternatives," is highlighted.

Decoding Decision Modeling

Types of analysis

The combination of quantitative and qualitative methods provide a comprehensive approach to analysis during the decision-making process.
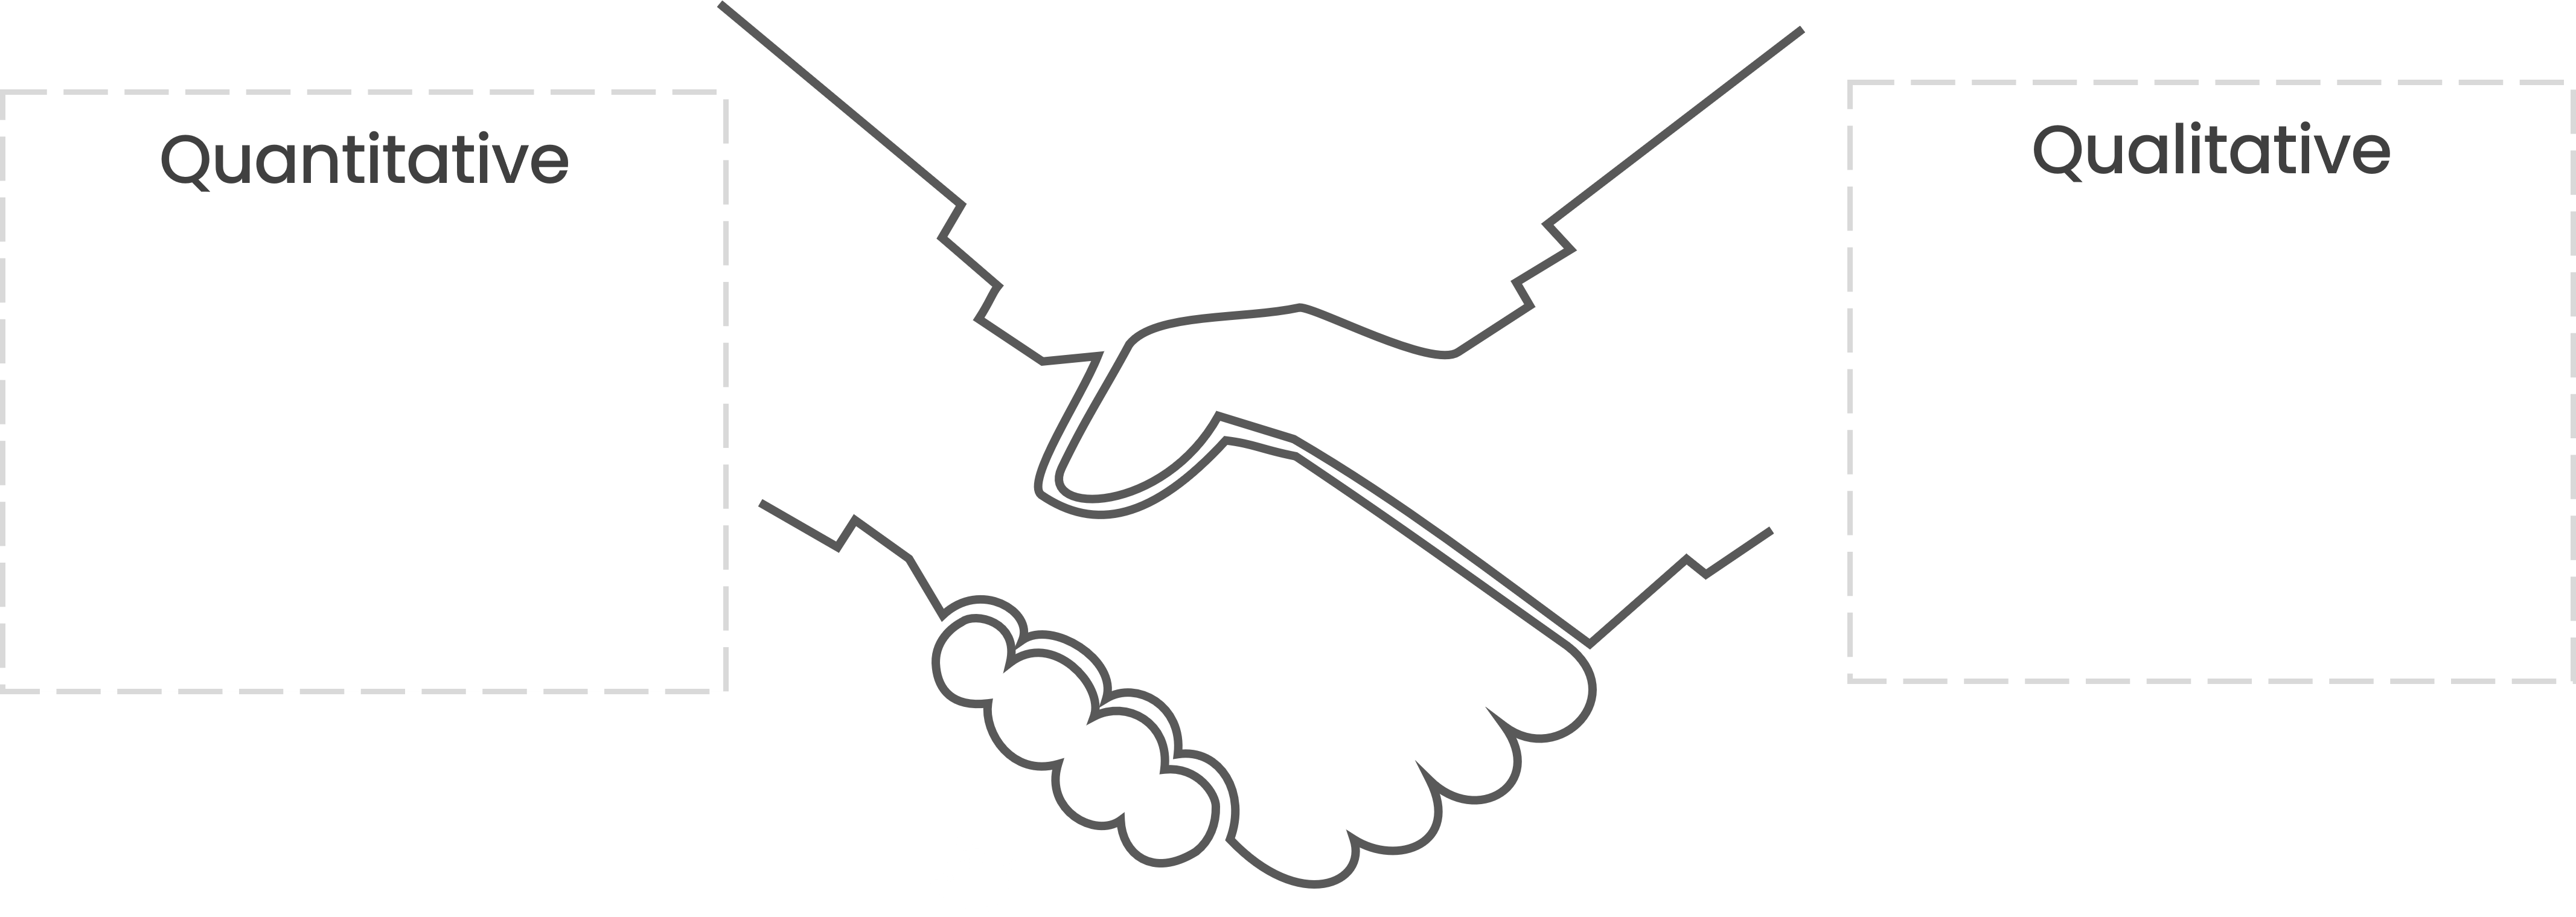
A handshake illustration with the text "Quantitative" on the left and "Qualitative" on the right.

Decoding Decision Modeling

Types of analysis

The combination of quantitative and qualitative methods provide a comprehensive approach to analysis during the decision-making process.
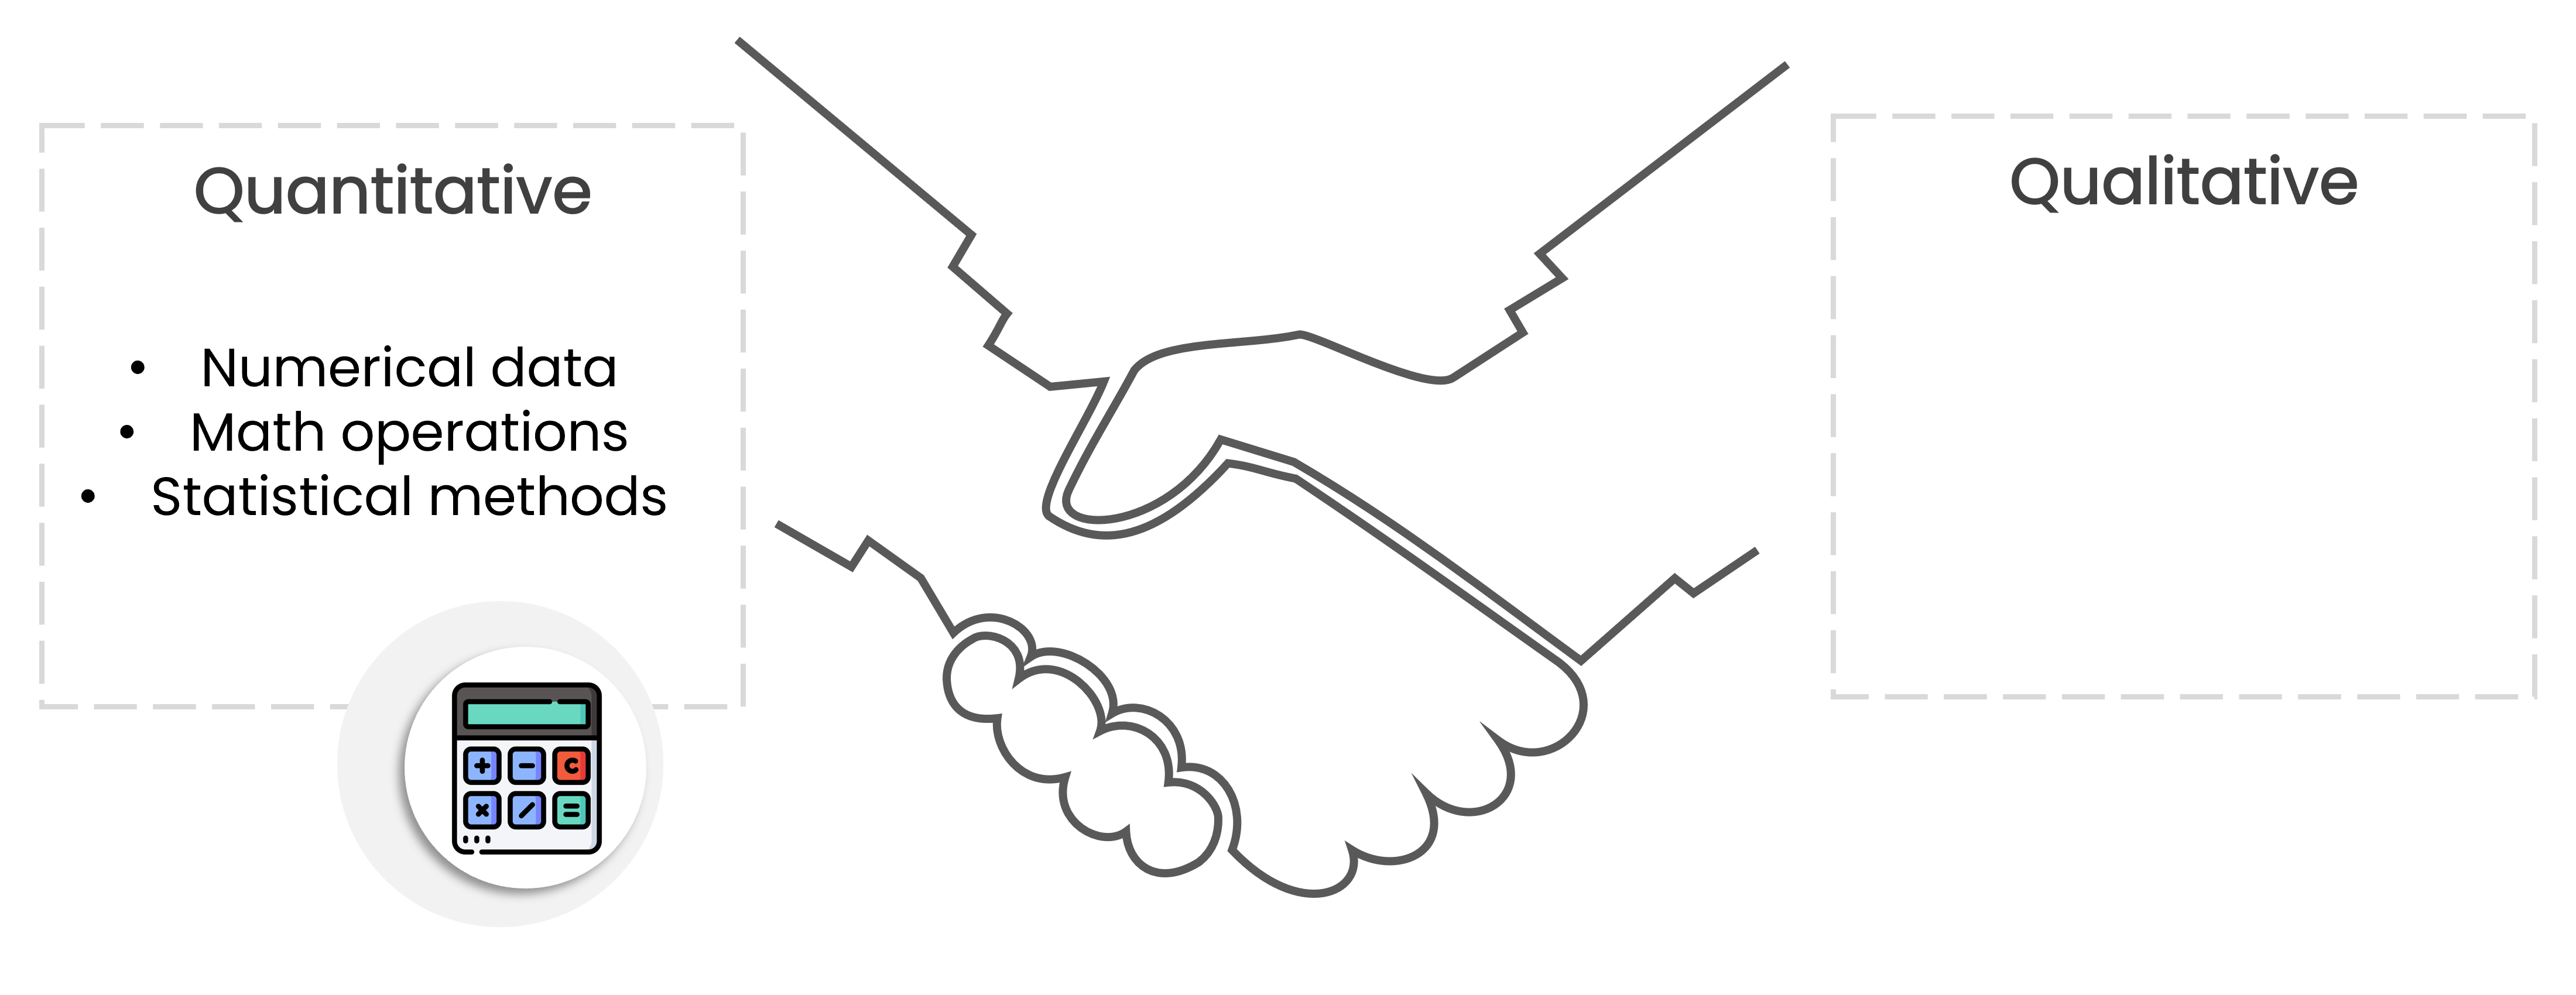
Text "Quantitative" at the top with bullet points: "Numerical data," "Math operations," and "Statistical methods." Below is an icon of a calculator.

Decoding Decision Modeling

Types of analysis

The combination of quantitative and qualitative methods provide a comprehensive approach to analysis during the decision-making process.
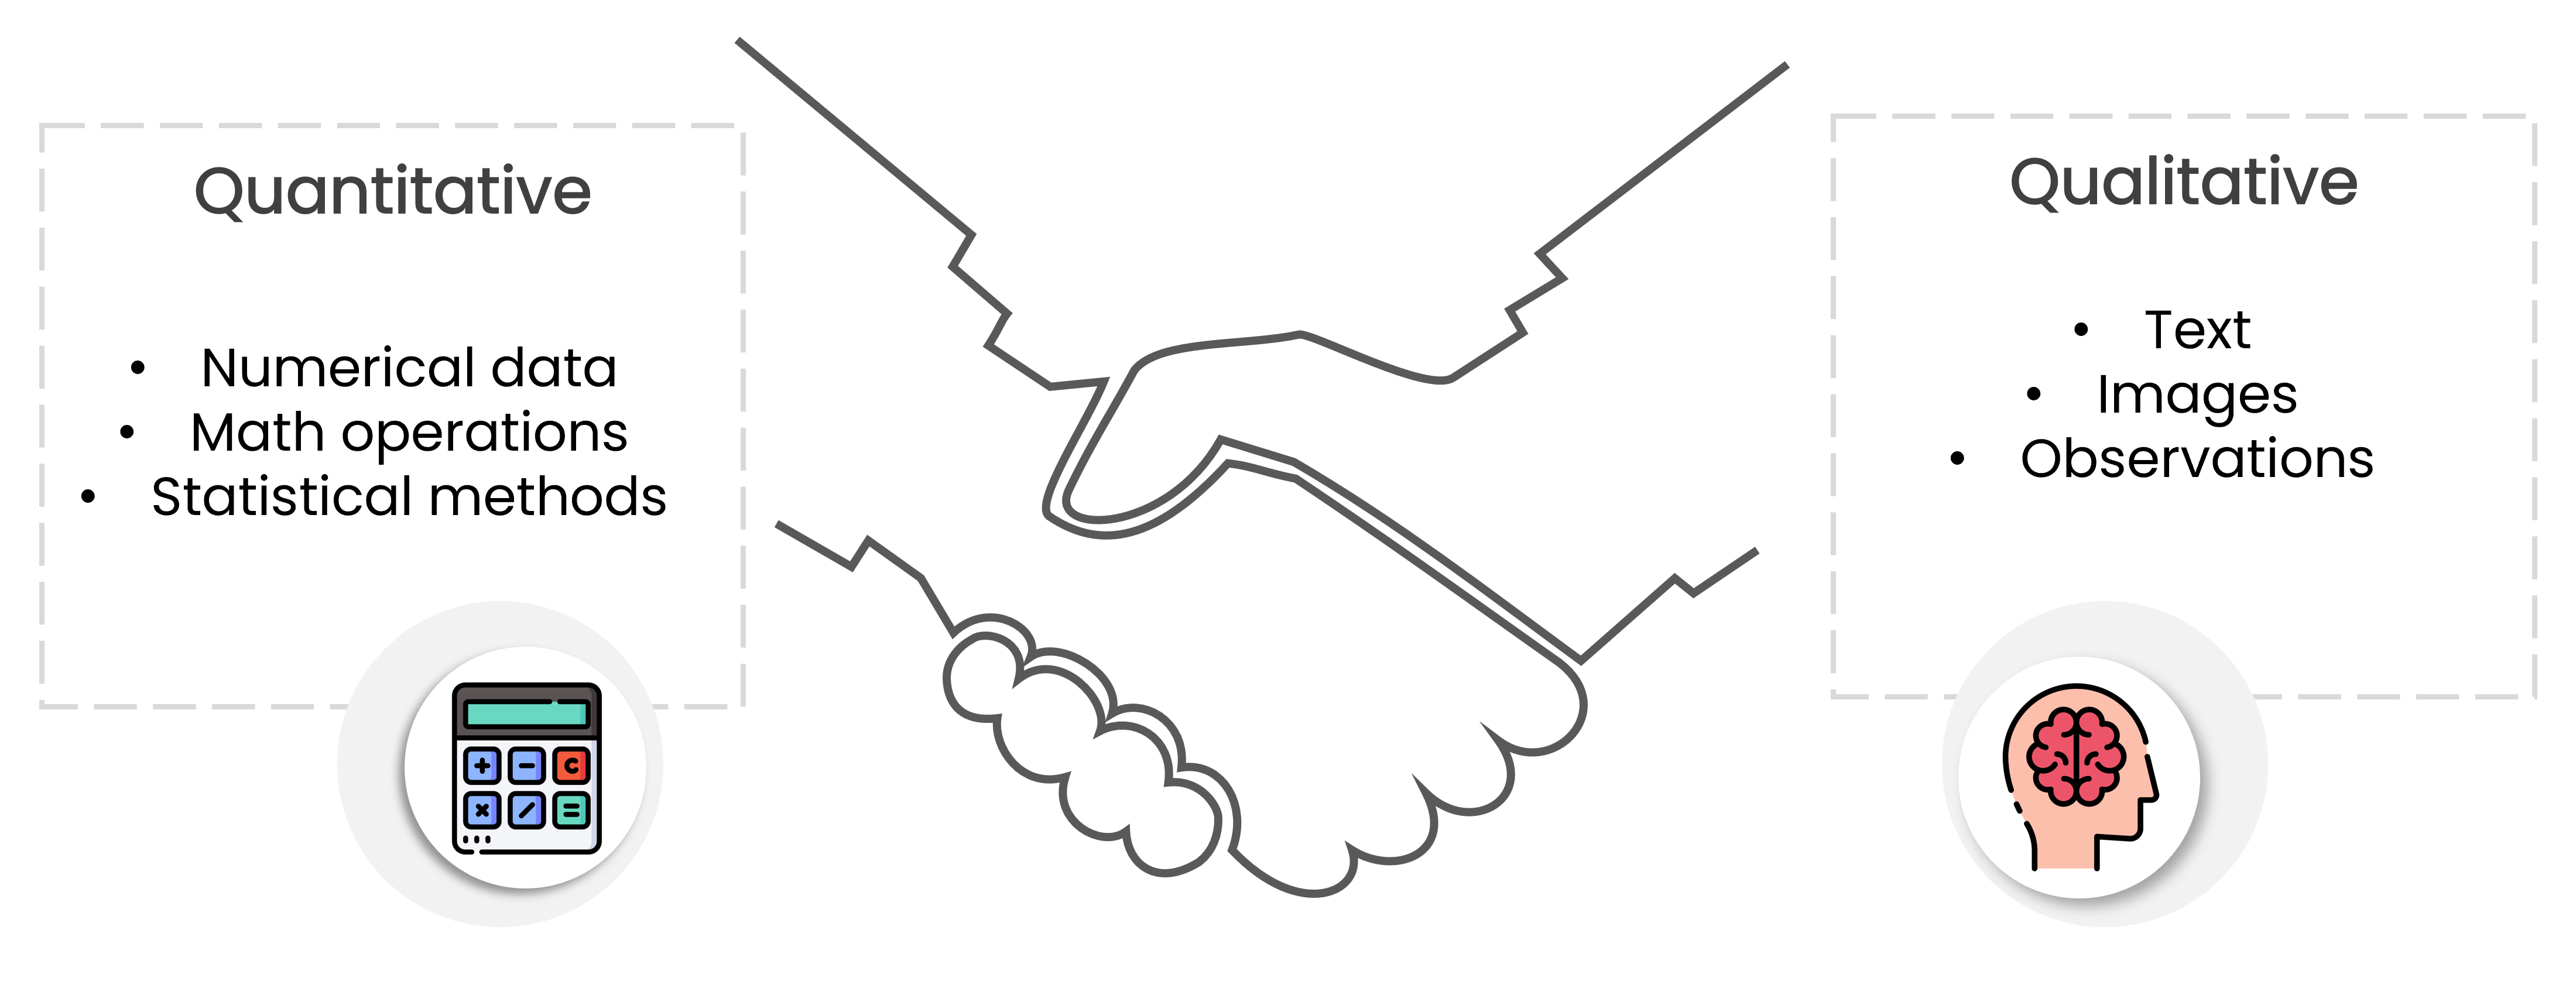
Text "Qualitative" at the top with bullet points: "Text," "Images," and "Observations." Below is an icon of a human head with a brain.

Decoding Decision Modeling

Quantitative analysis

An icon of a calculator with mathematical operation buttons.

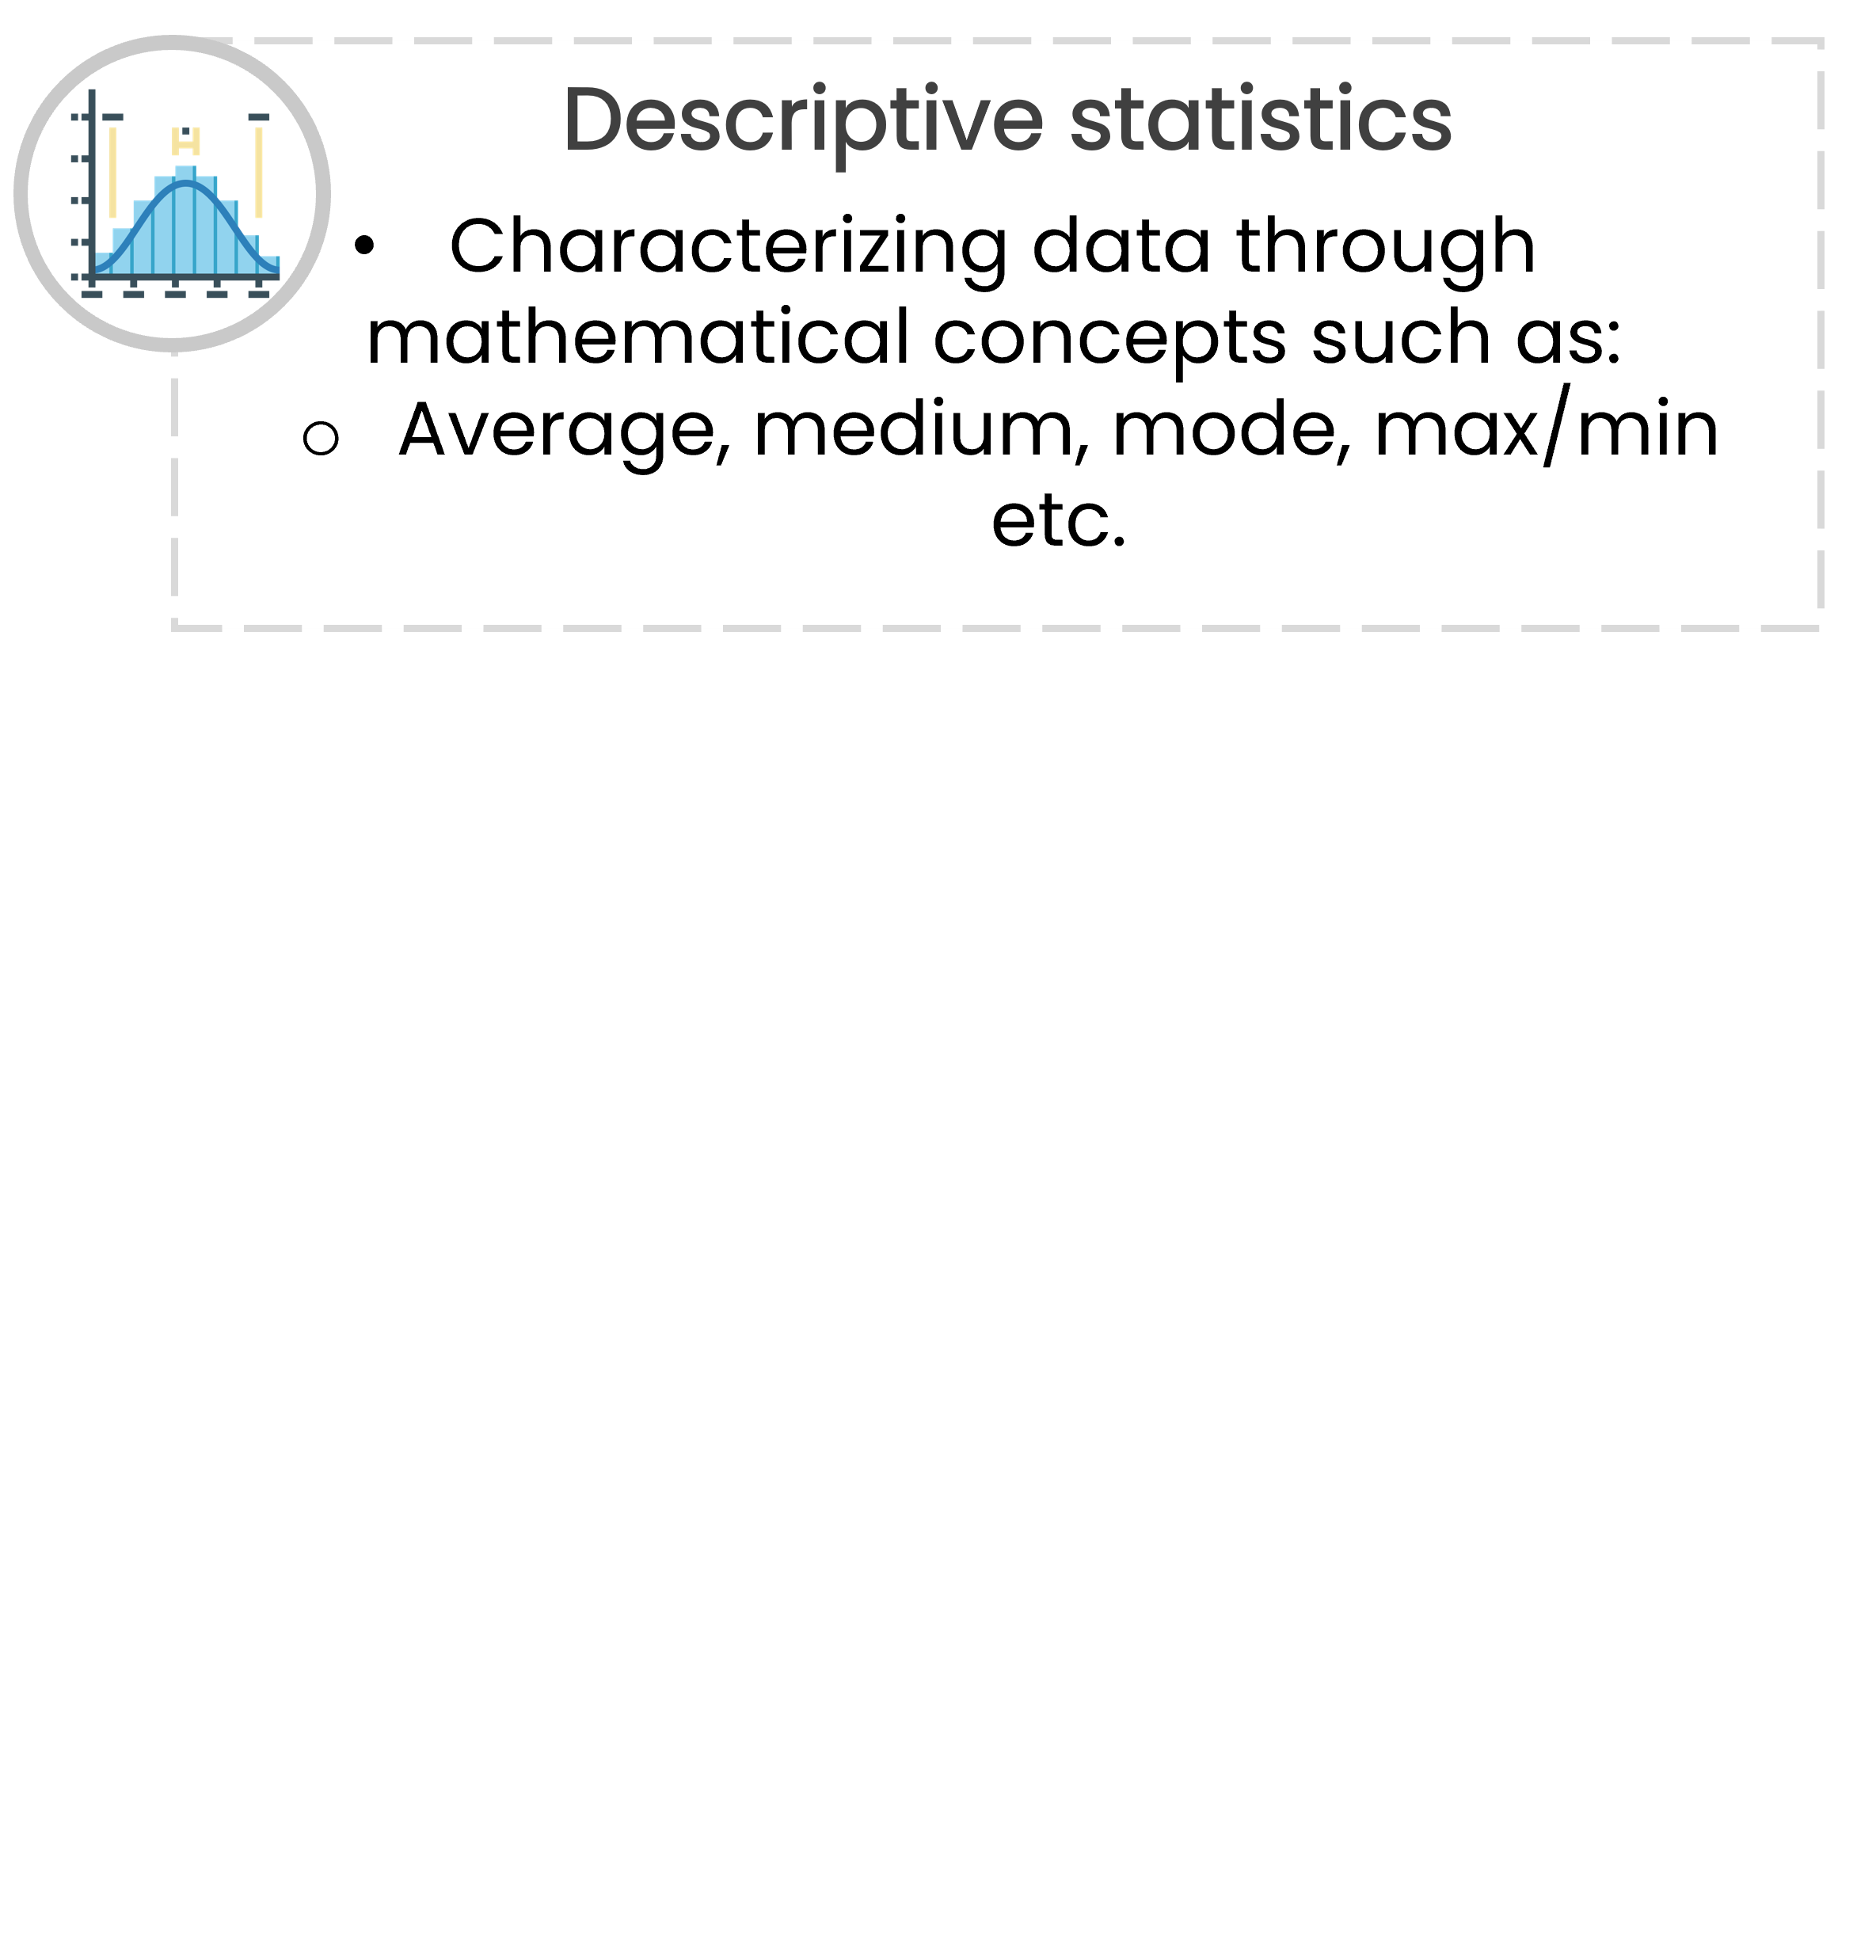
Text "Descriptive statistics" with a bullet point: "Characterizing data through mathematical concepts such as: Average, median, mode, max/min, etc." To the left is an icon of a bell curve.

Decoding Decision Modeling

Quantitative analysis

An icon of a calculator with mathematical operation buttons.

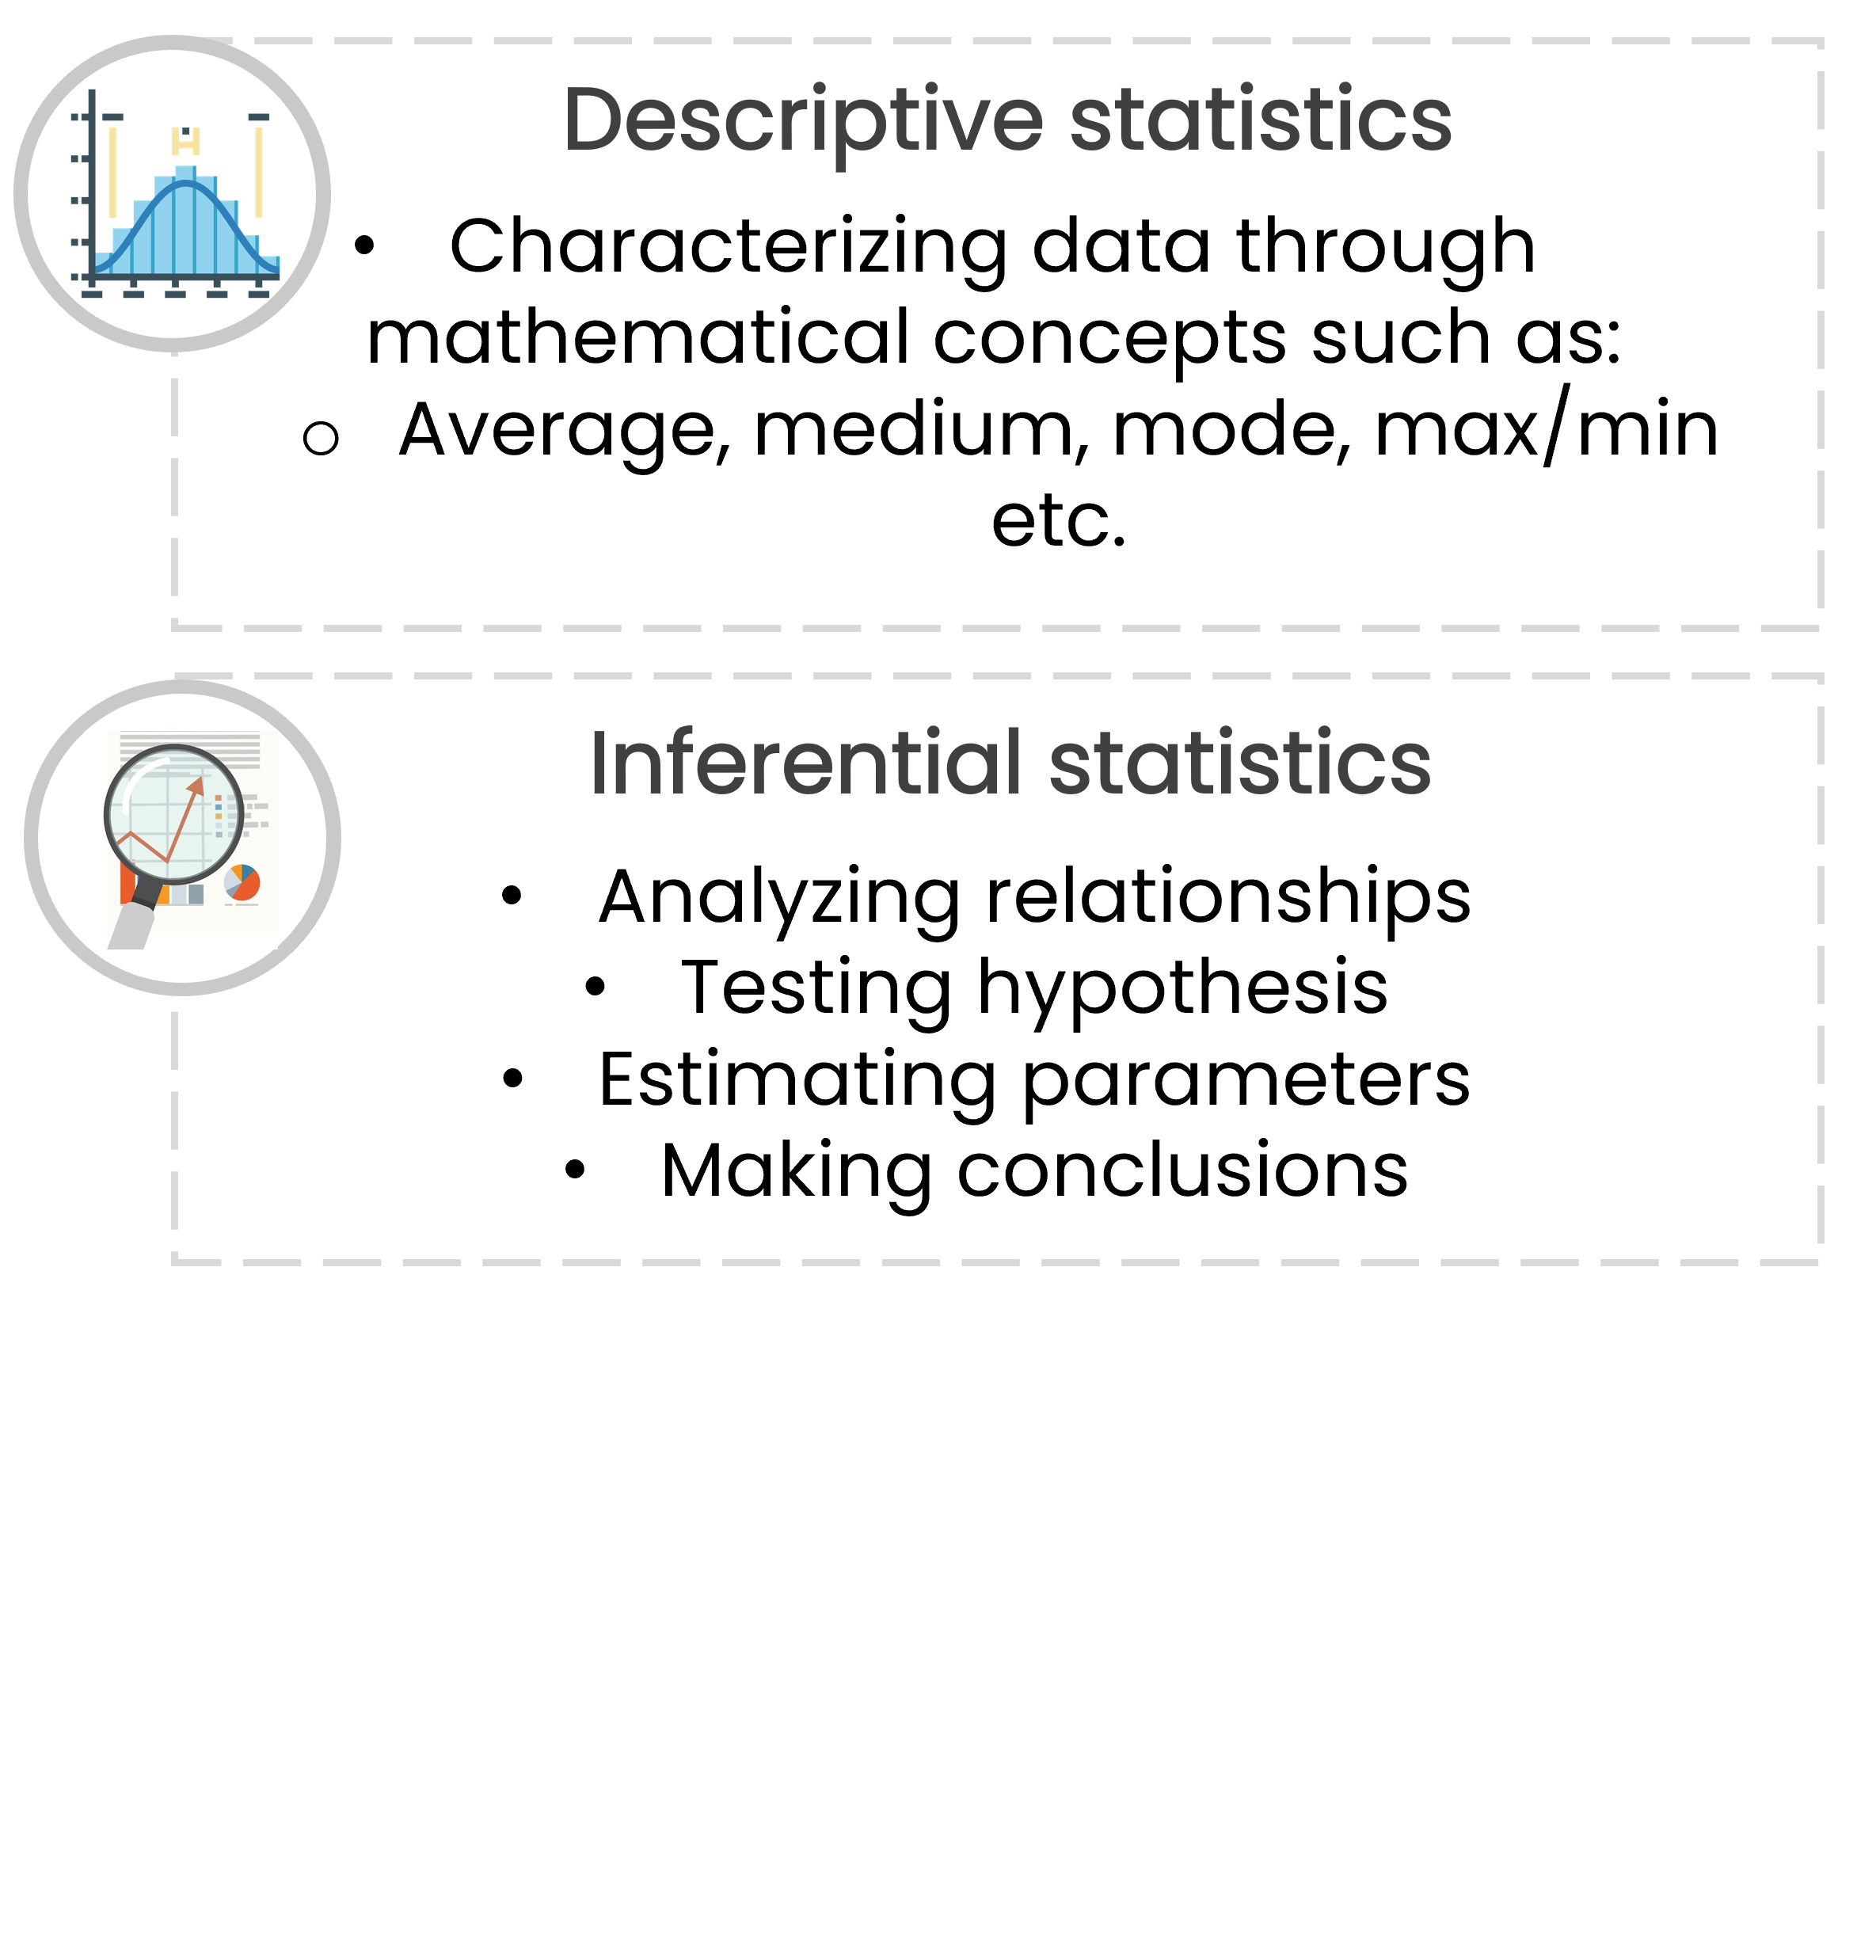
Text "Inferential statistics" with bullet points: "Analyzing relationships," "Testing hypothesis," "Estimating parameters," and "Making conclusions." To the left is an icon of a magnifying glass over a line chart

Decoding Decision Modeling

Quantitative analysis

An icon of a calculator with mathematical operation buttons.

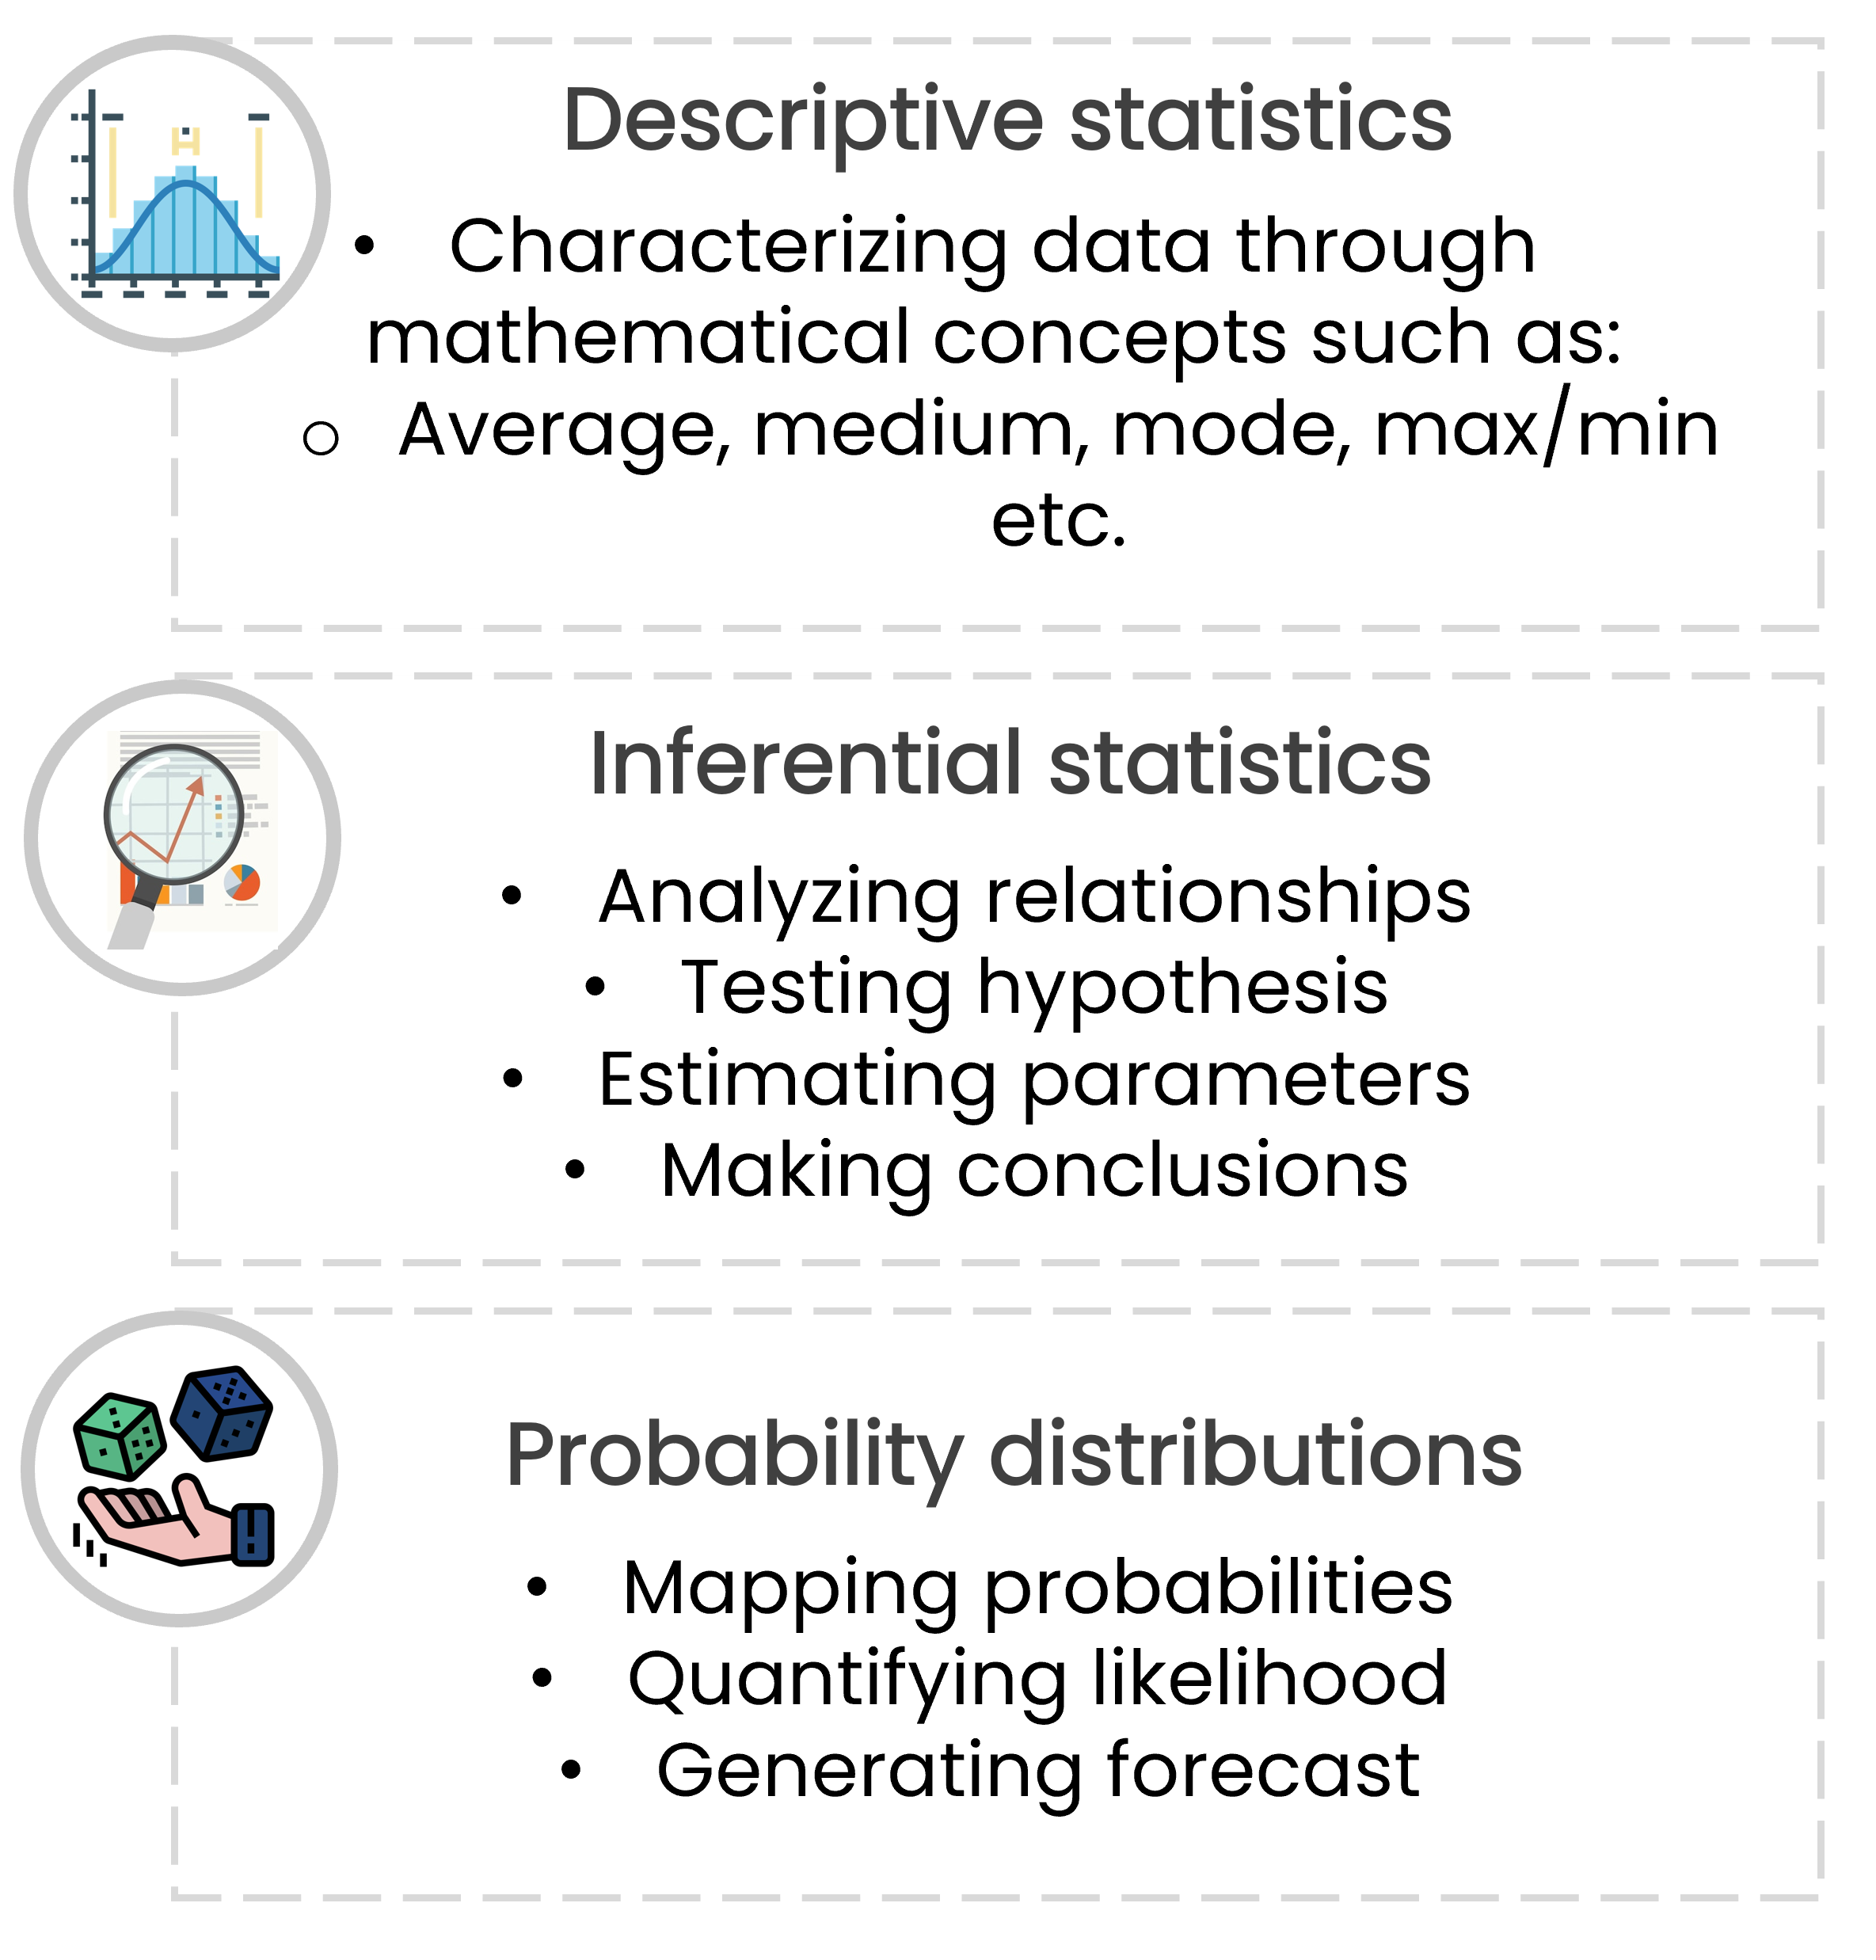
Text "Probability distributions" with bullet points: "Mapping probabilities," "Quantifying likelihood," and "Generating forecast." To the left is an icon of a hand holding dice.

Decoding Decision Modeling

Qualitative analysis

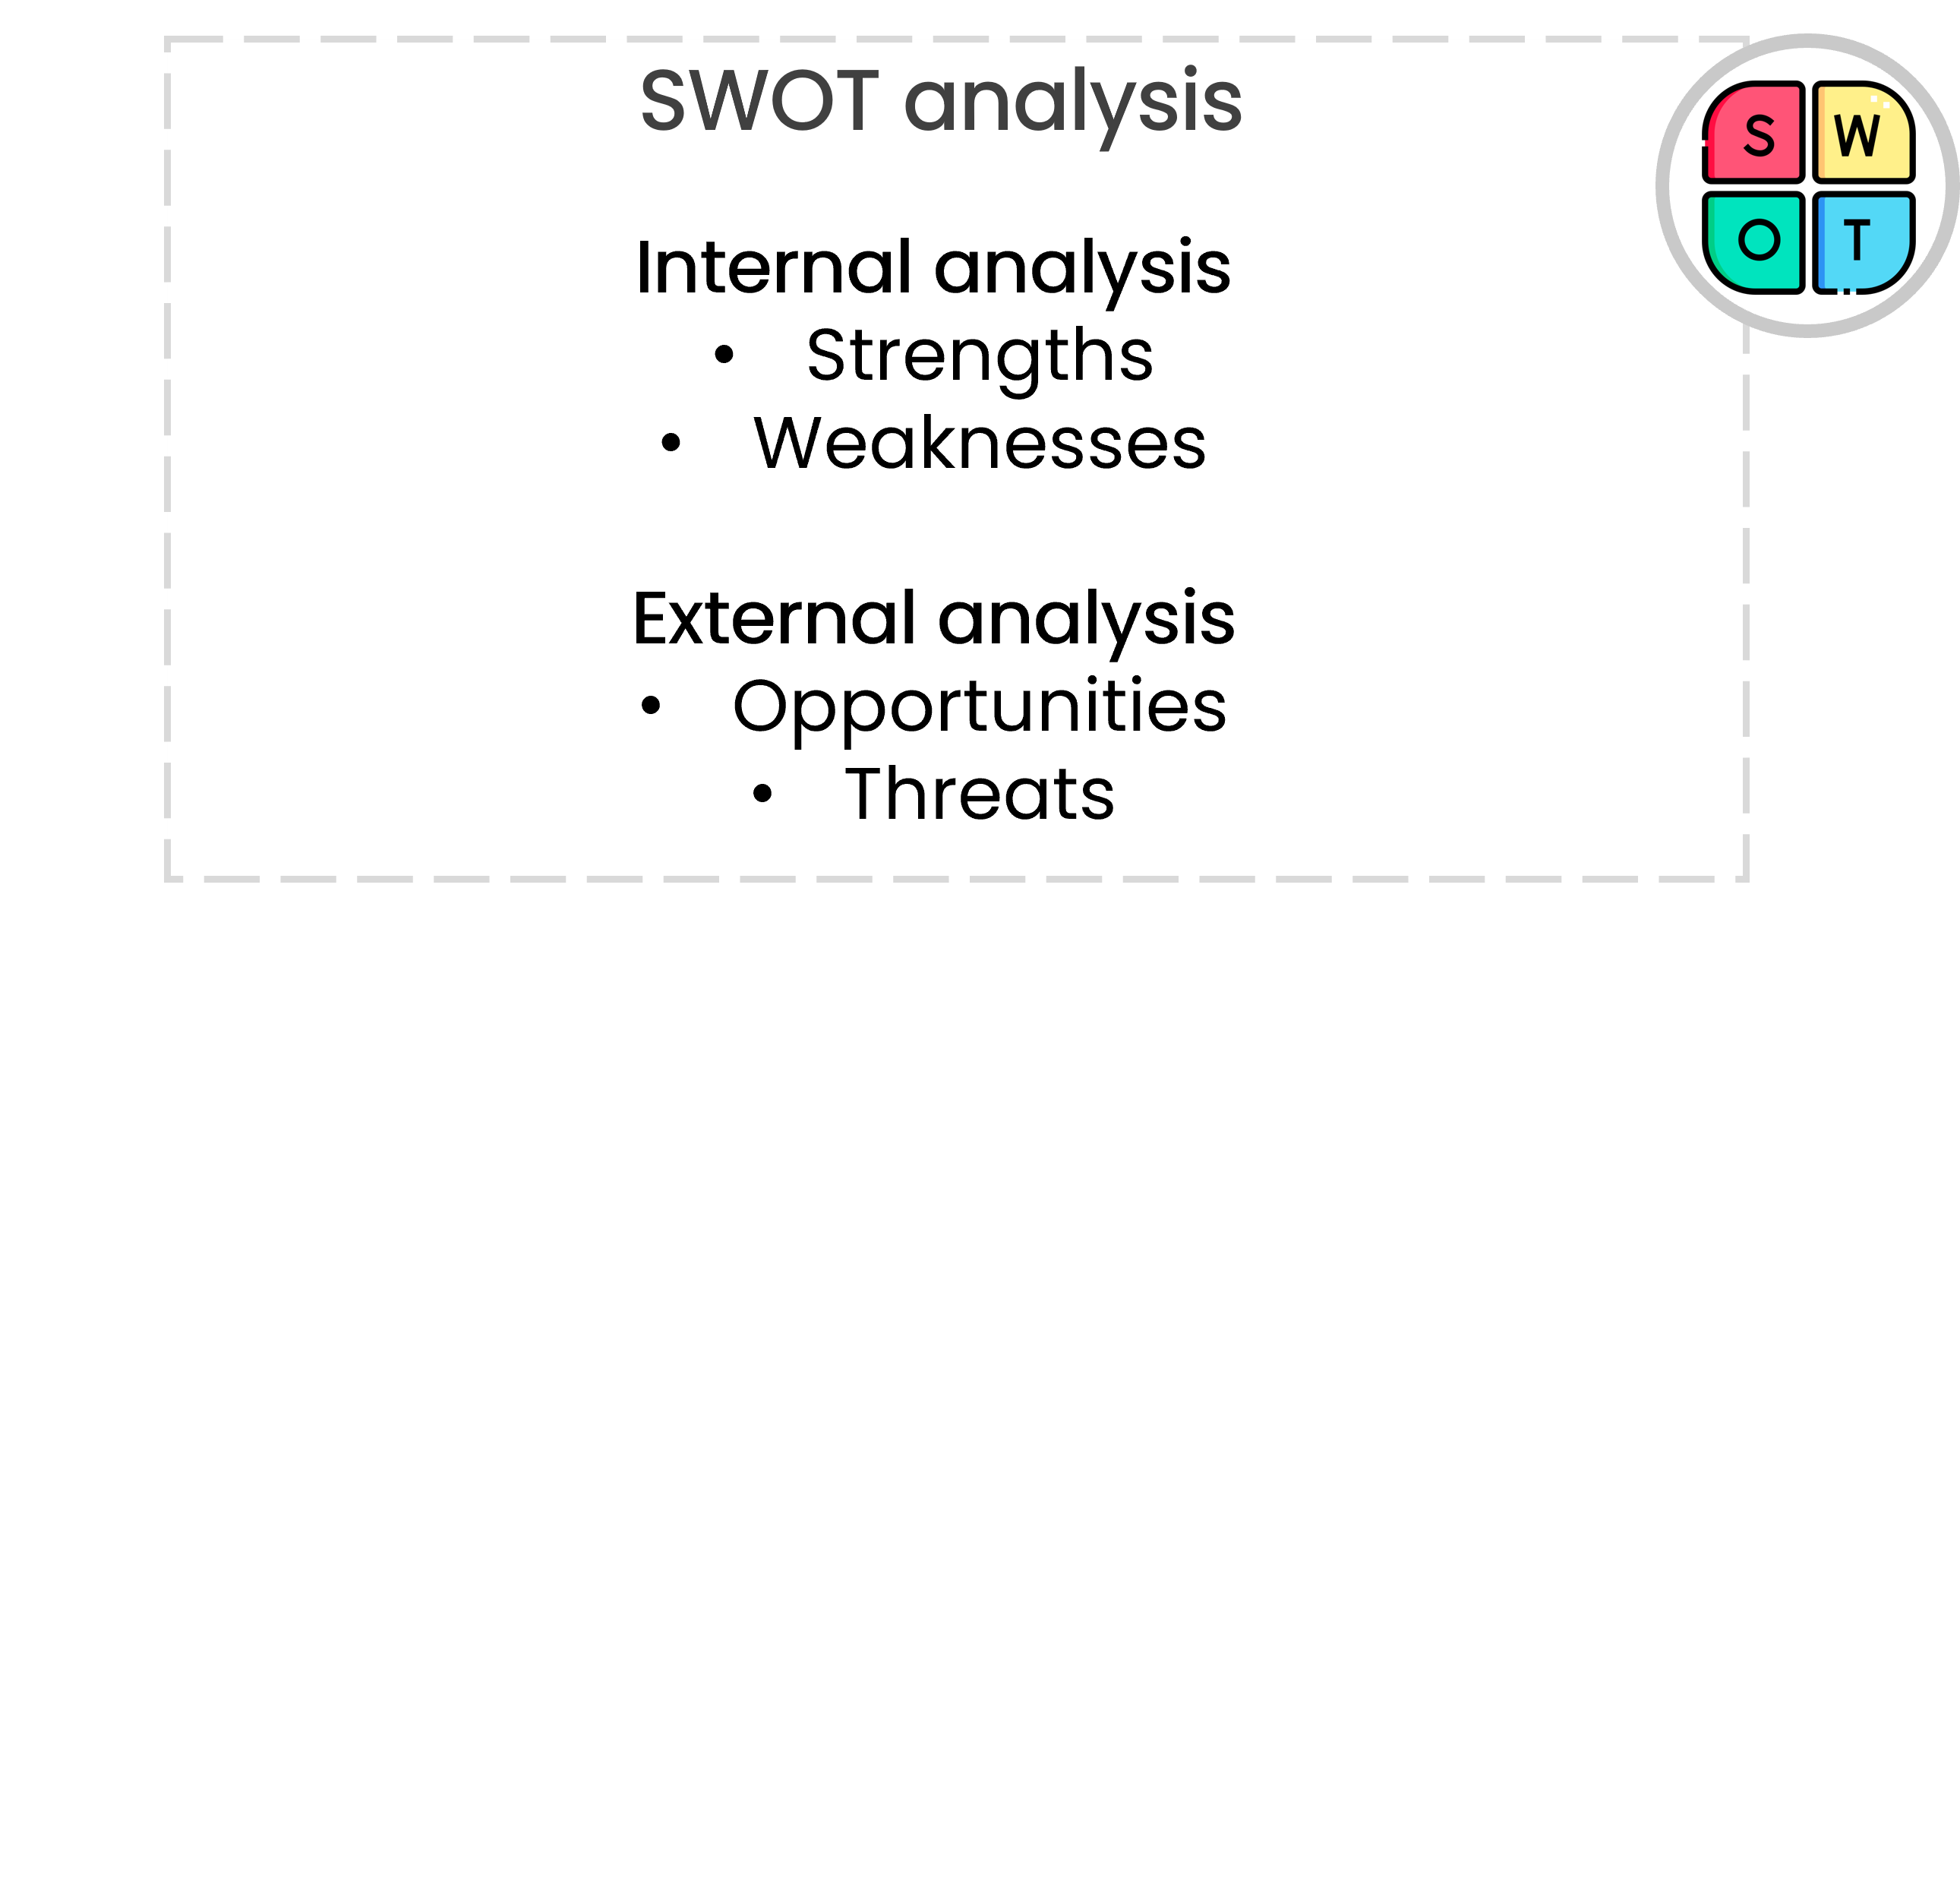
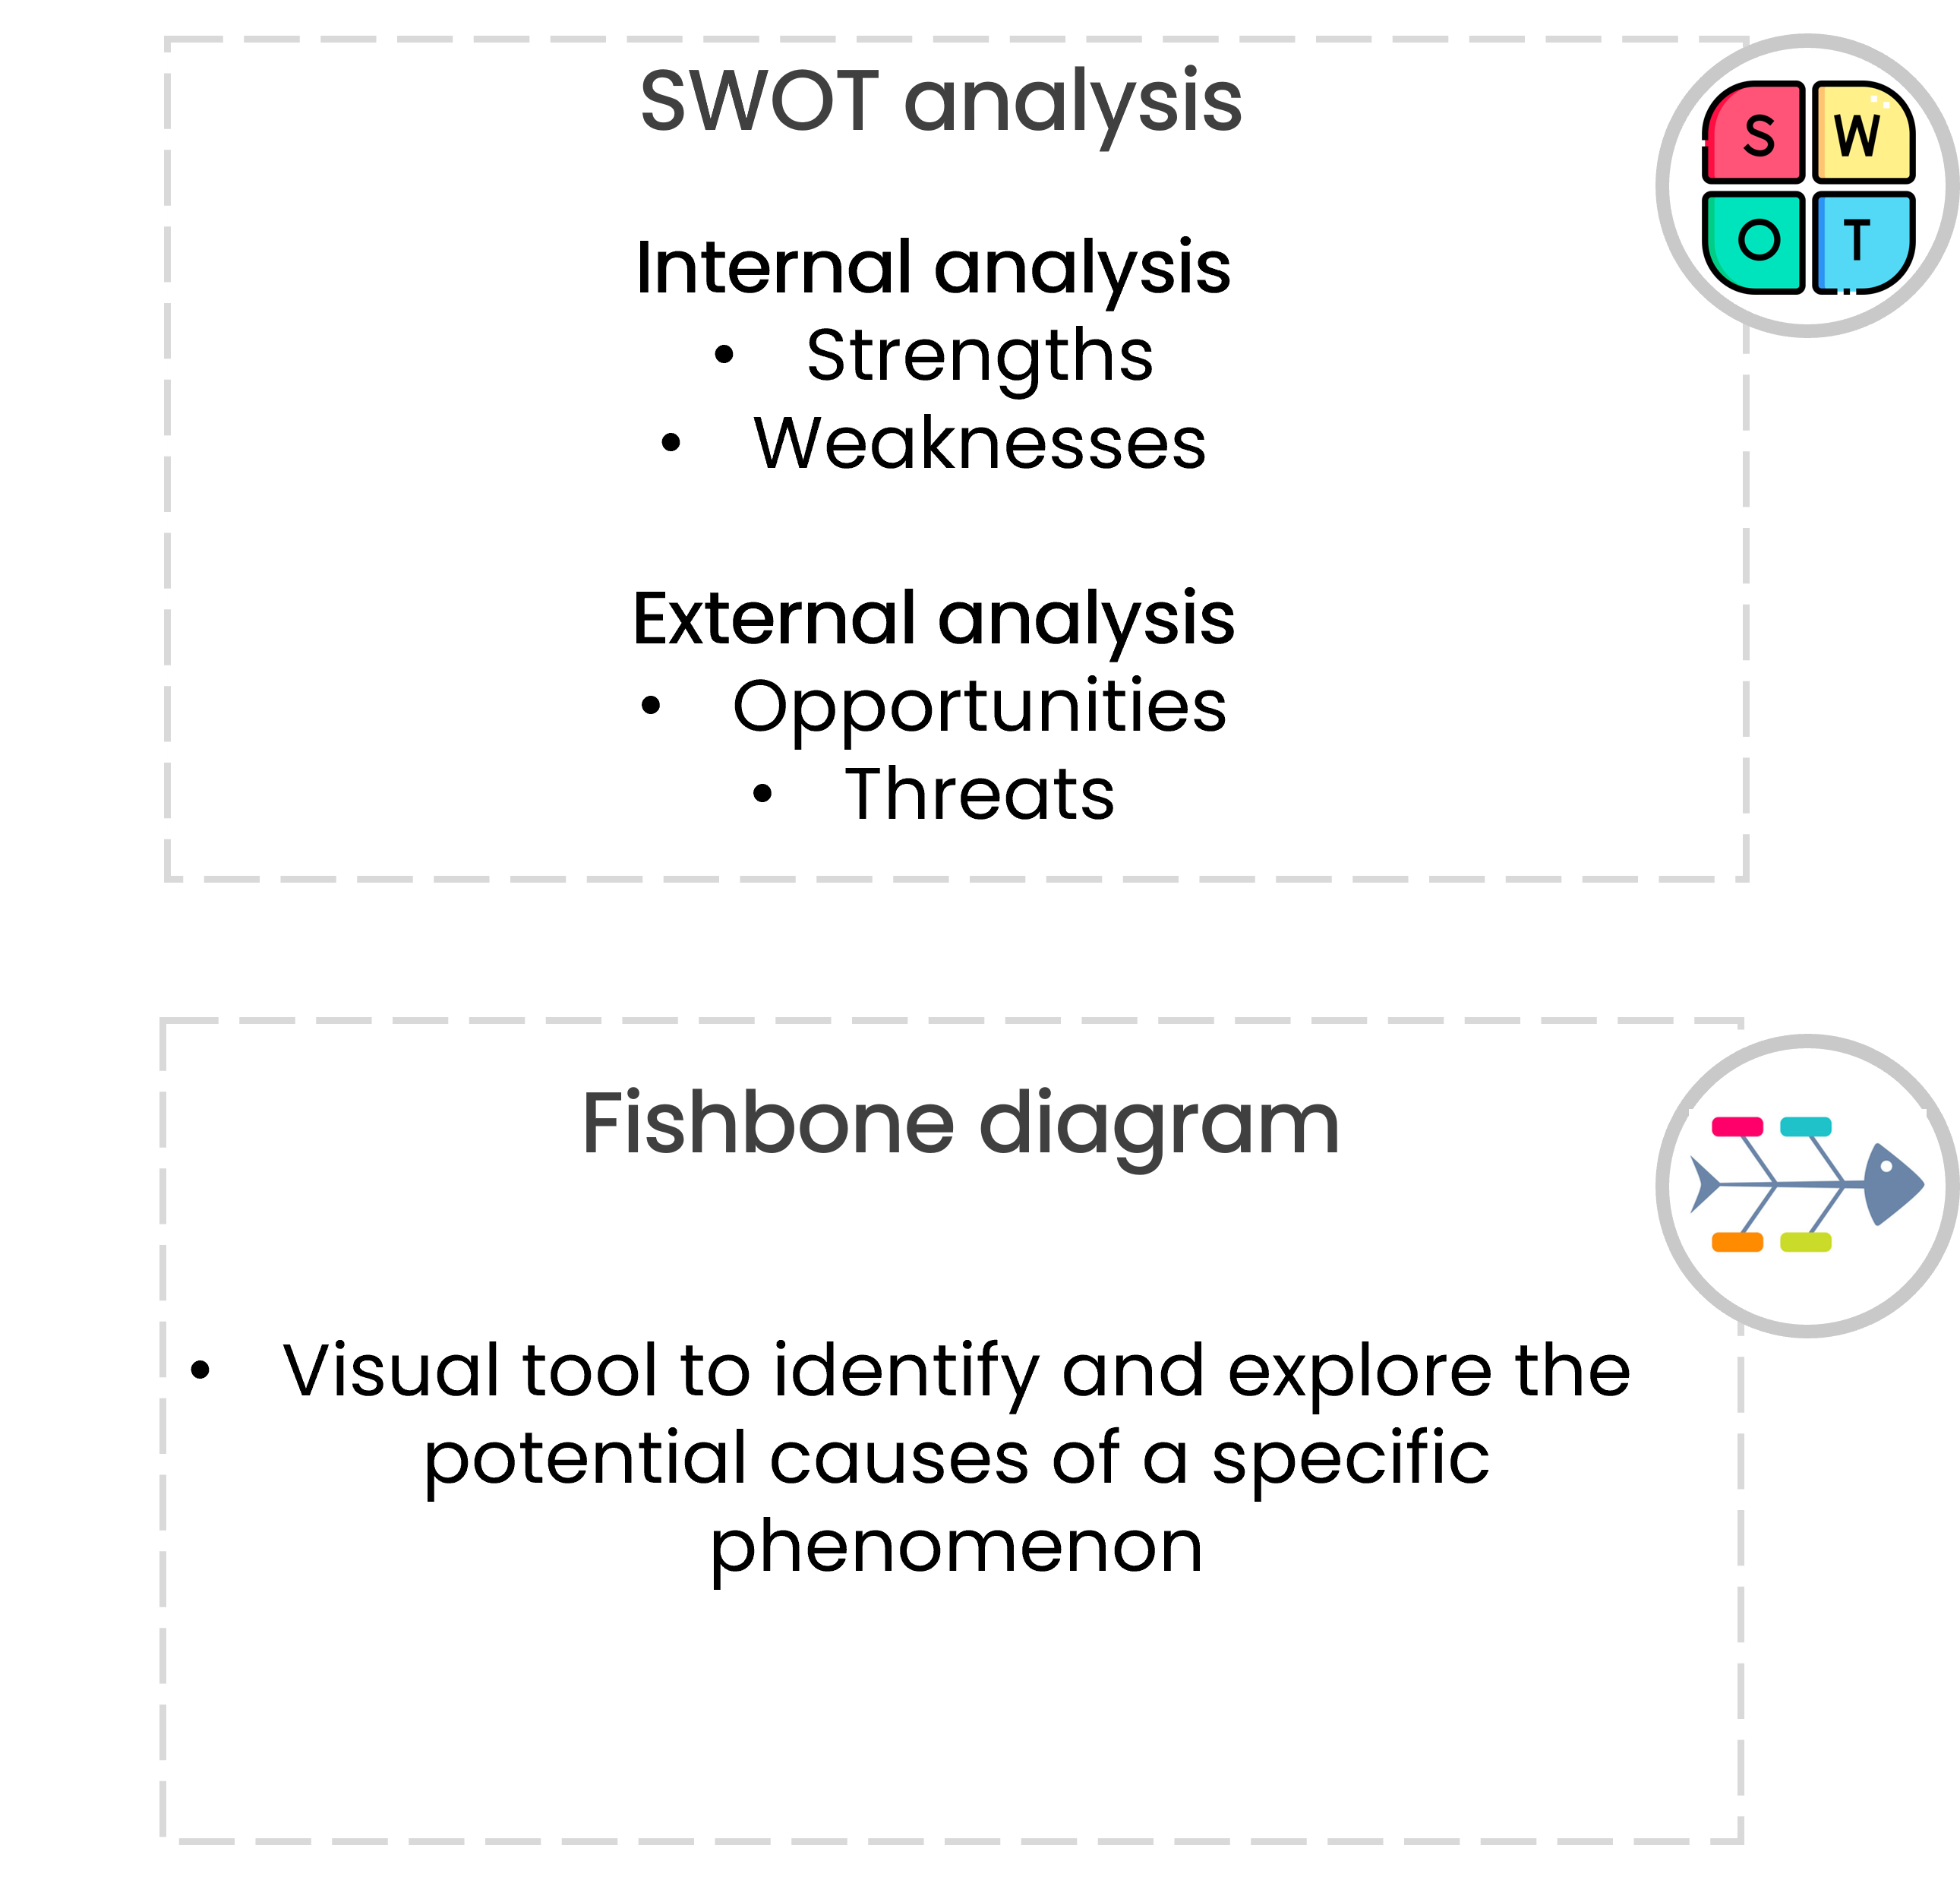
Text "SWOT Analysis" with sections for "Internal Analysis" listing "Strengths" and "Weaknesses," and "External Analysis" listing "Opportunities" and "Threats." To the right is an icon with the letters S, W, O, and T in colored quadrants.

An icon of a human head with a brain inside.

Decoding Decision Modeling

Qualitative analysis

Text "Fishbone Diagram" with a bullet point: "Visual tool to identify and explore the potential causes of a specific phenomenon." To the right is an icon of a fishbone diagram.

An icon of a human head with a brain inside.

Decoding Decision Modeling

Analysis tools

The use of tools increases efficiency, accuracy, and scalability in handling data and conducting investigations during an analysis.

Text "Spreadsheets" at the bottom. Above are icons for Excel and Google Sheets.

Decoding Decision Modeling

Analysis tools

The use of tools increases efficiency, accuracy, and scalability in handling data and conducting investigations during an analysis.

Text "Statistical languages" at the bottom. Above are icons for MATLAB, R, and Python.

Decoding Decision Modeling

Analysis tools

The use of tools increases efficiency, accuracy, and scalability in handling data and conducting investigations during an analysis.
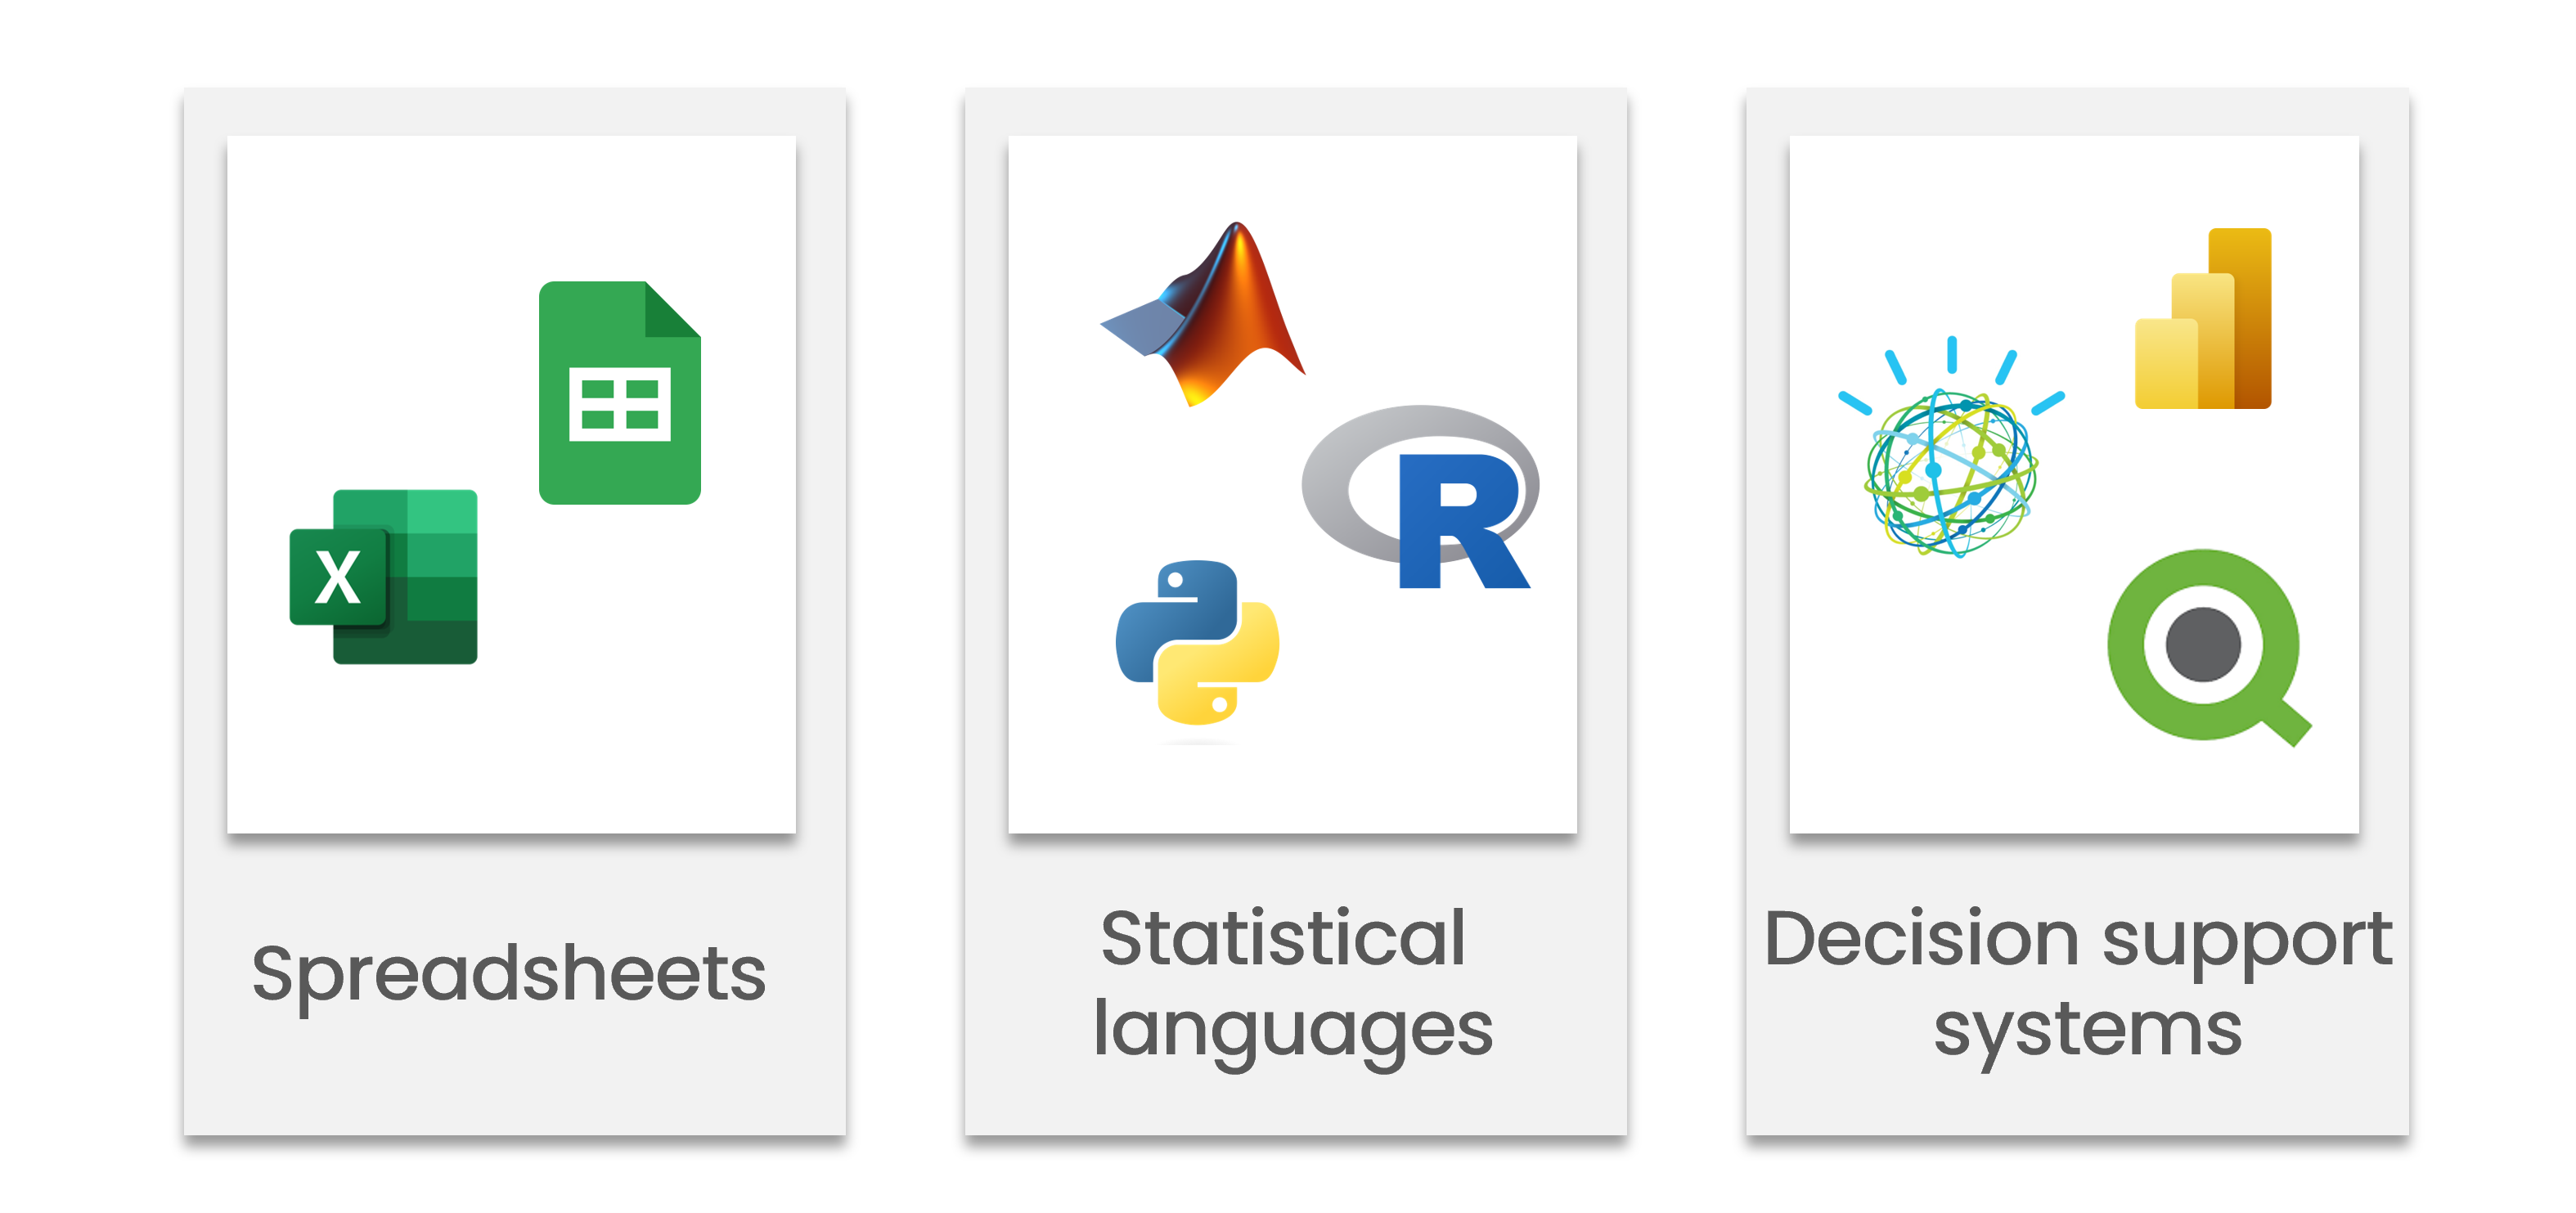
Text "Decision support systems" at the bottom. Above are icons for IBM Watson, Power BI, and Qlik.

Decoding Decision Modeling

Let's practice!

Decoding Decision Modeling

Preparing Video For Download...