Data analytics for Decision Models
Decoding Decision Modeling

Tiago Brasil
Lead Data Engineer
Informed decisions, better outcomes
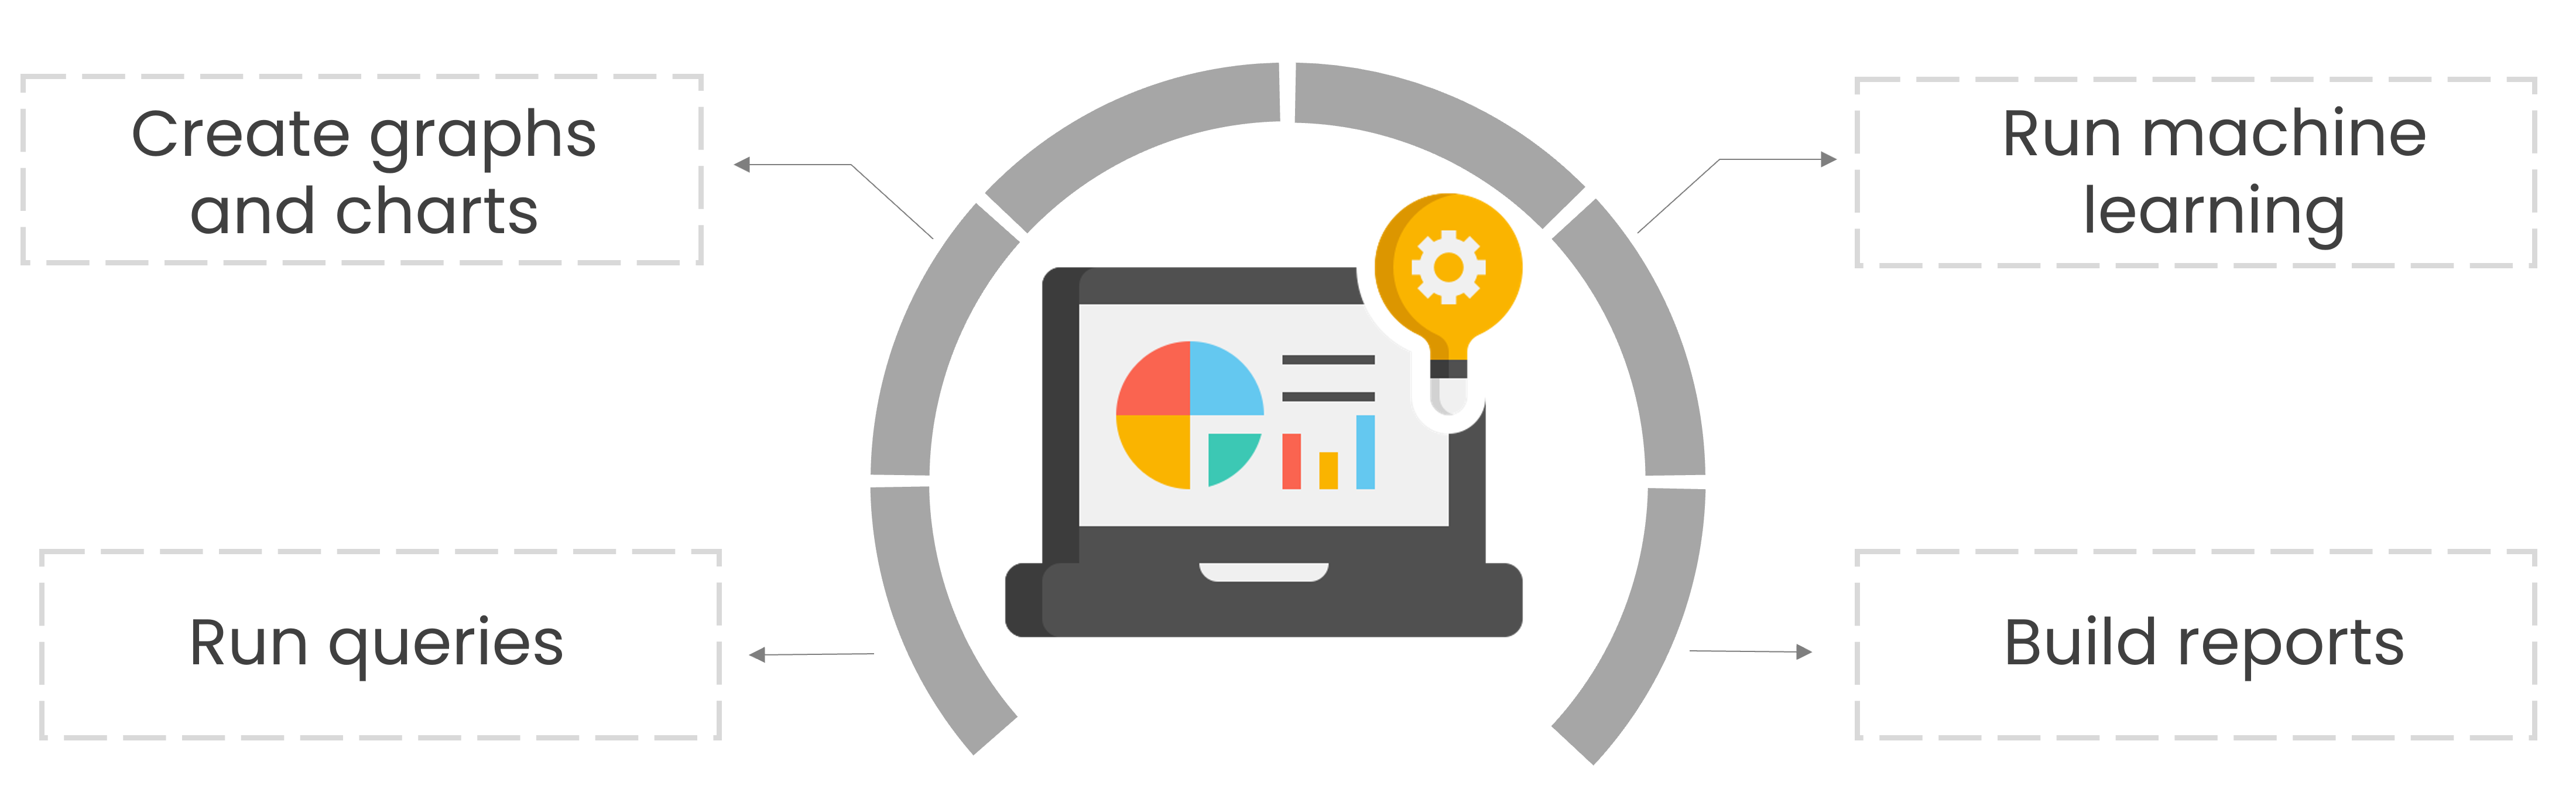
Data analytics involves collecting, transforming, and analyzing data to extract valuable information that can be used to make better decisions.
Navigating the data journey
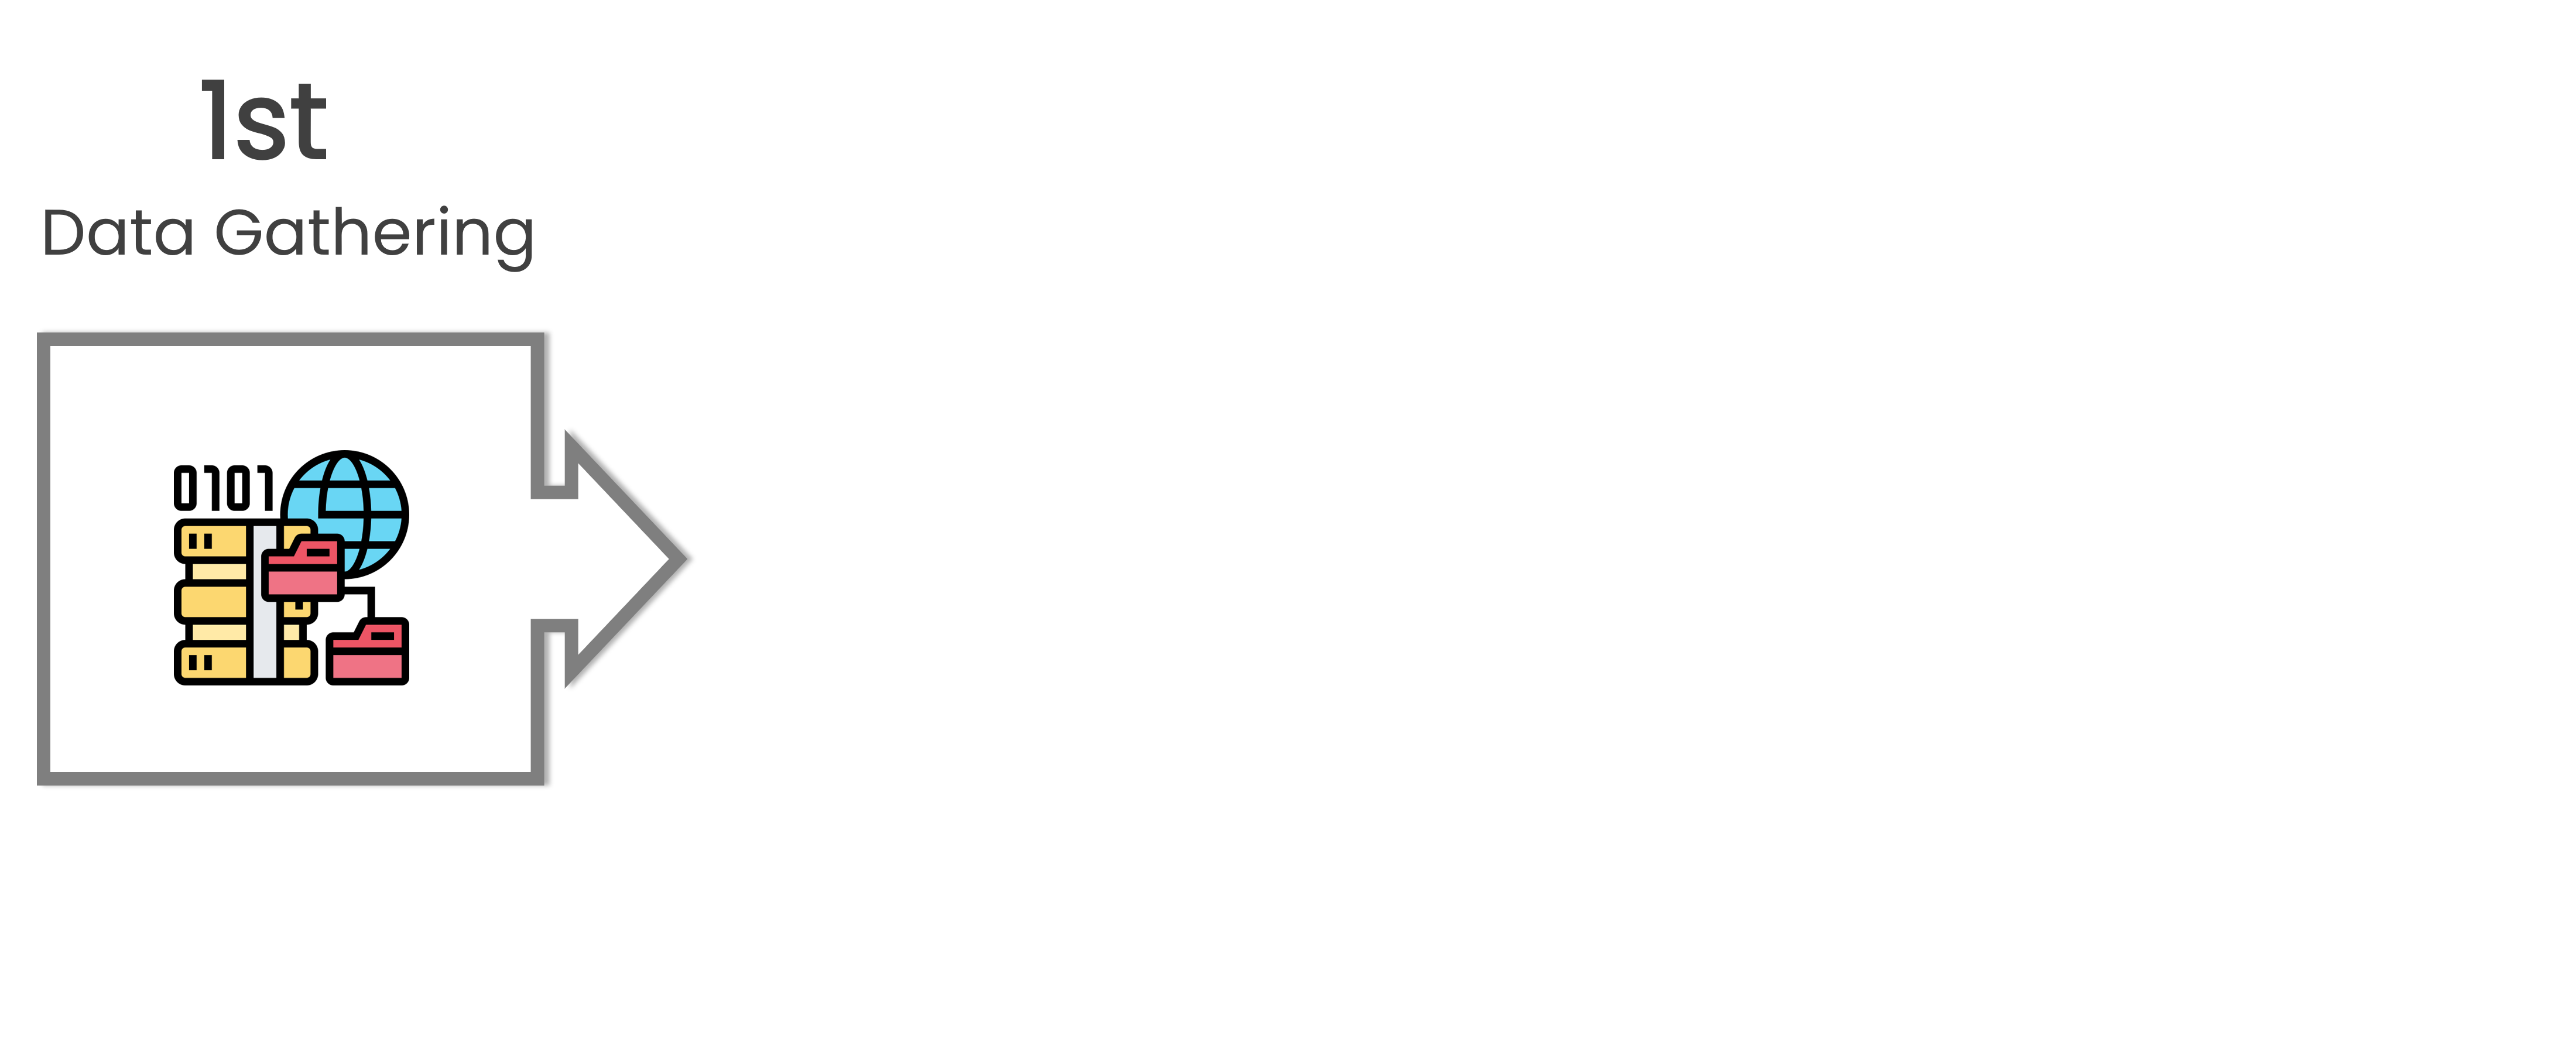
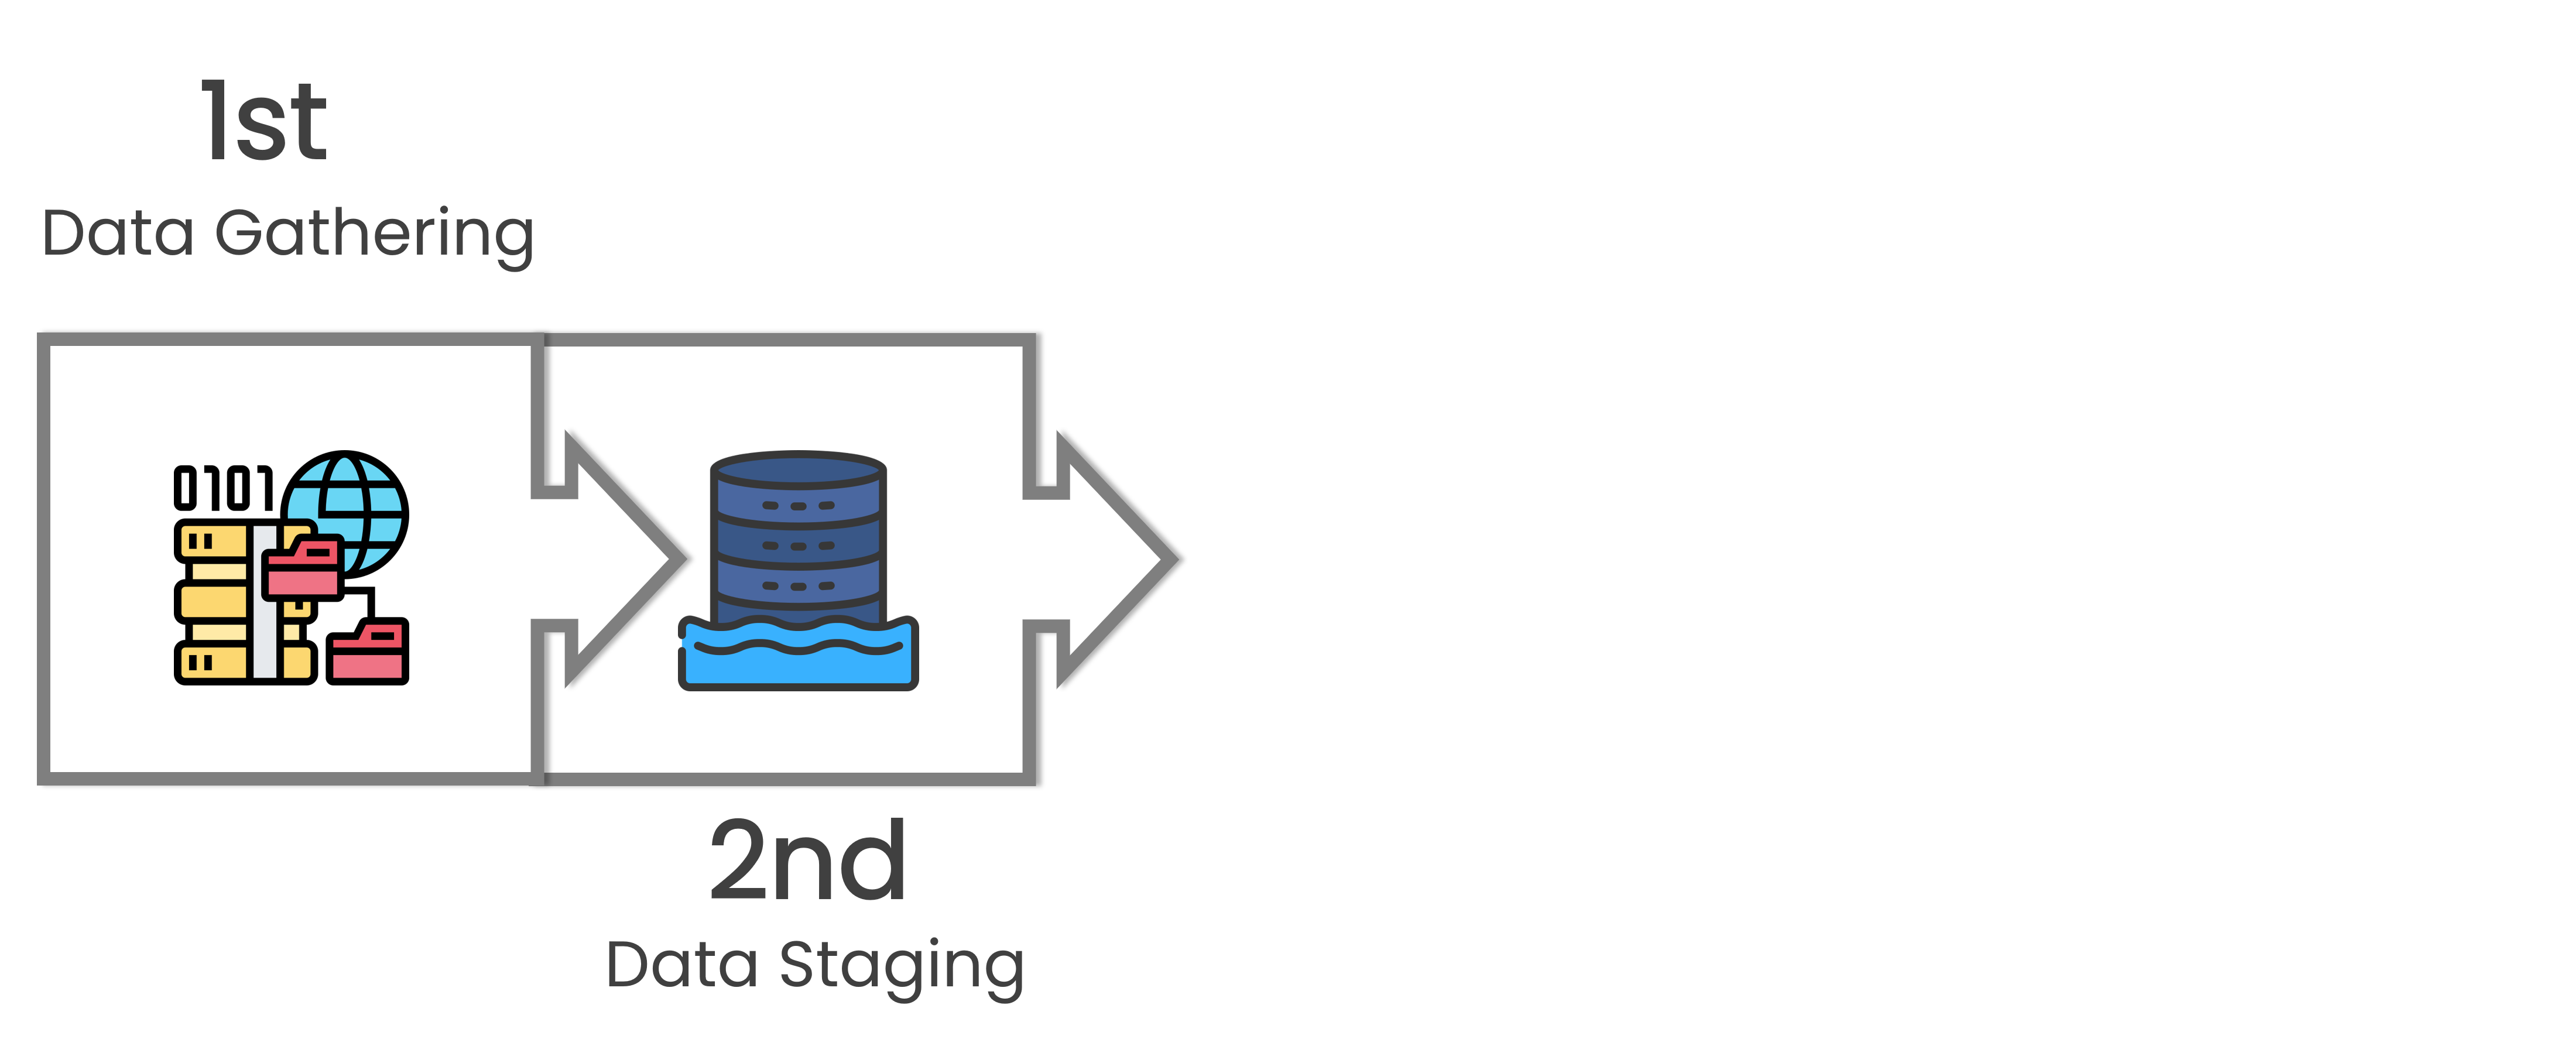
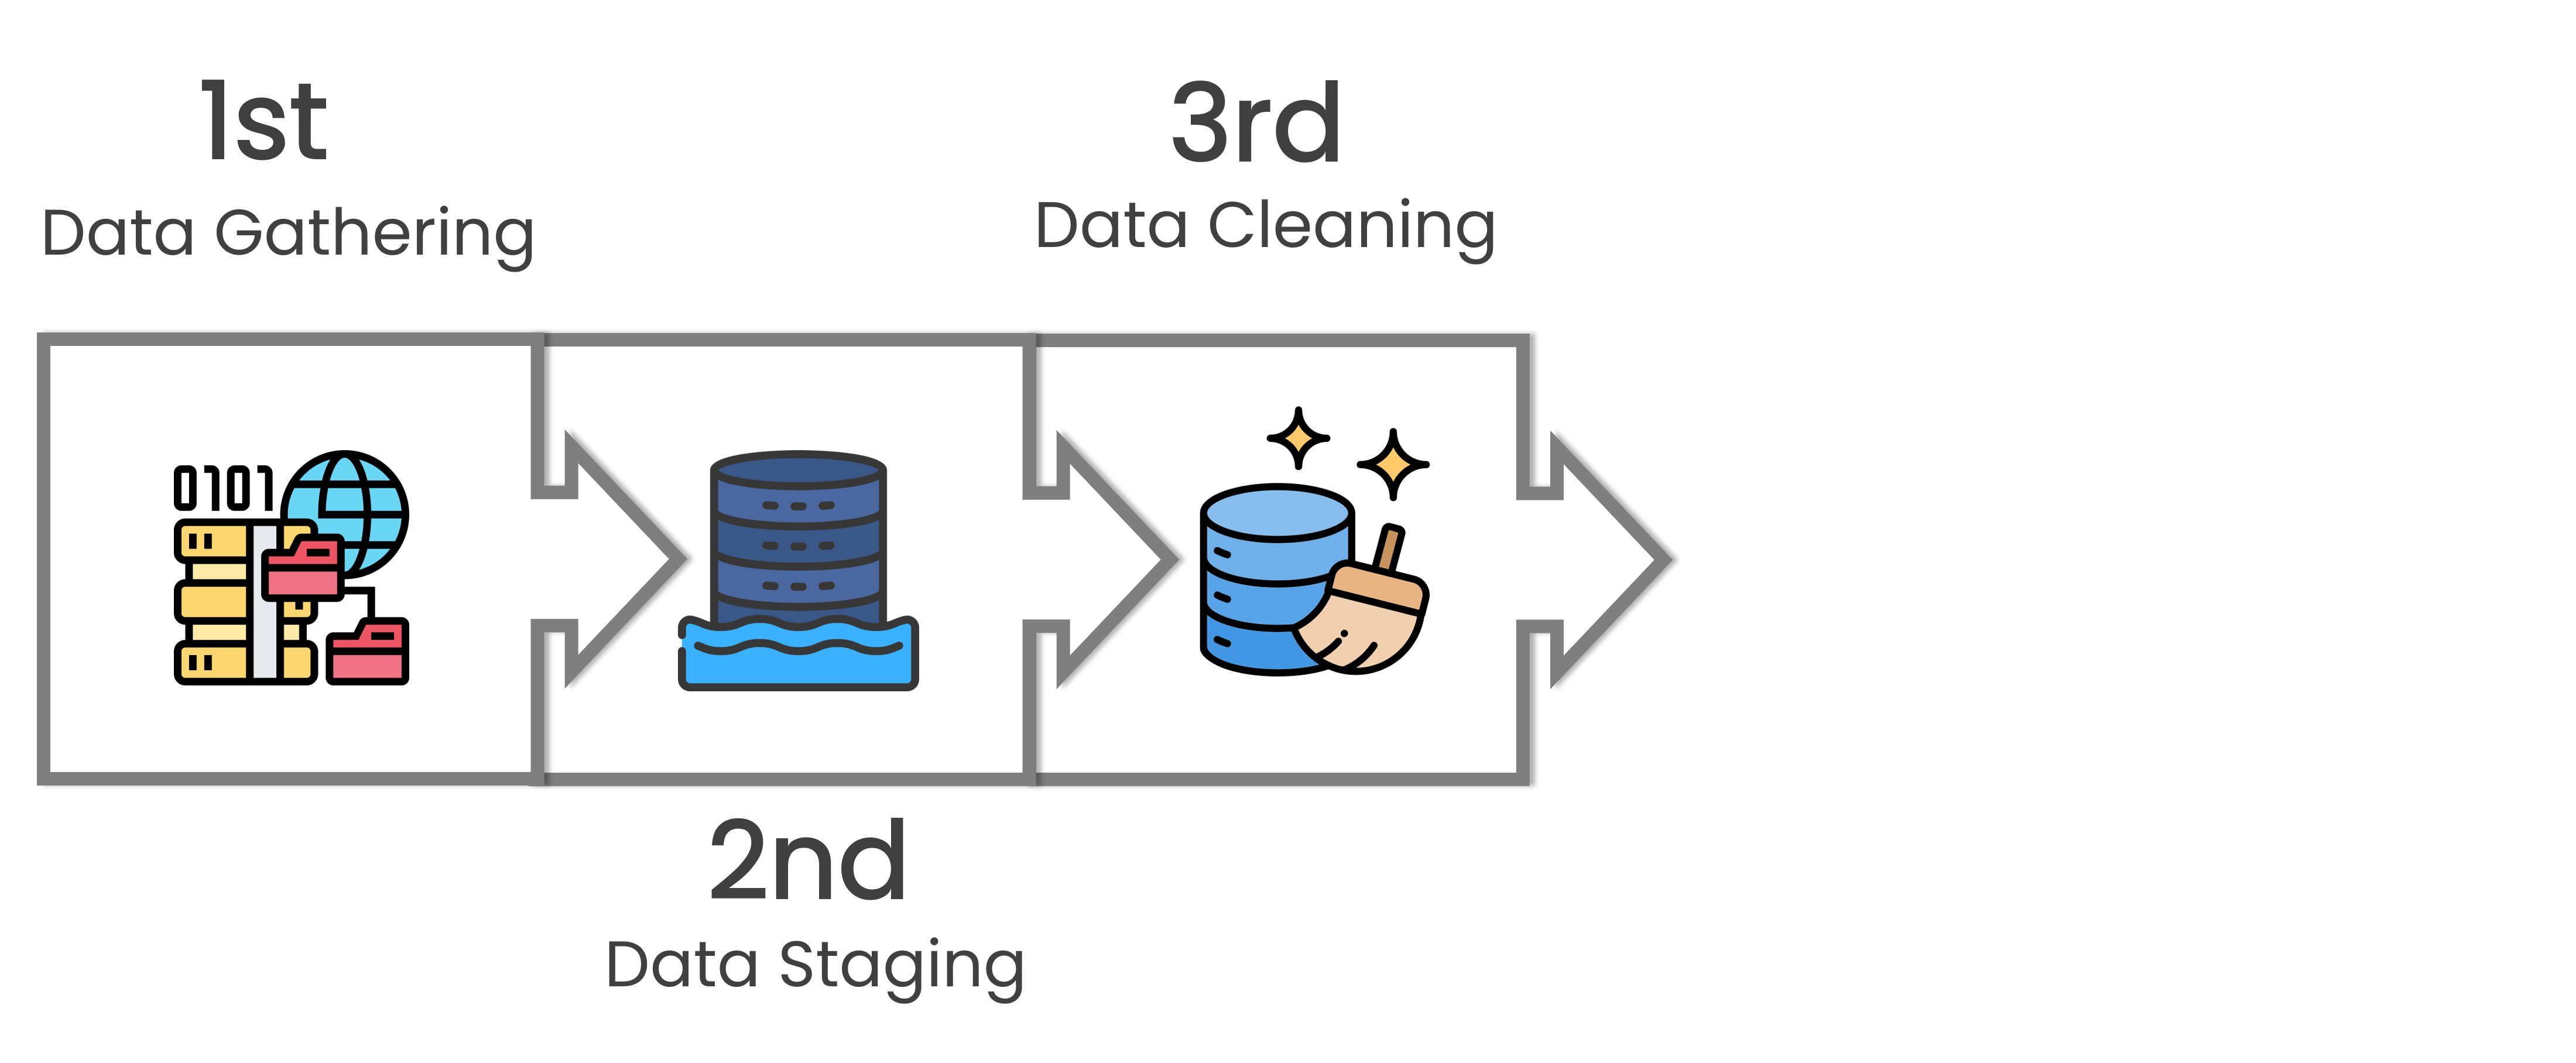
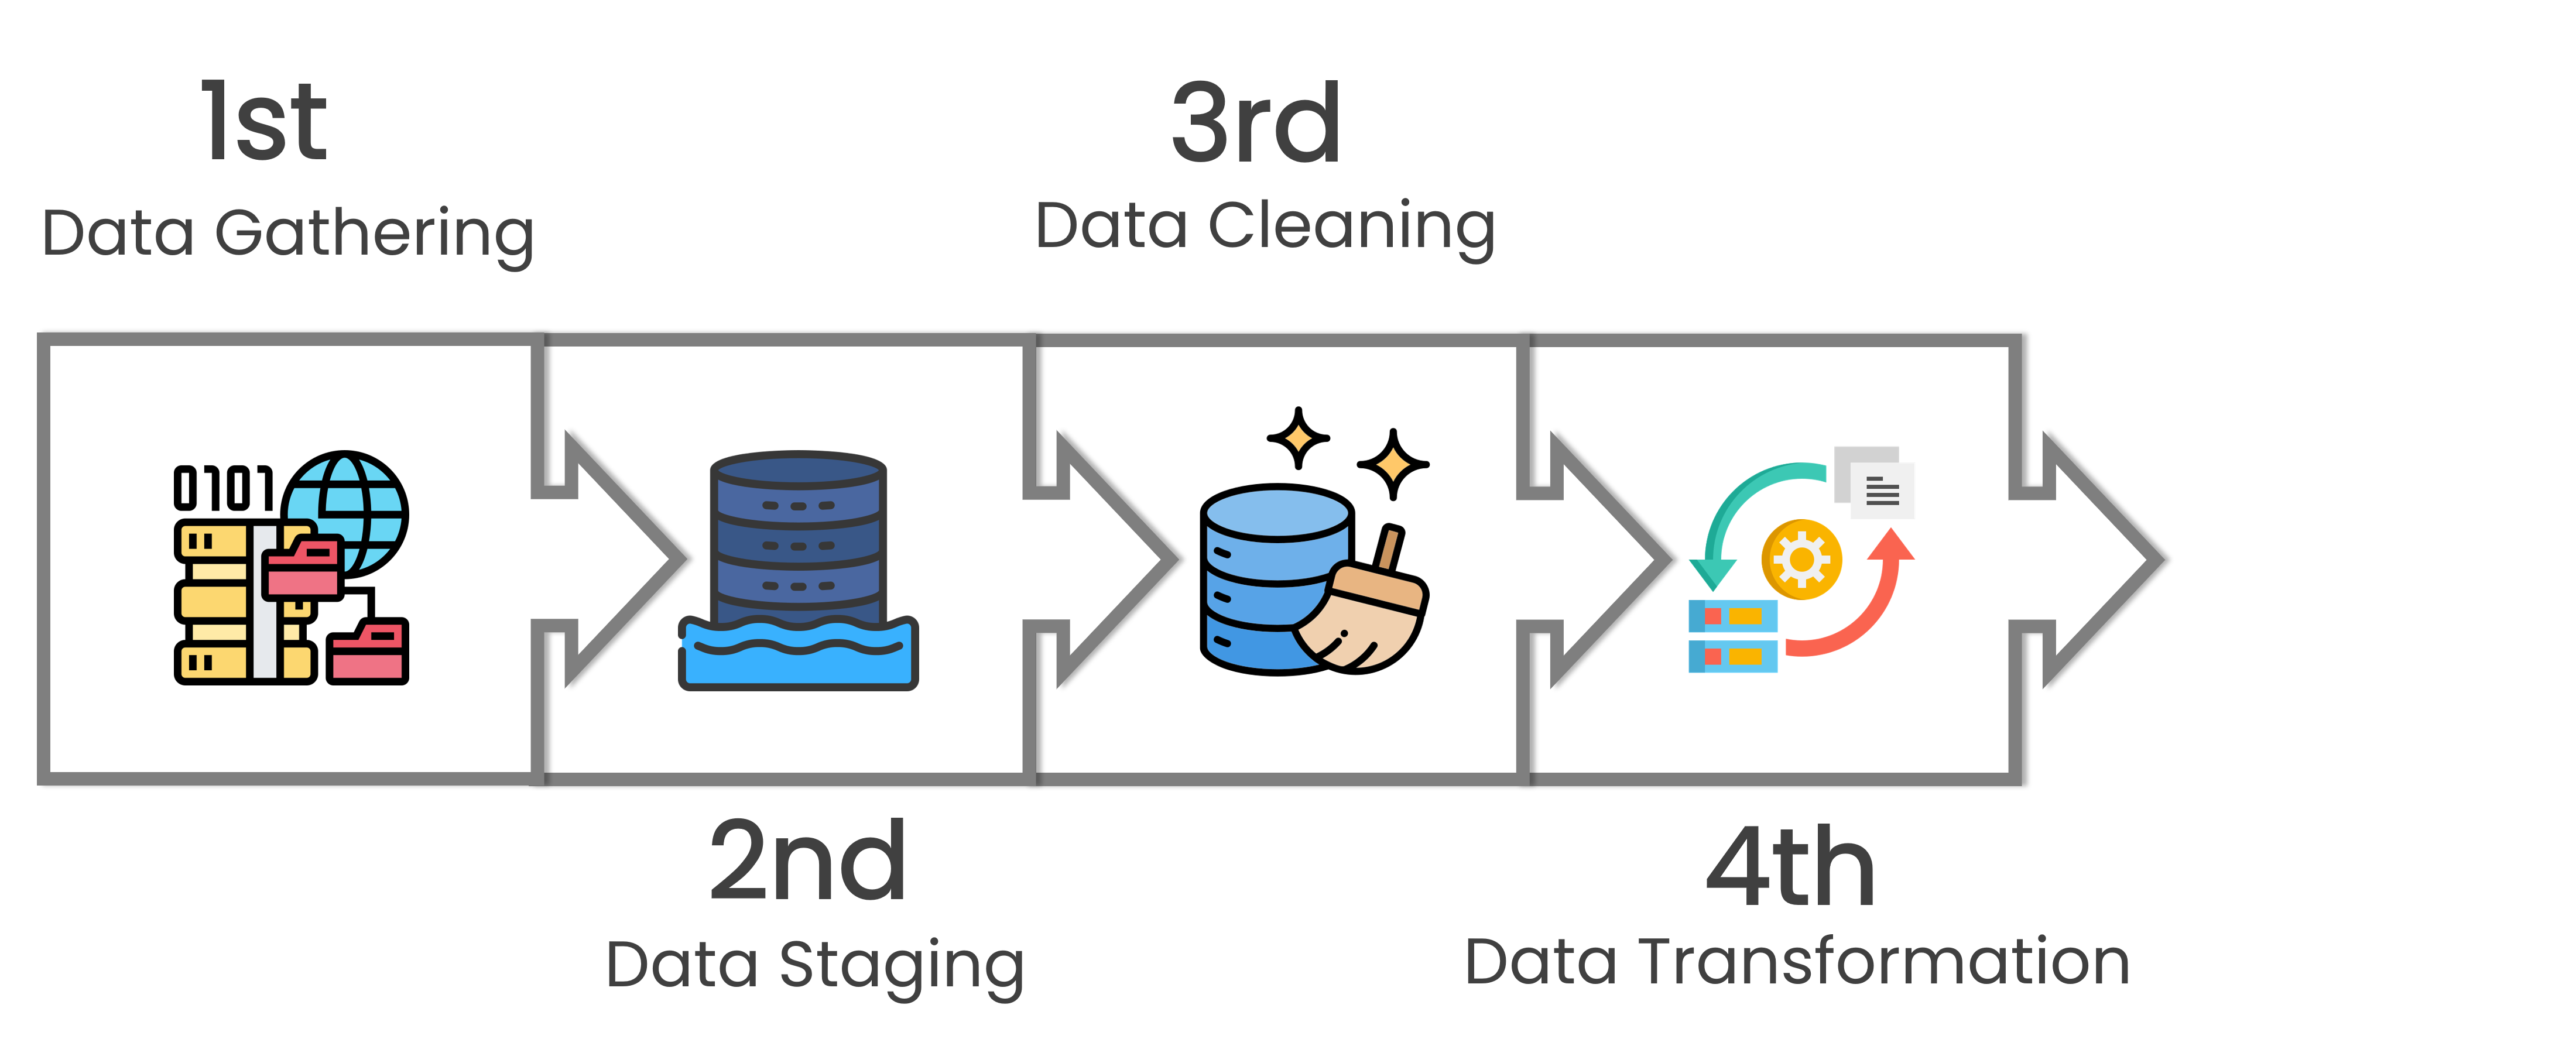
Data requires a comprehensive journey of analysis and processing to transform into valuable, actionable information.
Navigating the data journey
Data requires a comprehensive journey of analysis and processing to transform into valuable, actionable information.
Navigating the data journey
Data requires a comprehensive journey of analysis and processing to transform into valuable, actionable information.
Navigating the data journey
Data requires a comprehensive journey of analysis and processing to transform into valuable, actionable information.
Navigating the data journey
Data requires a comprehensive journey of analysis and processing to transform into valuable, actionable information.
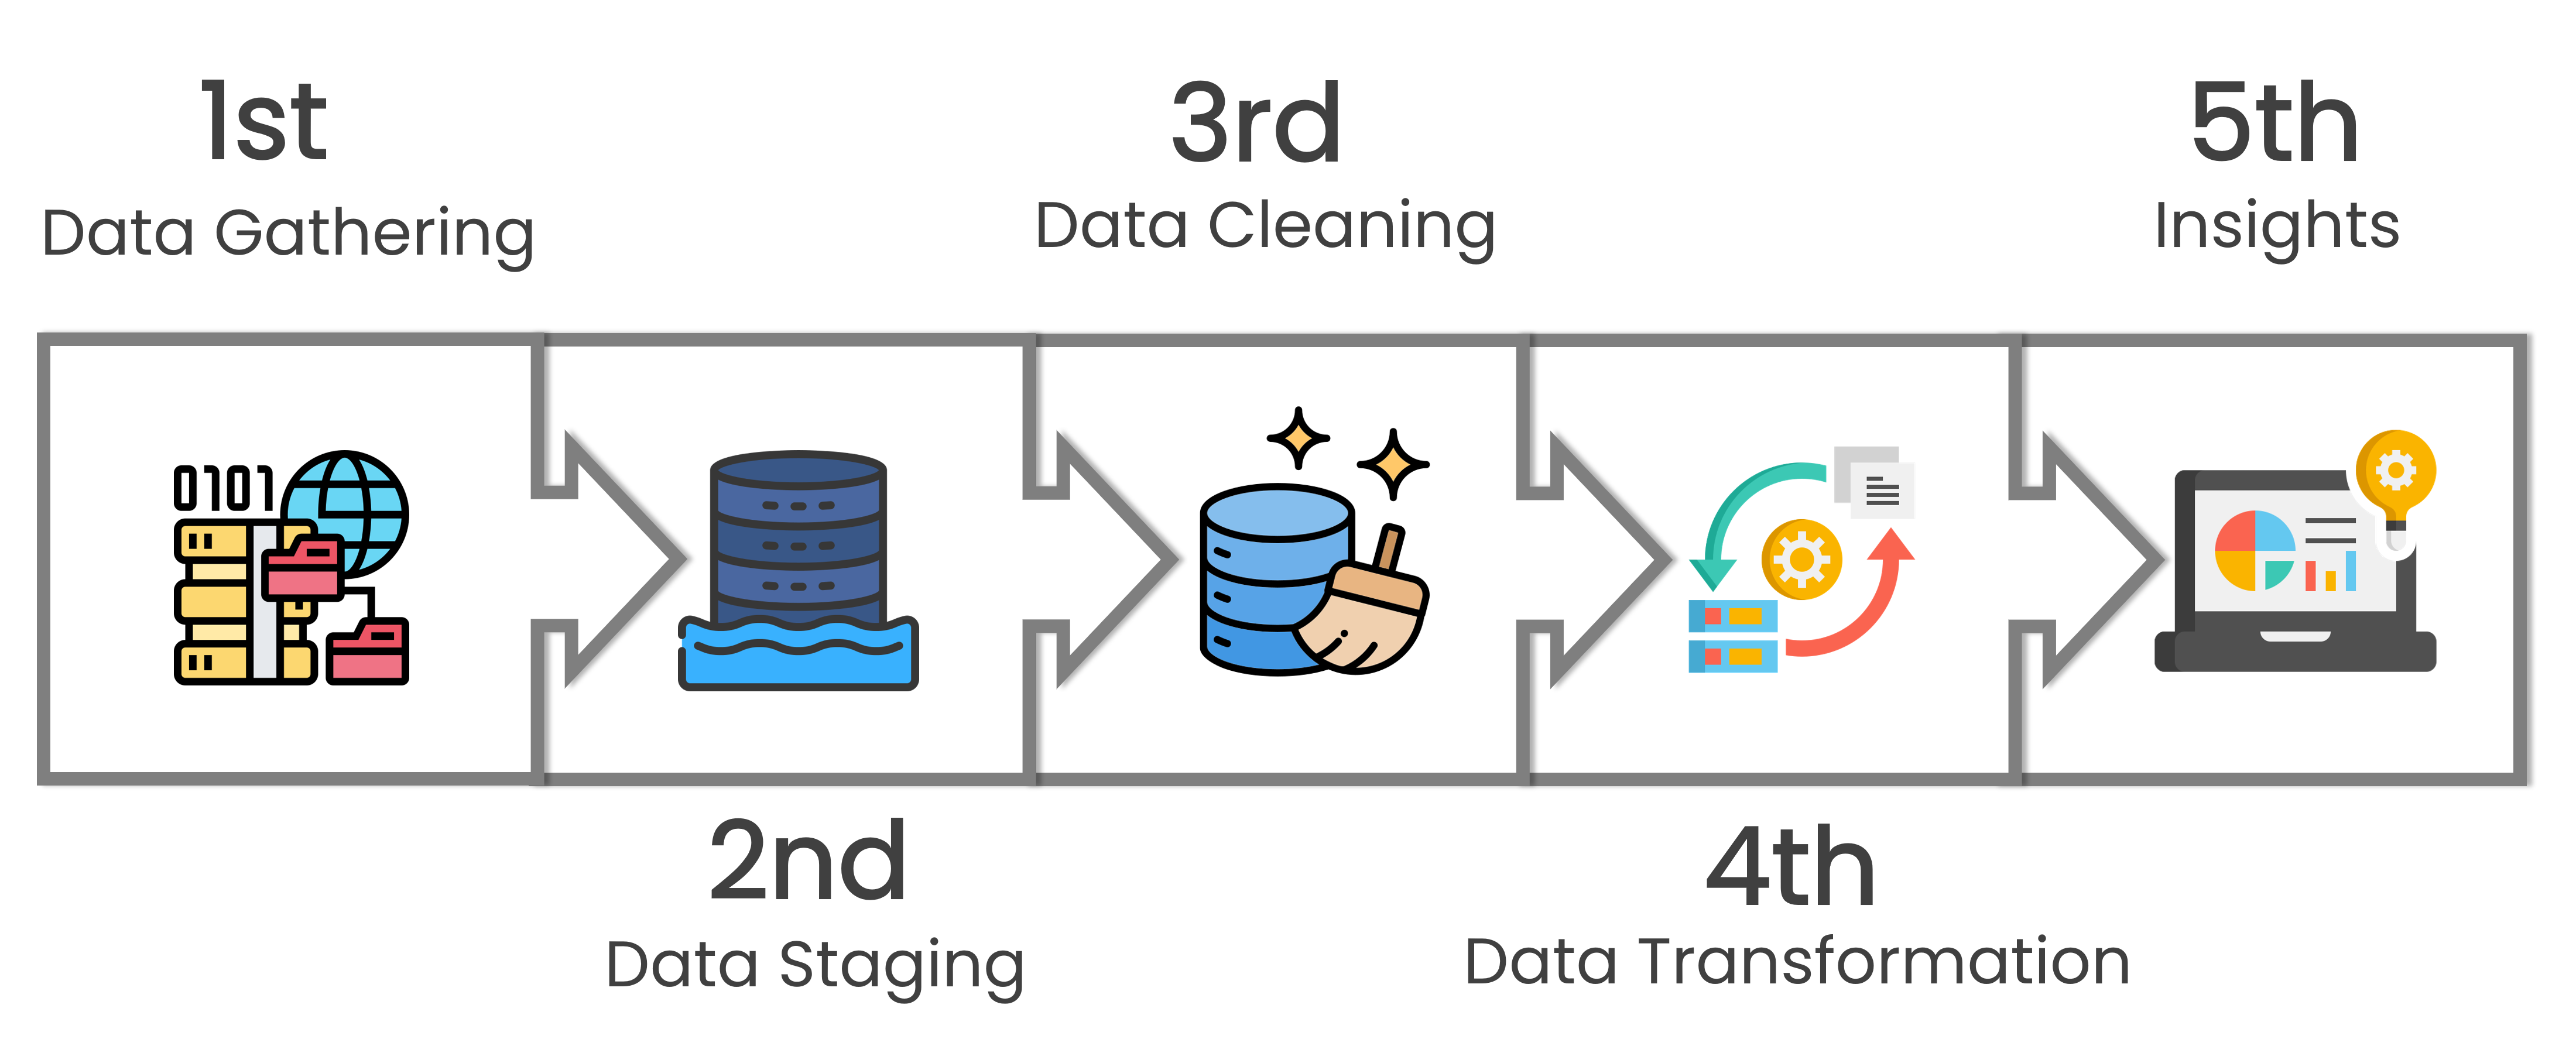
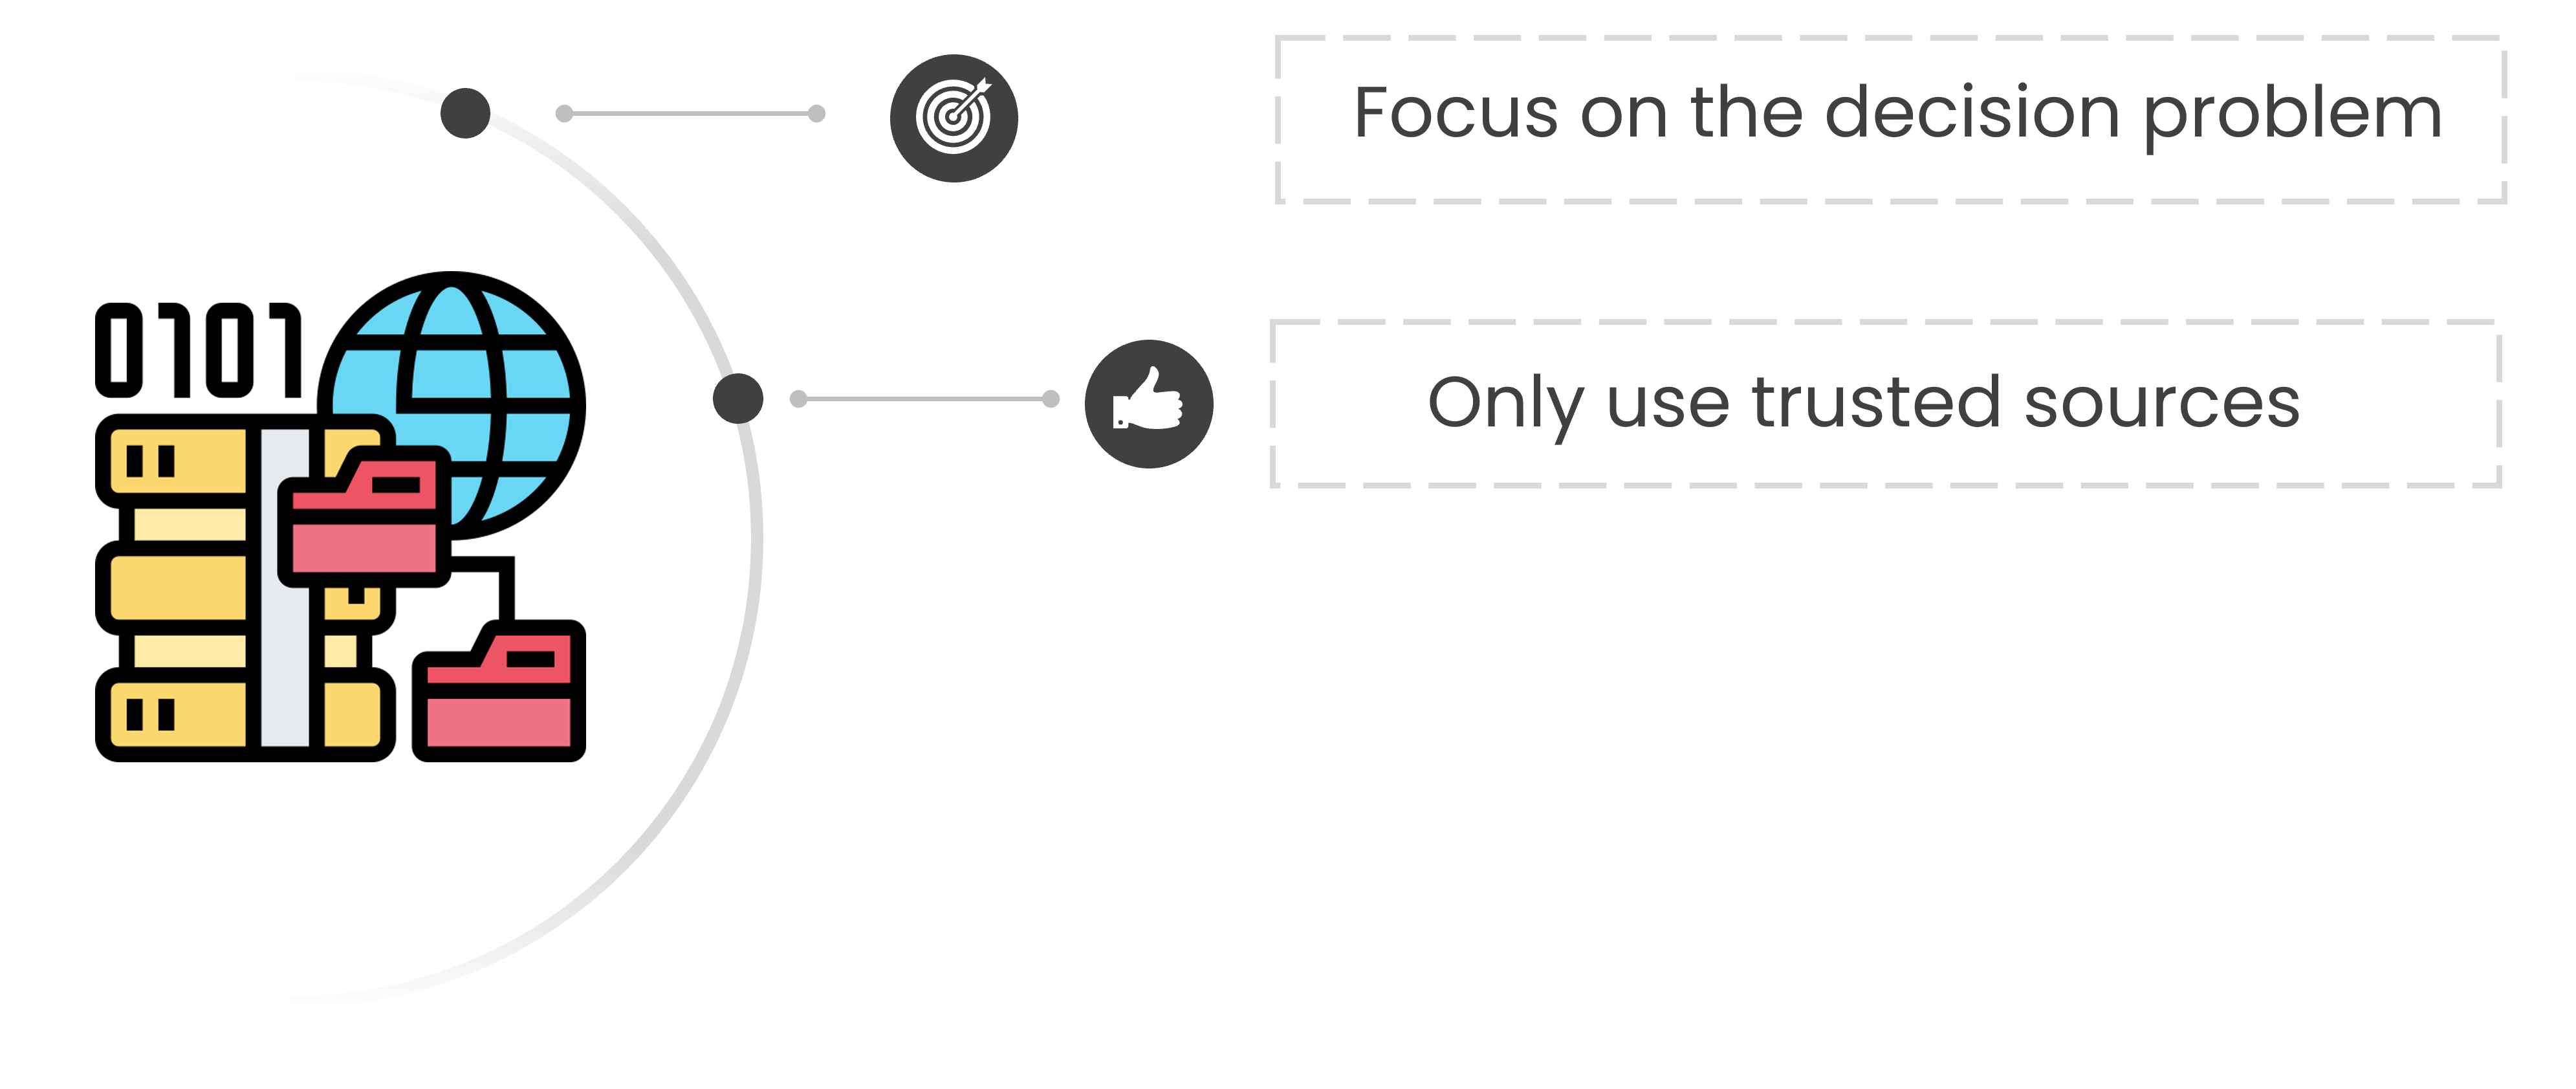
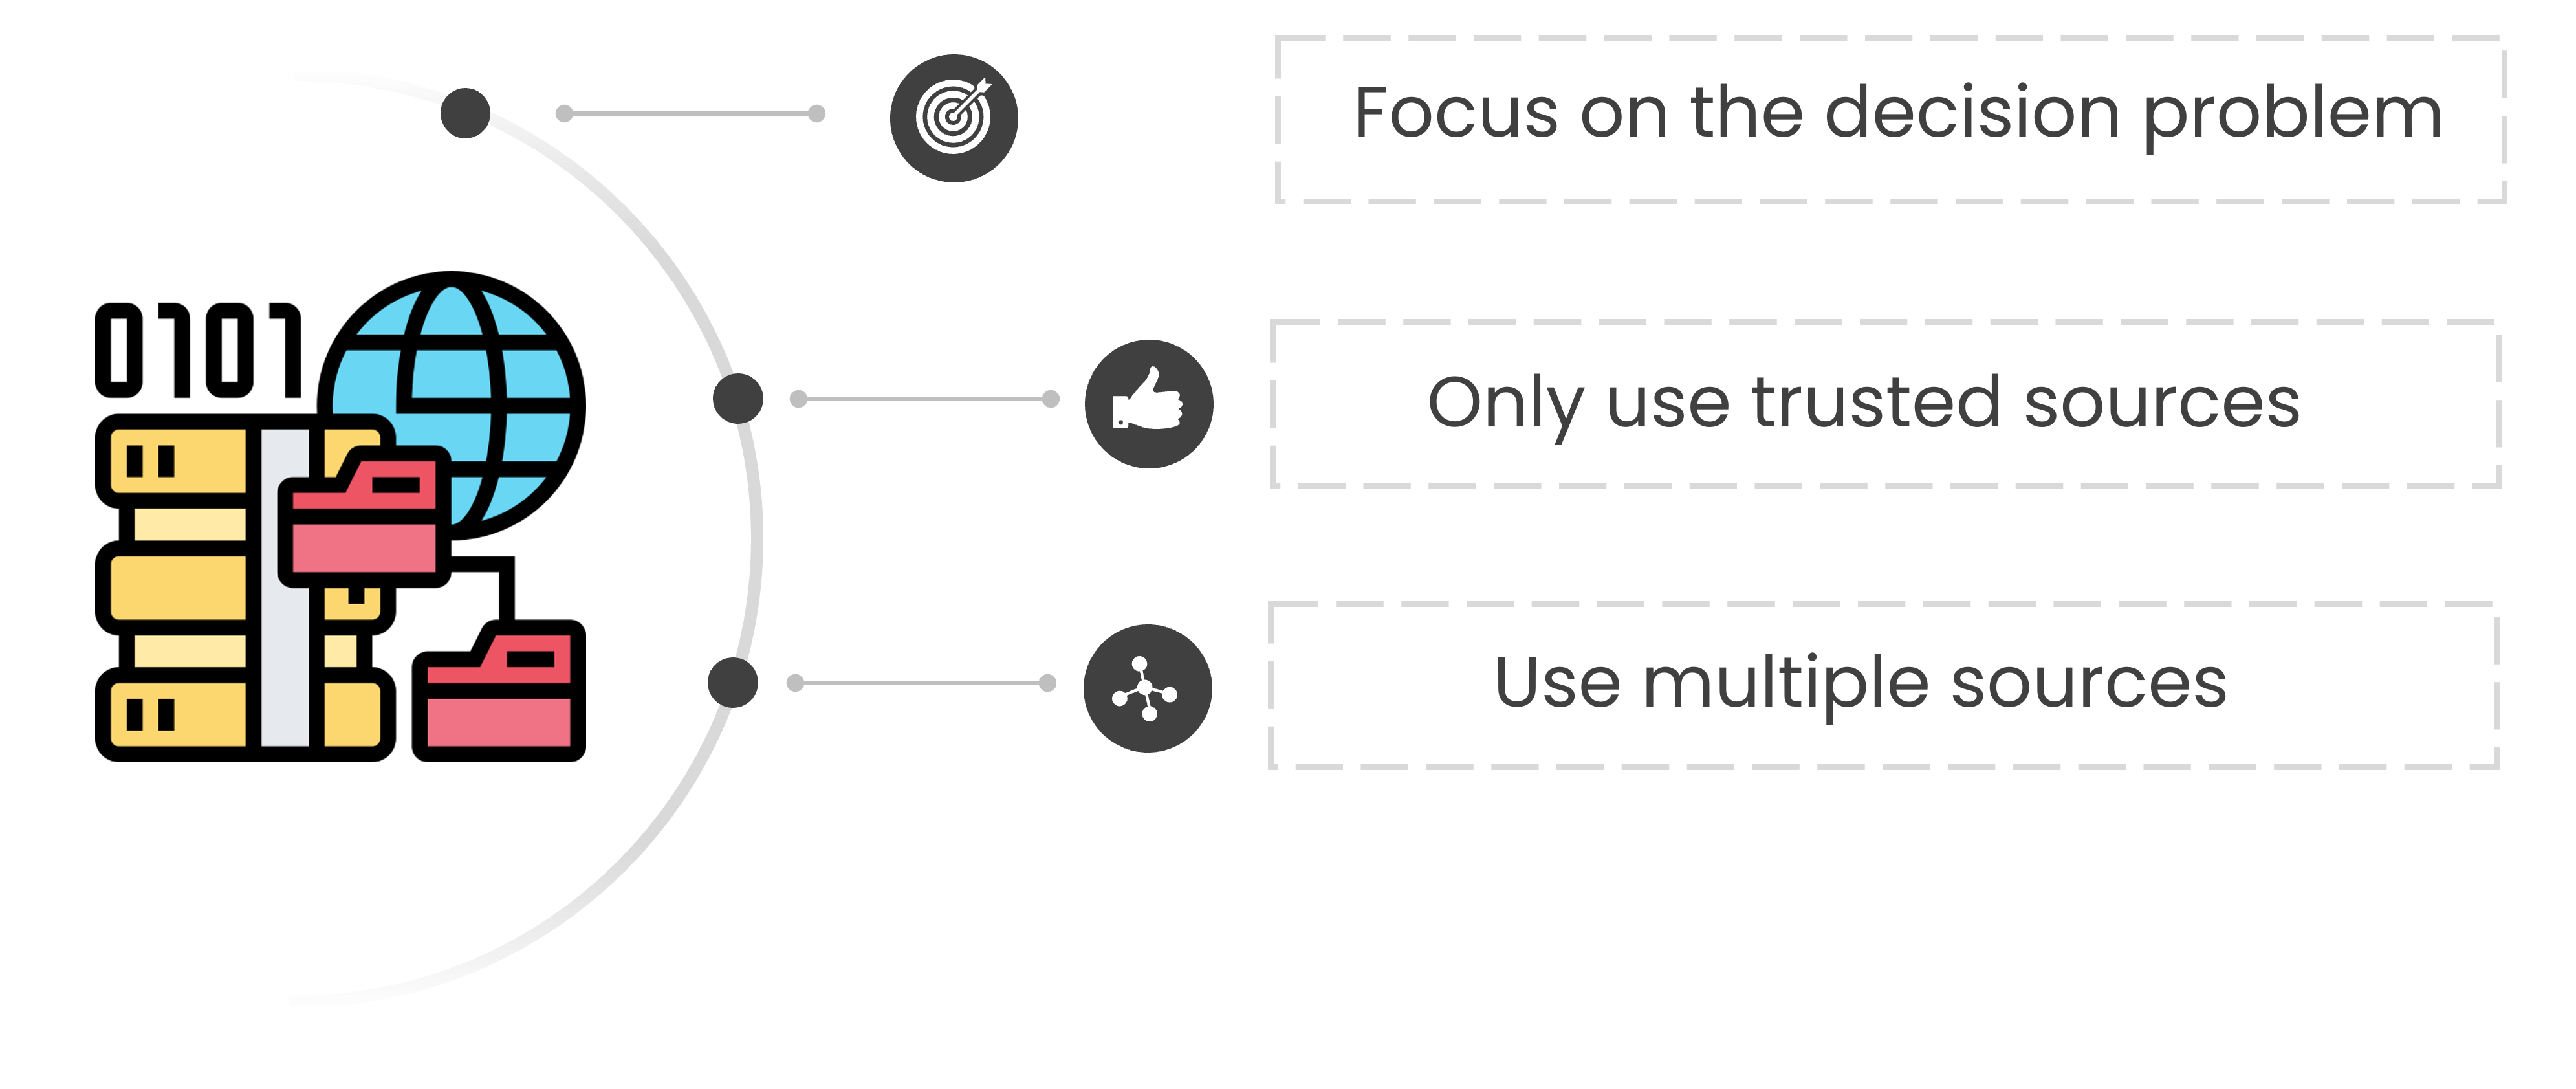
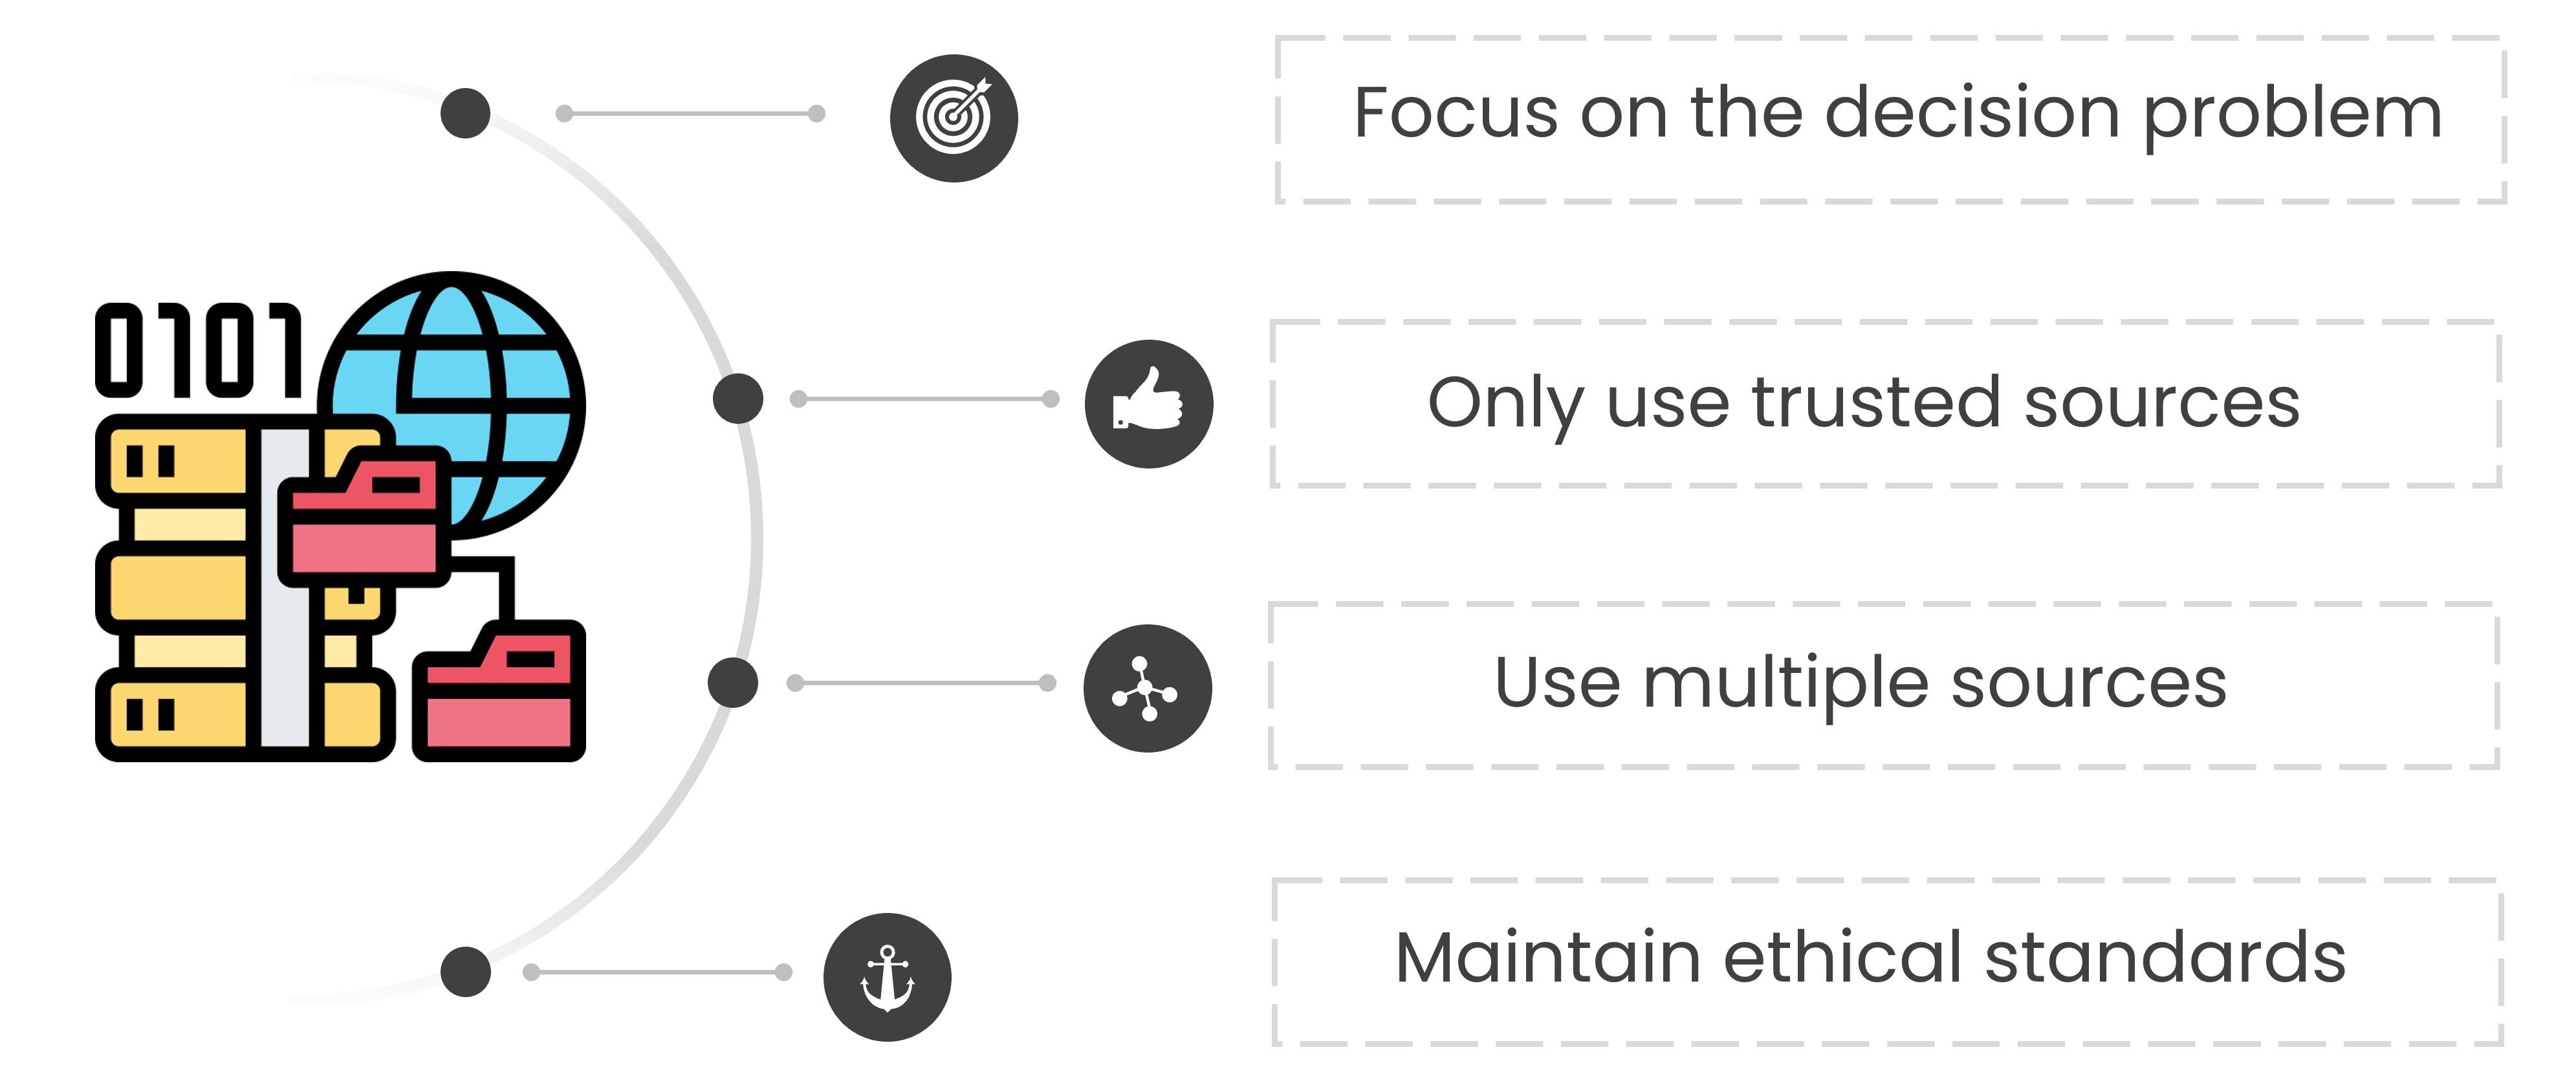
Data gathering
Identify and collect relevant data from multiple trusted sources.

Data gathering
Identify and collect relevant data from multiple trusted sources.
Data gathering
Identify and collect relevant data from multiple trusted sources.
Data gathering
Identify and collect relevant data from multiple trusted sources.
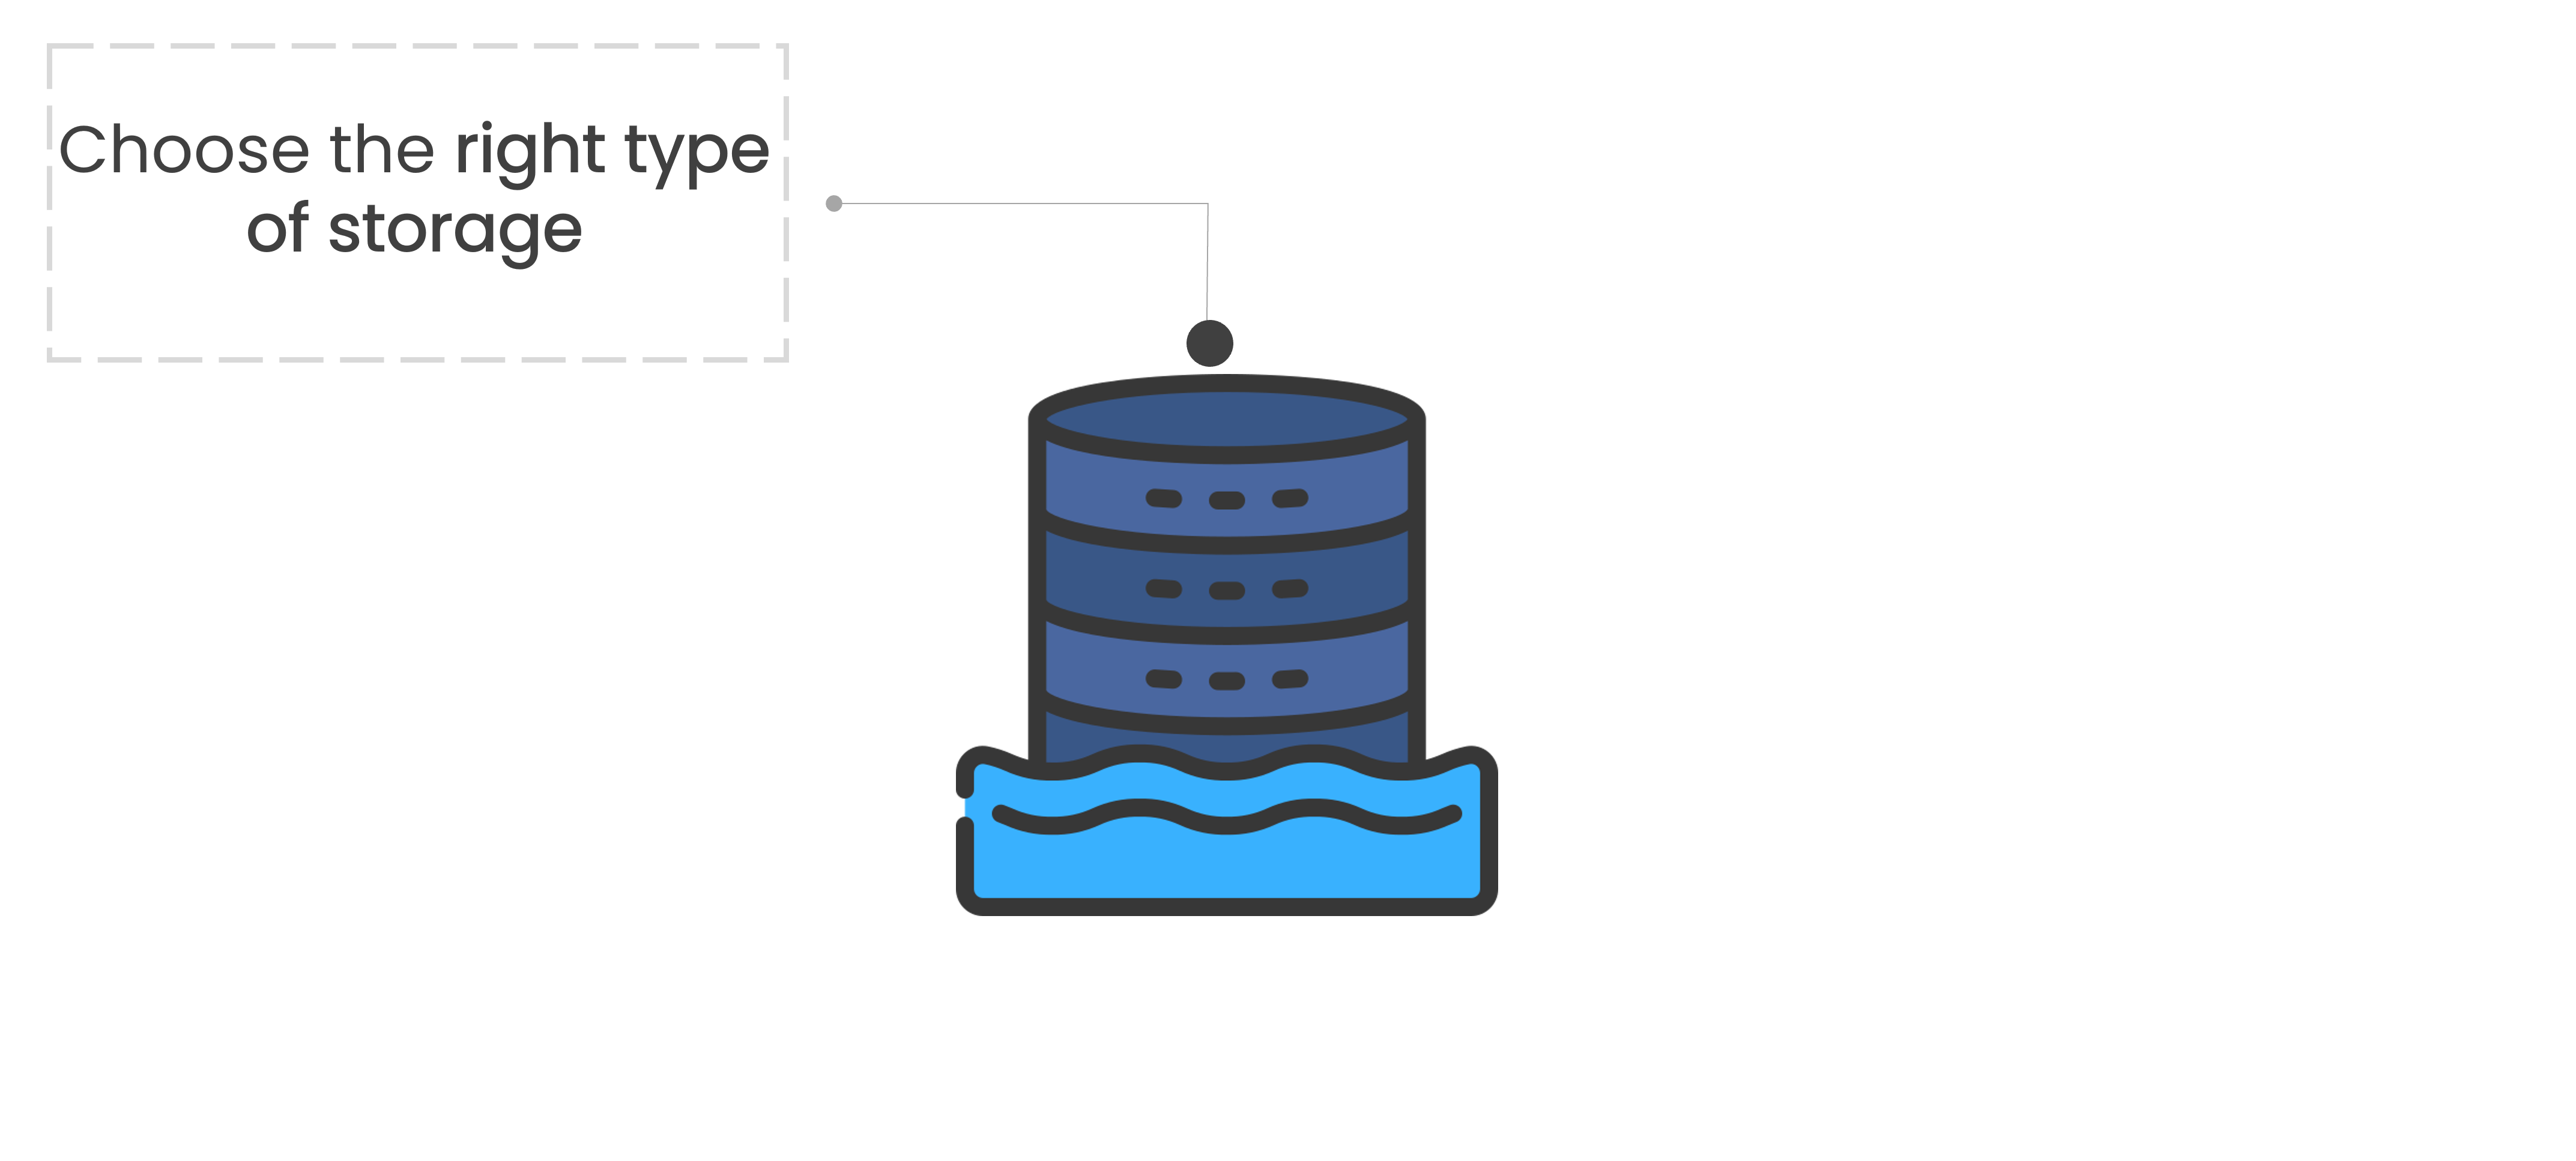
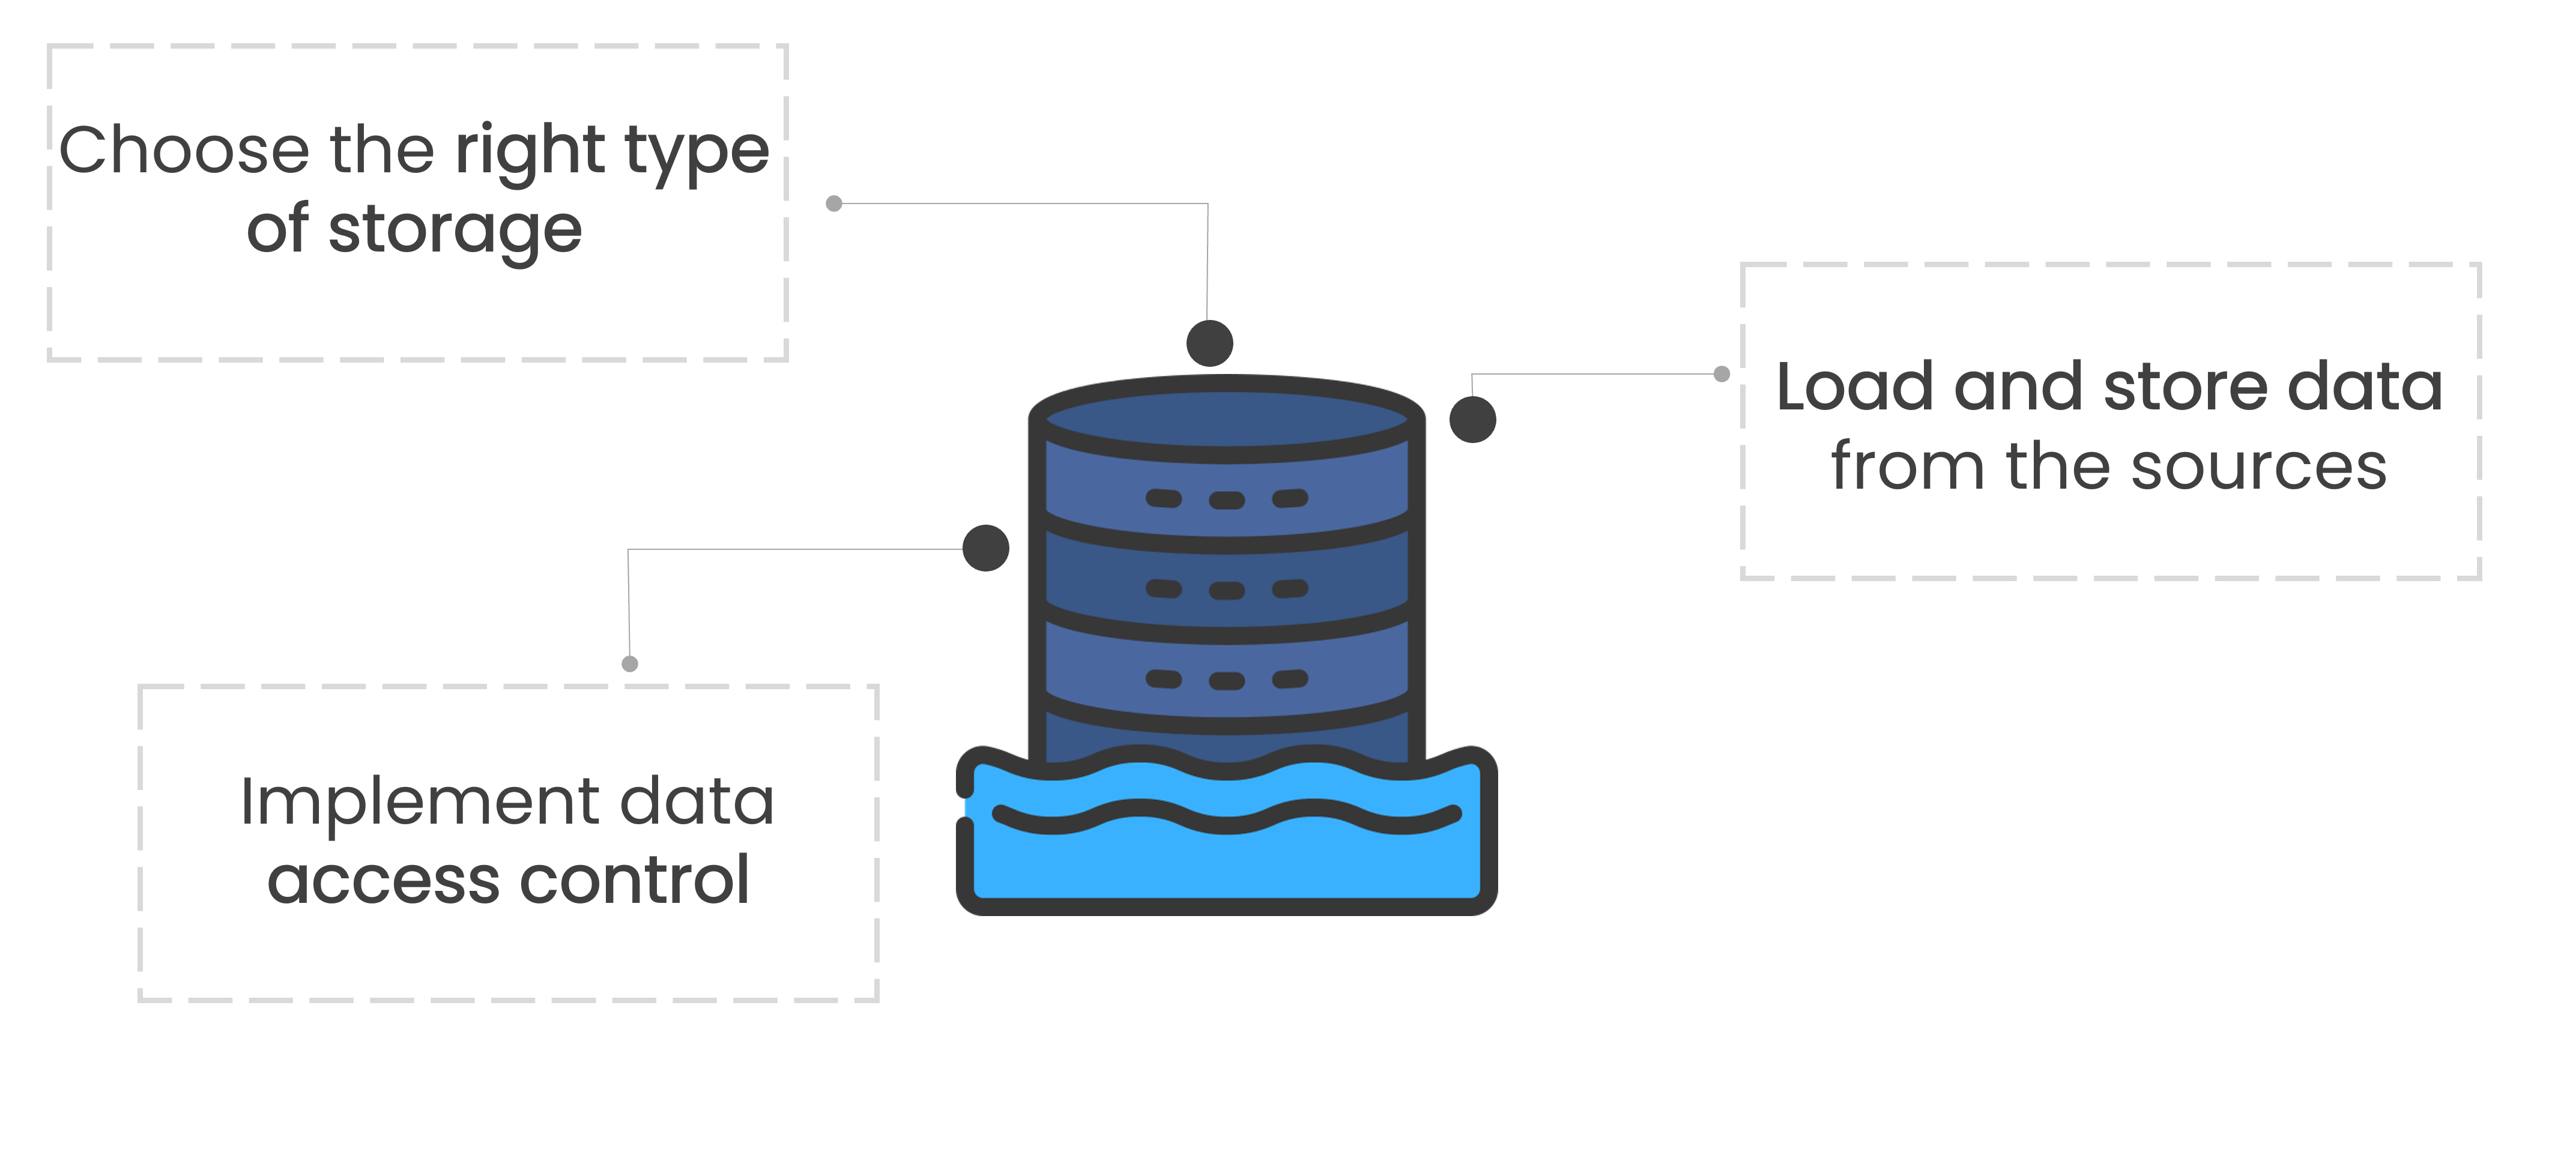
Data staging
Store, organize, and protect collected data in a structured format.
Data staging
Store, organize, and protect collected data in a structured format.

Data staging
Store, organize, and protect collected data in a structured format.
Data staging
Store, organize, and protect collected data in a structured format.

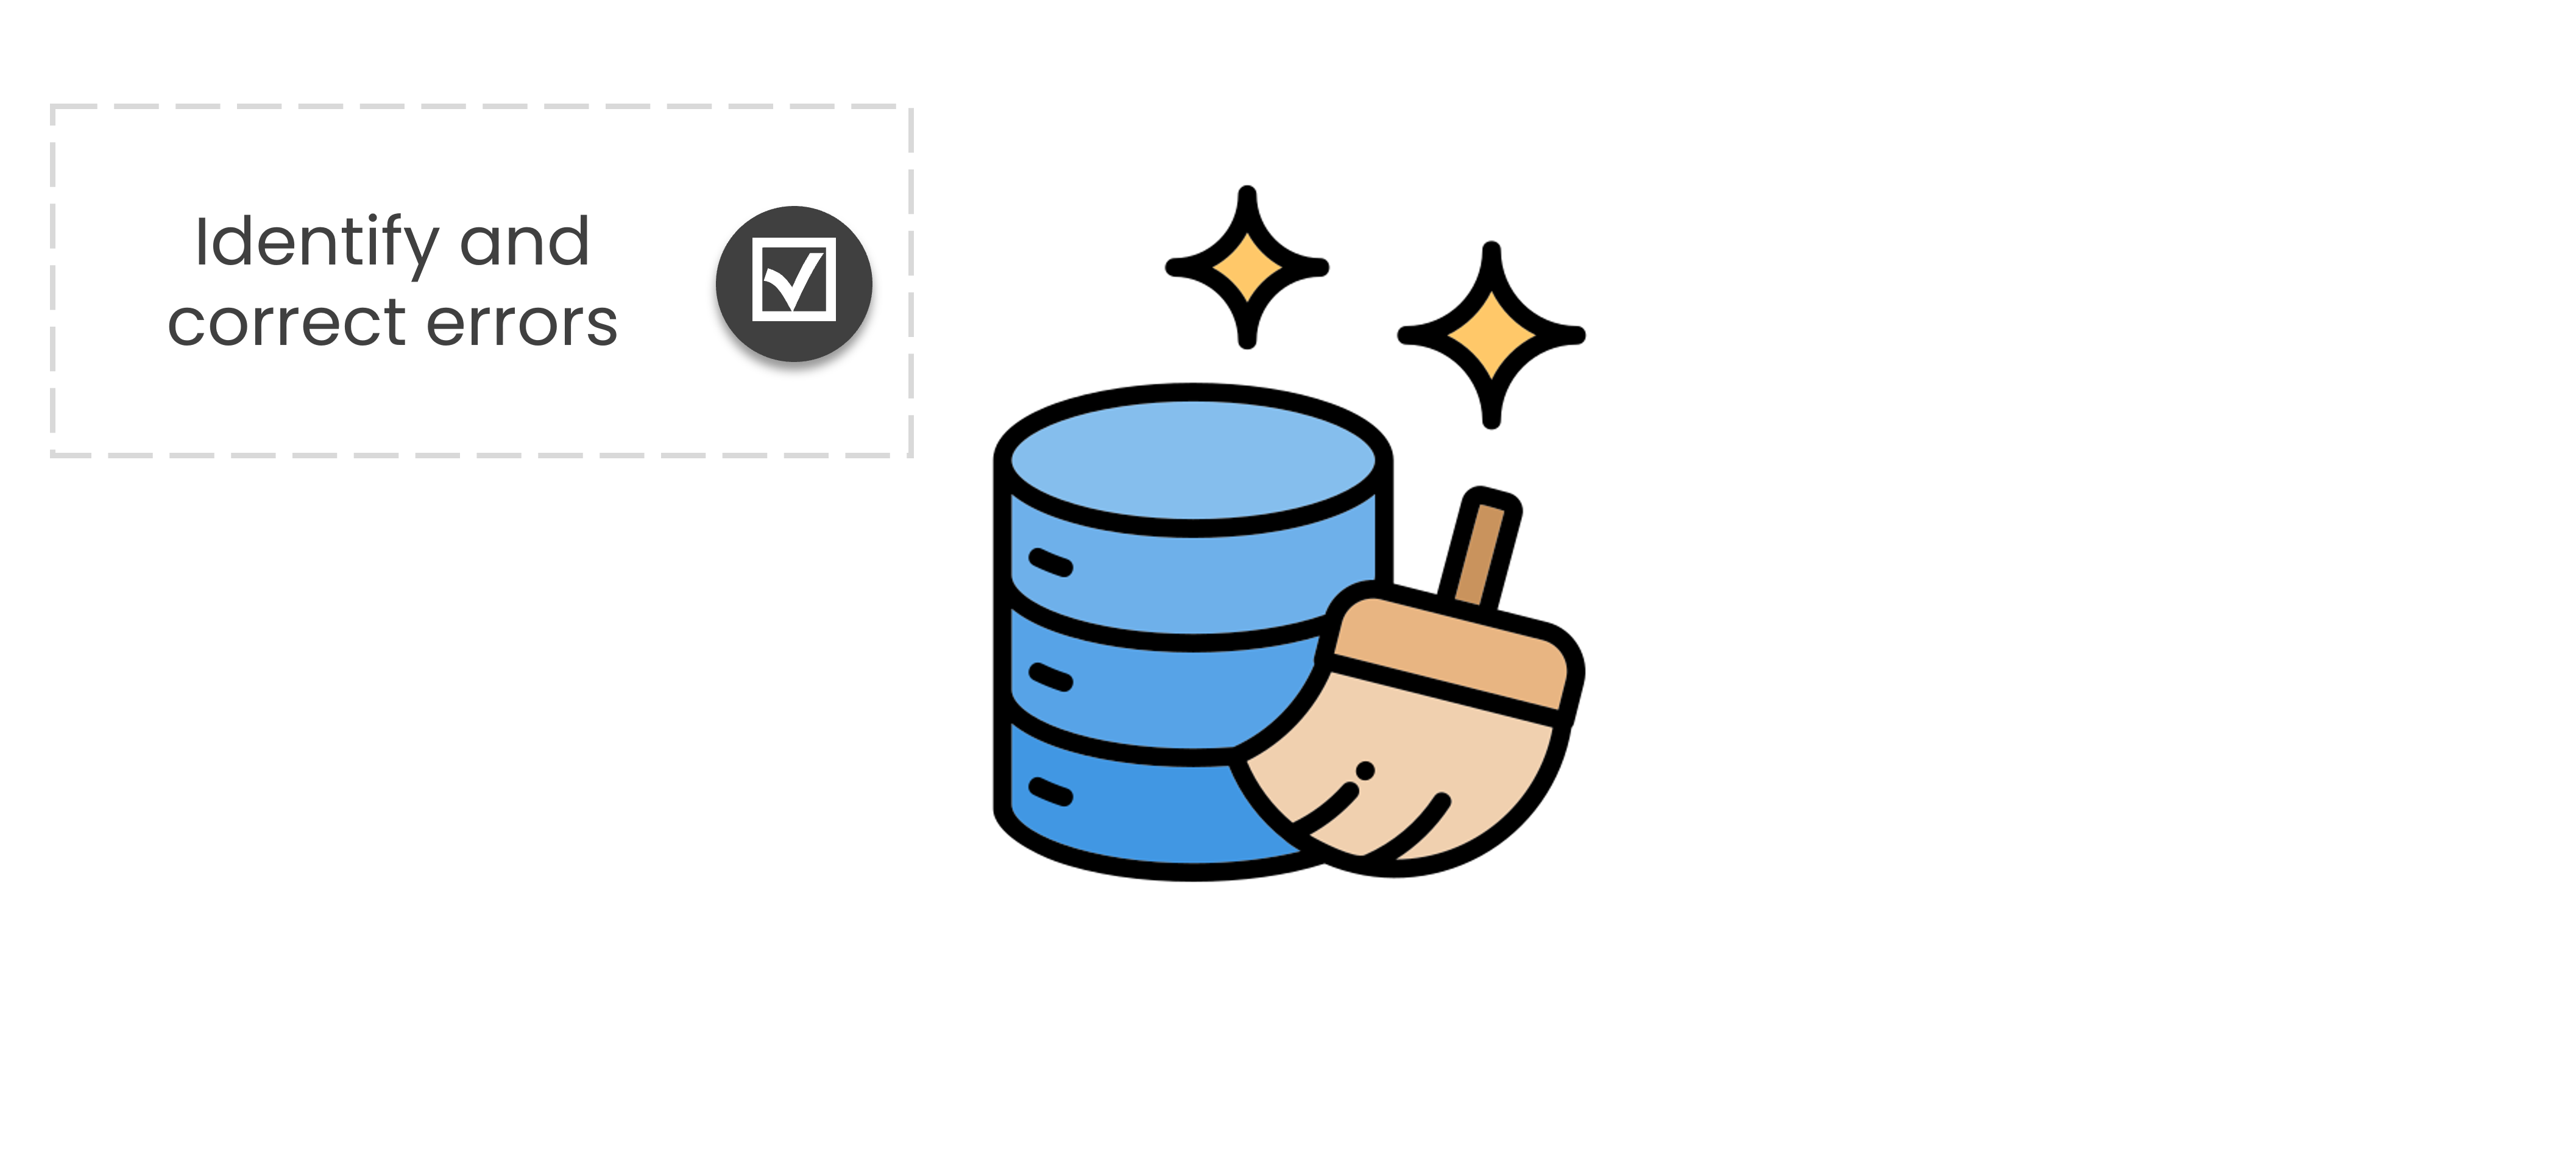
Data cleaning
Identify and correct errors, inconsistencies, or missing values in the dataset.
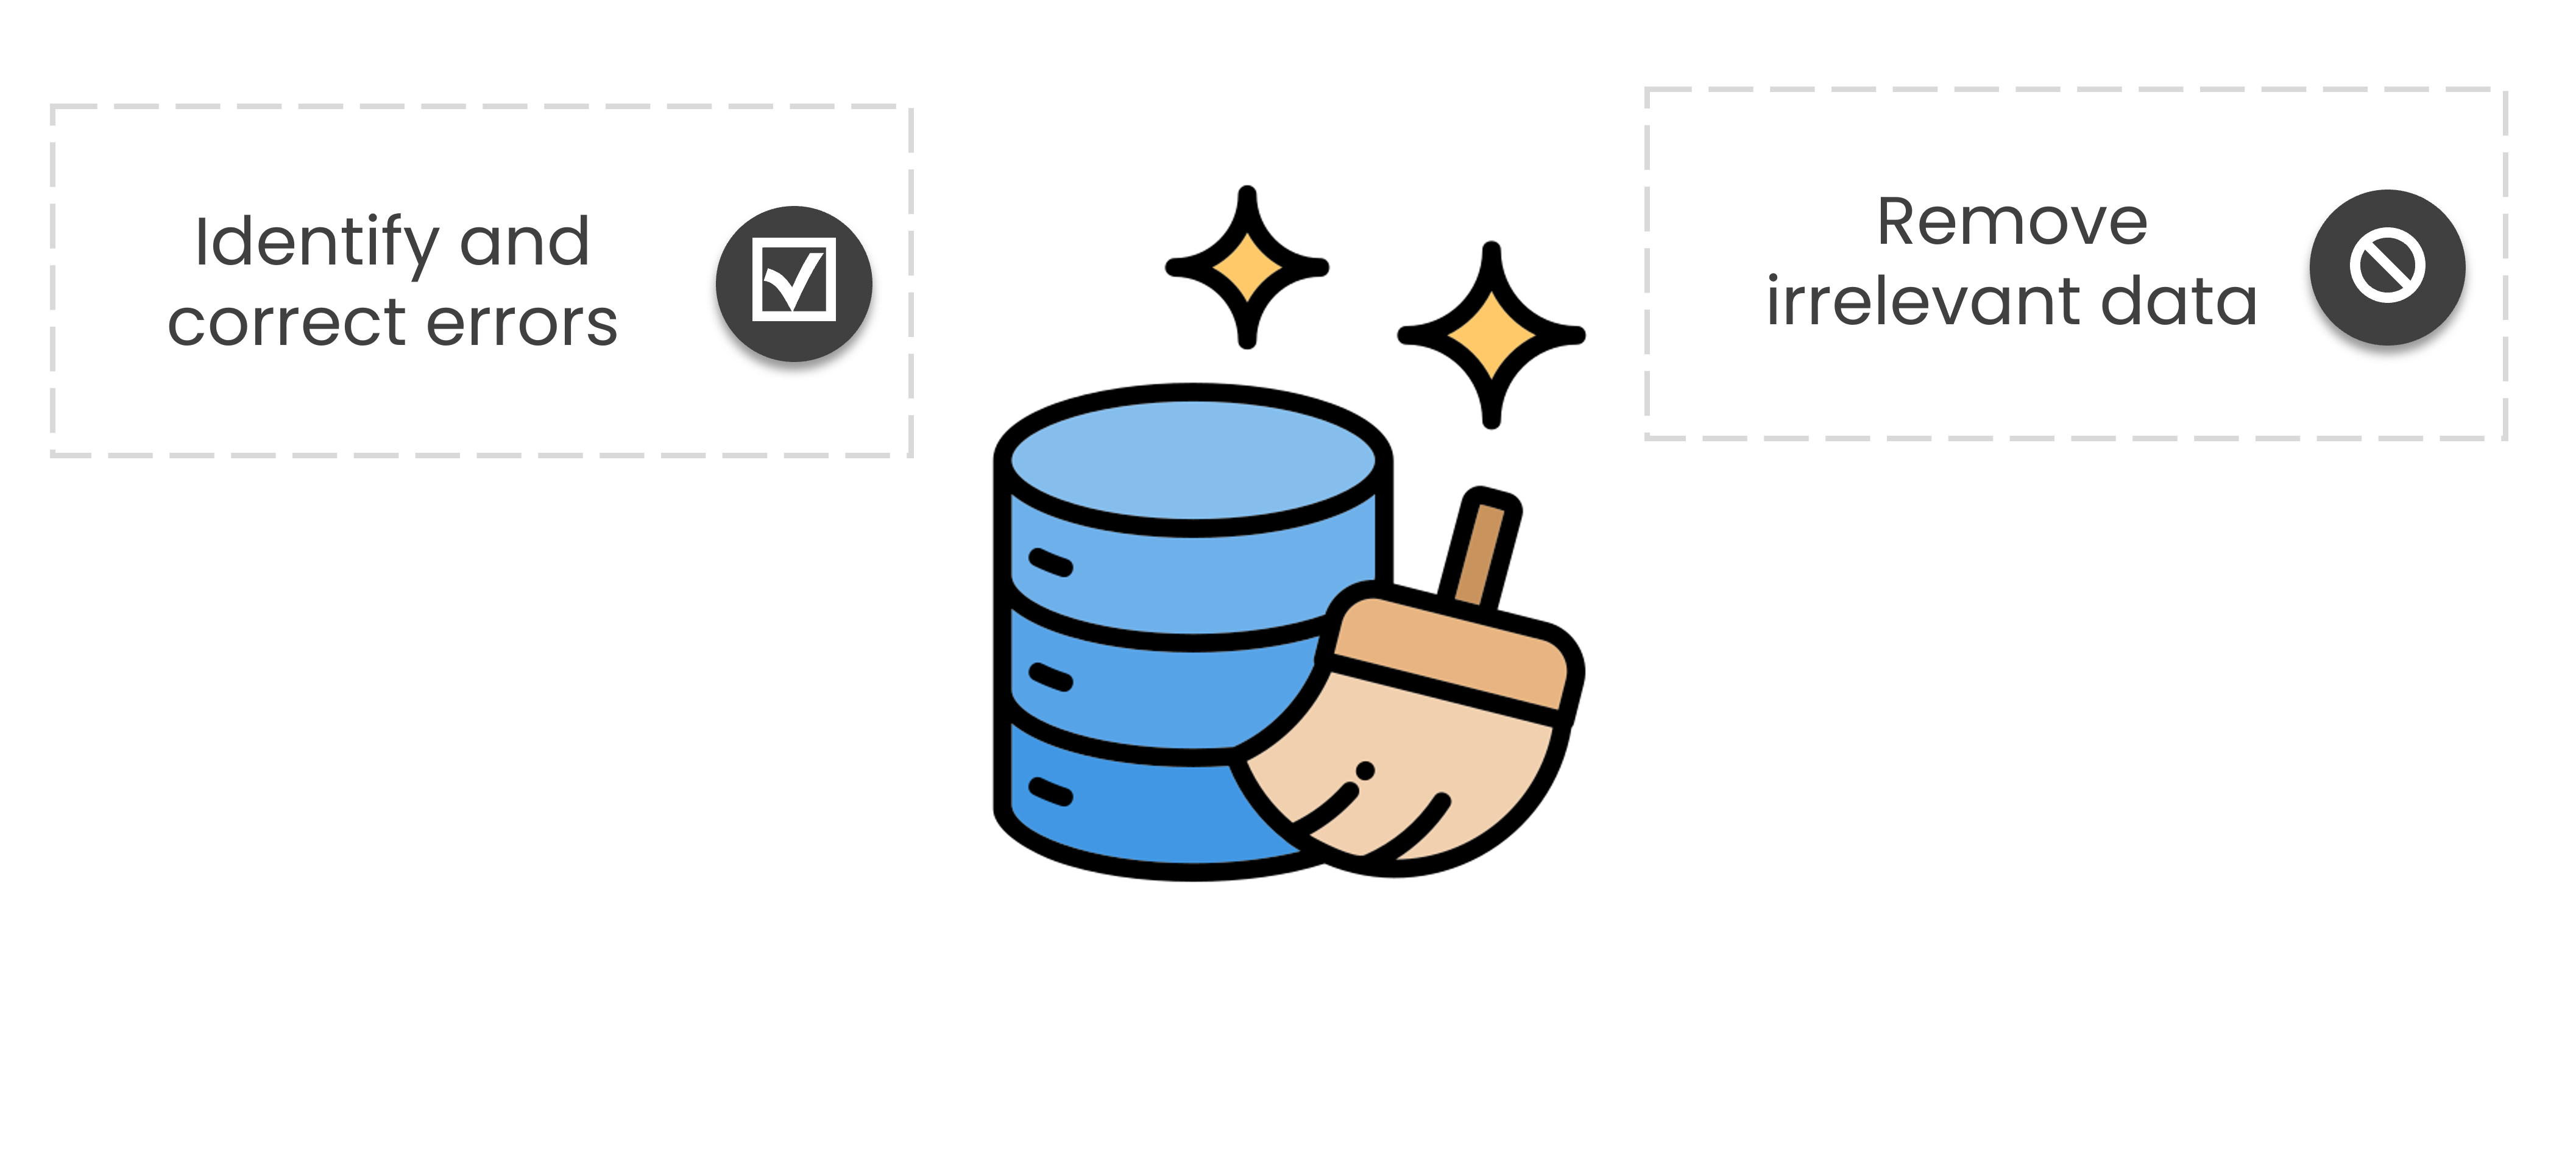
Data cleaning
Identify and correct errors, inconsistencies, or missing values in the dataset.
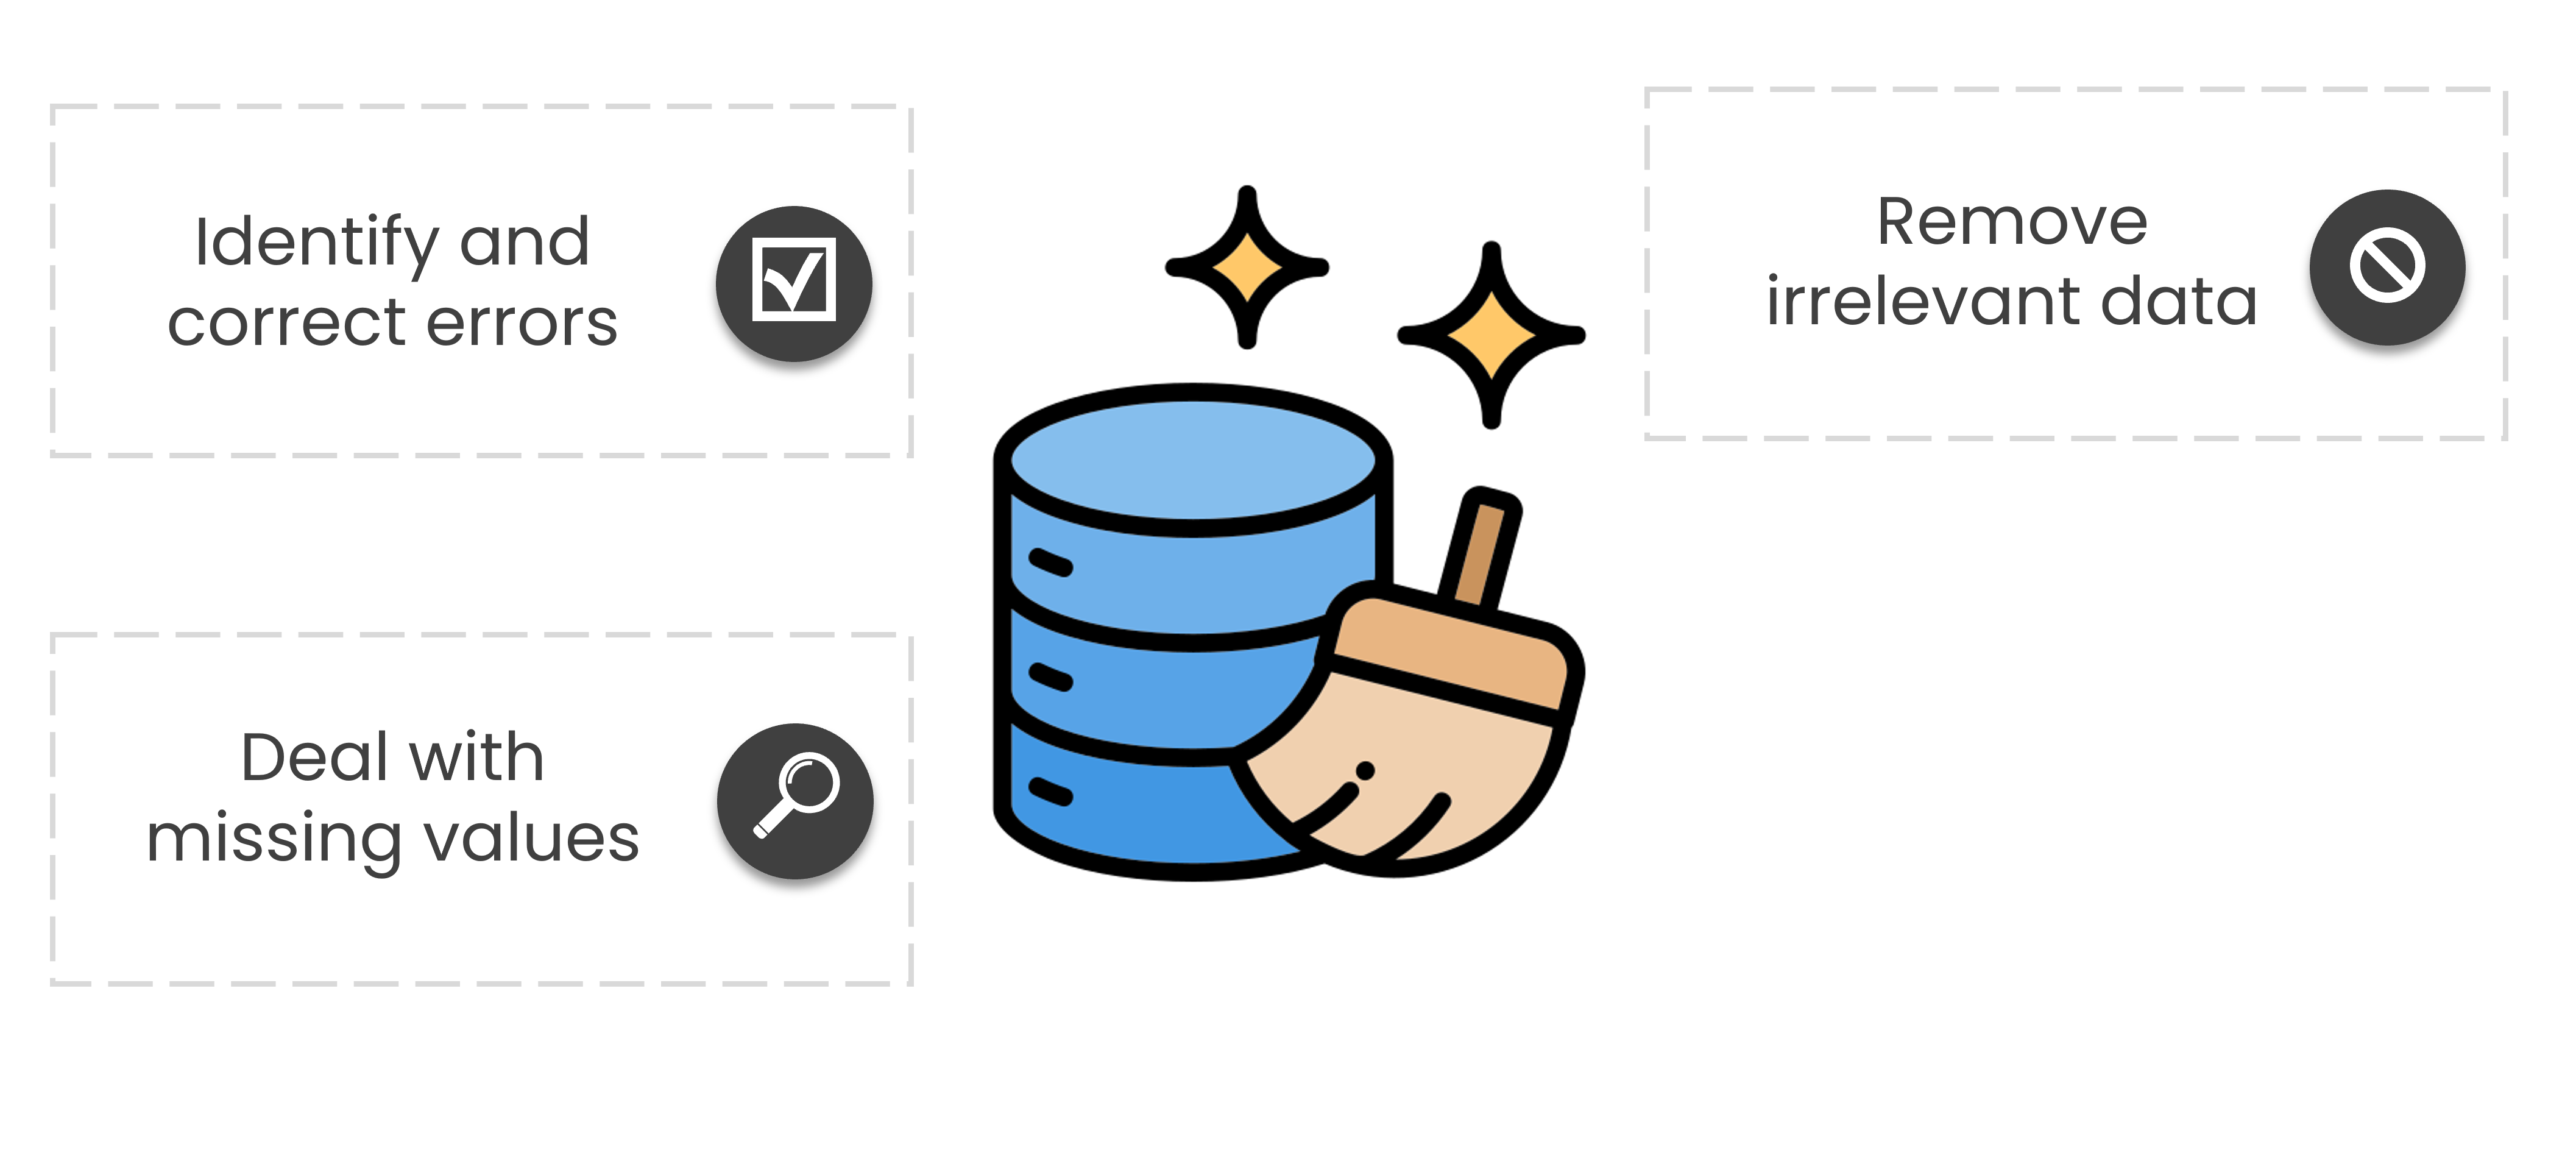
Data cleaning
Identify and correct errors, inconsistencies, or missing values in the dataset.
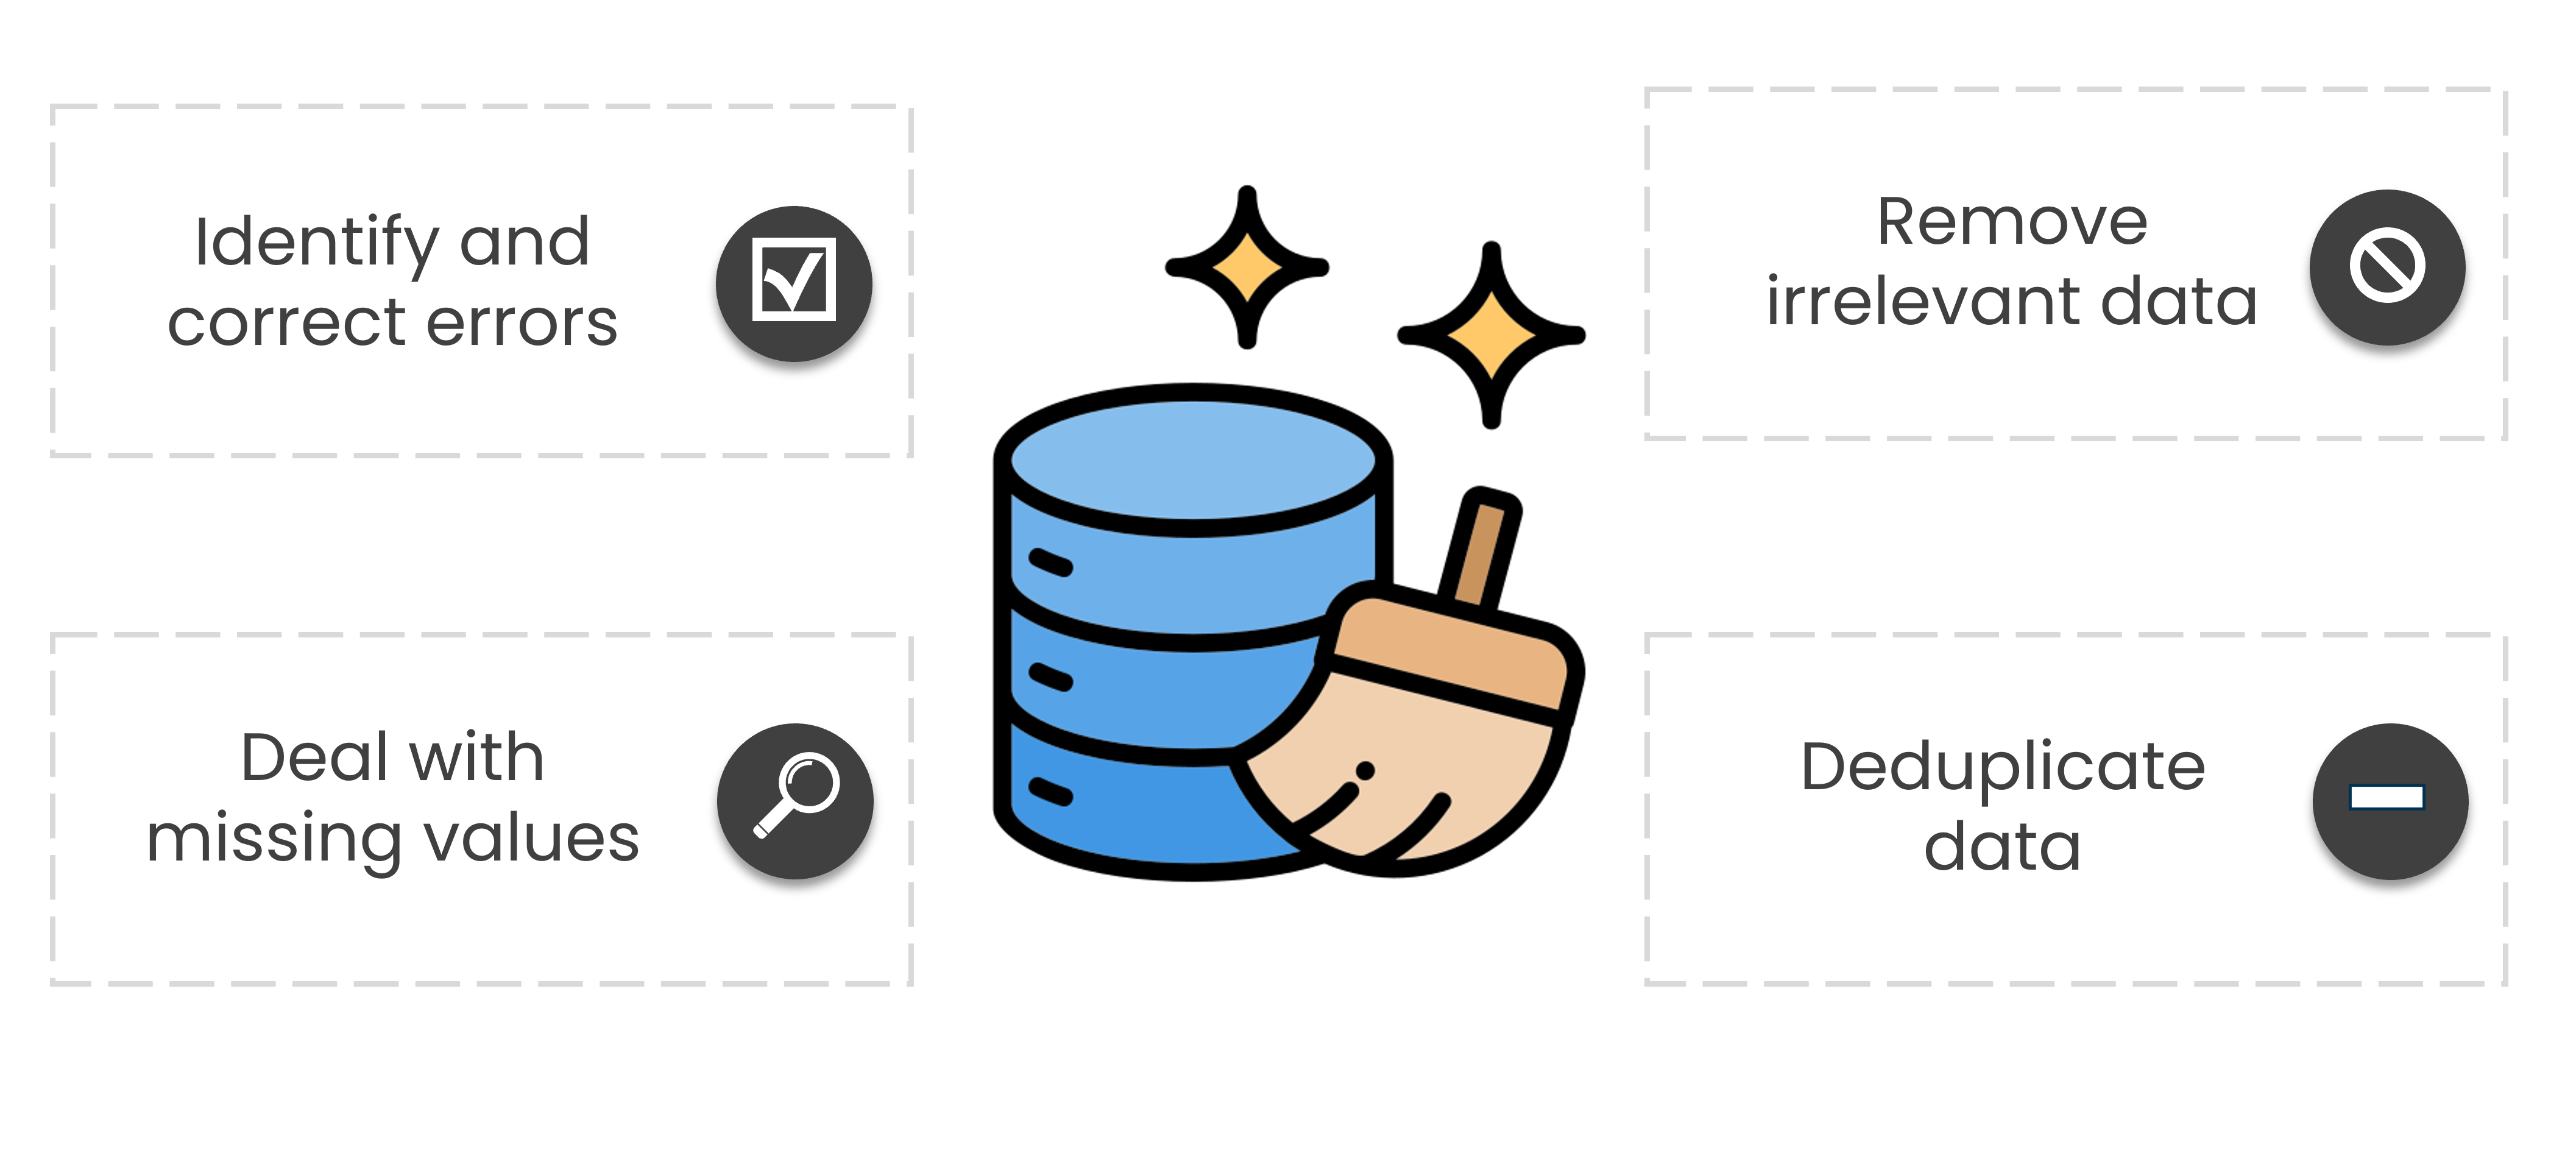
Data cleaning
Identify and correct errors, inconsistencies, or missing values in the dataset.
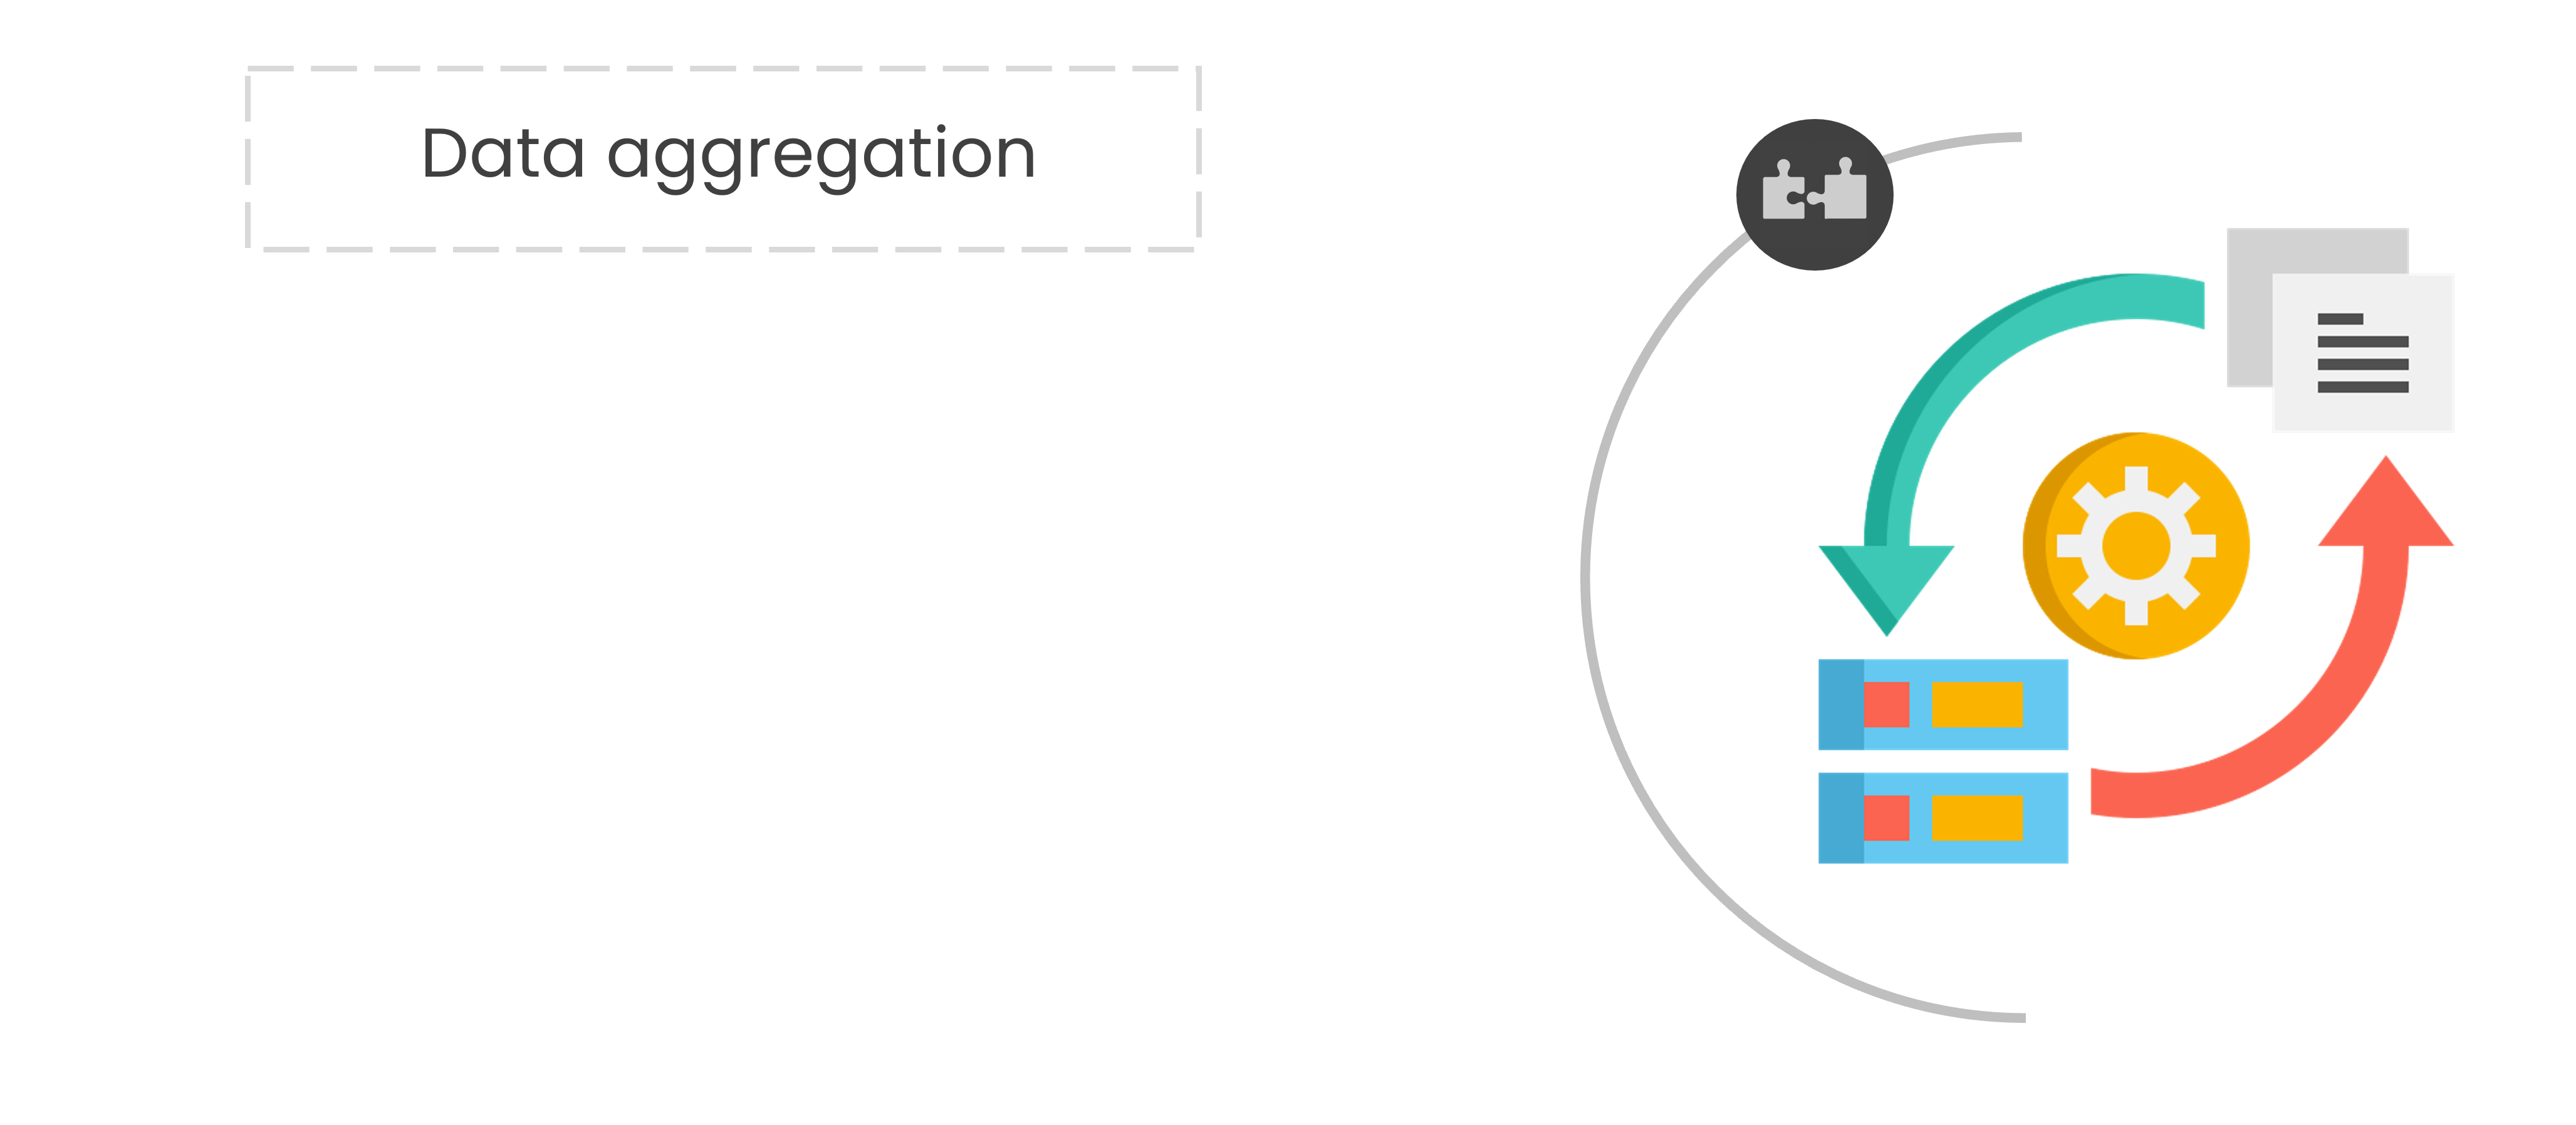
Data transformation
Restructure the data to make it suitable for analysis.
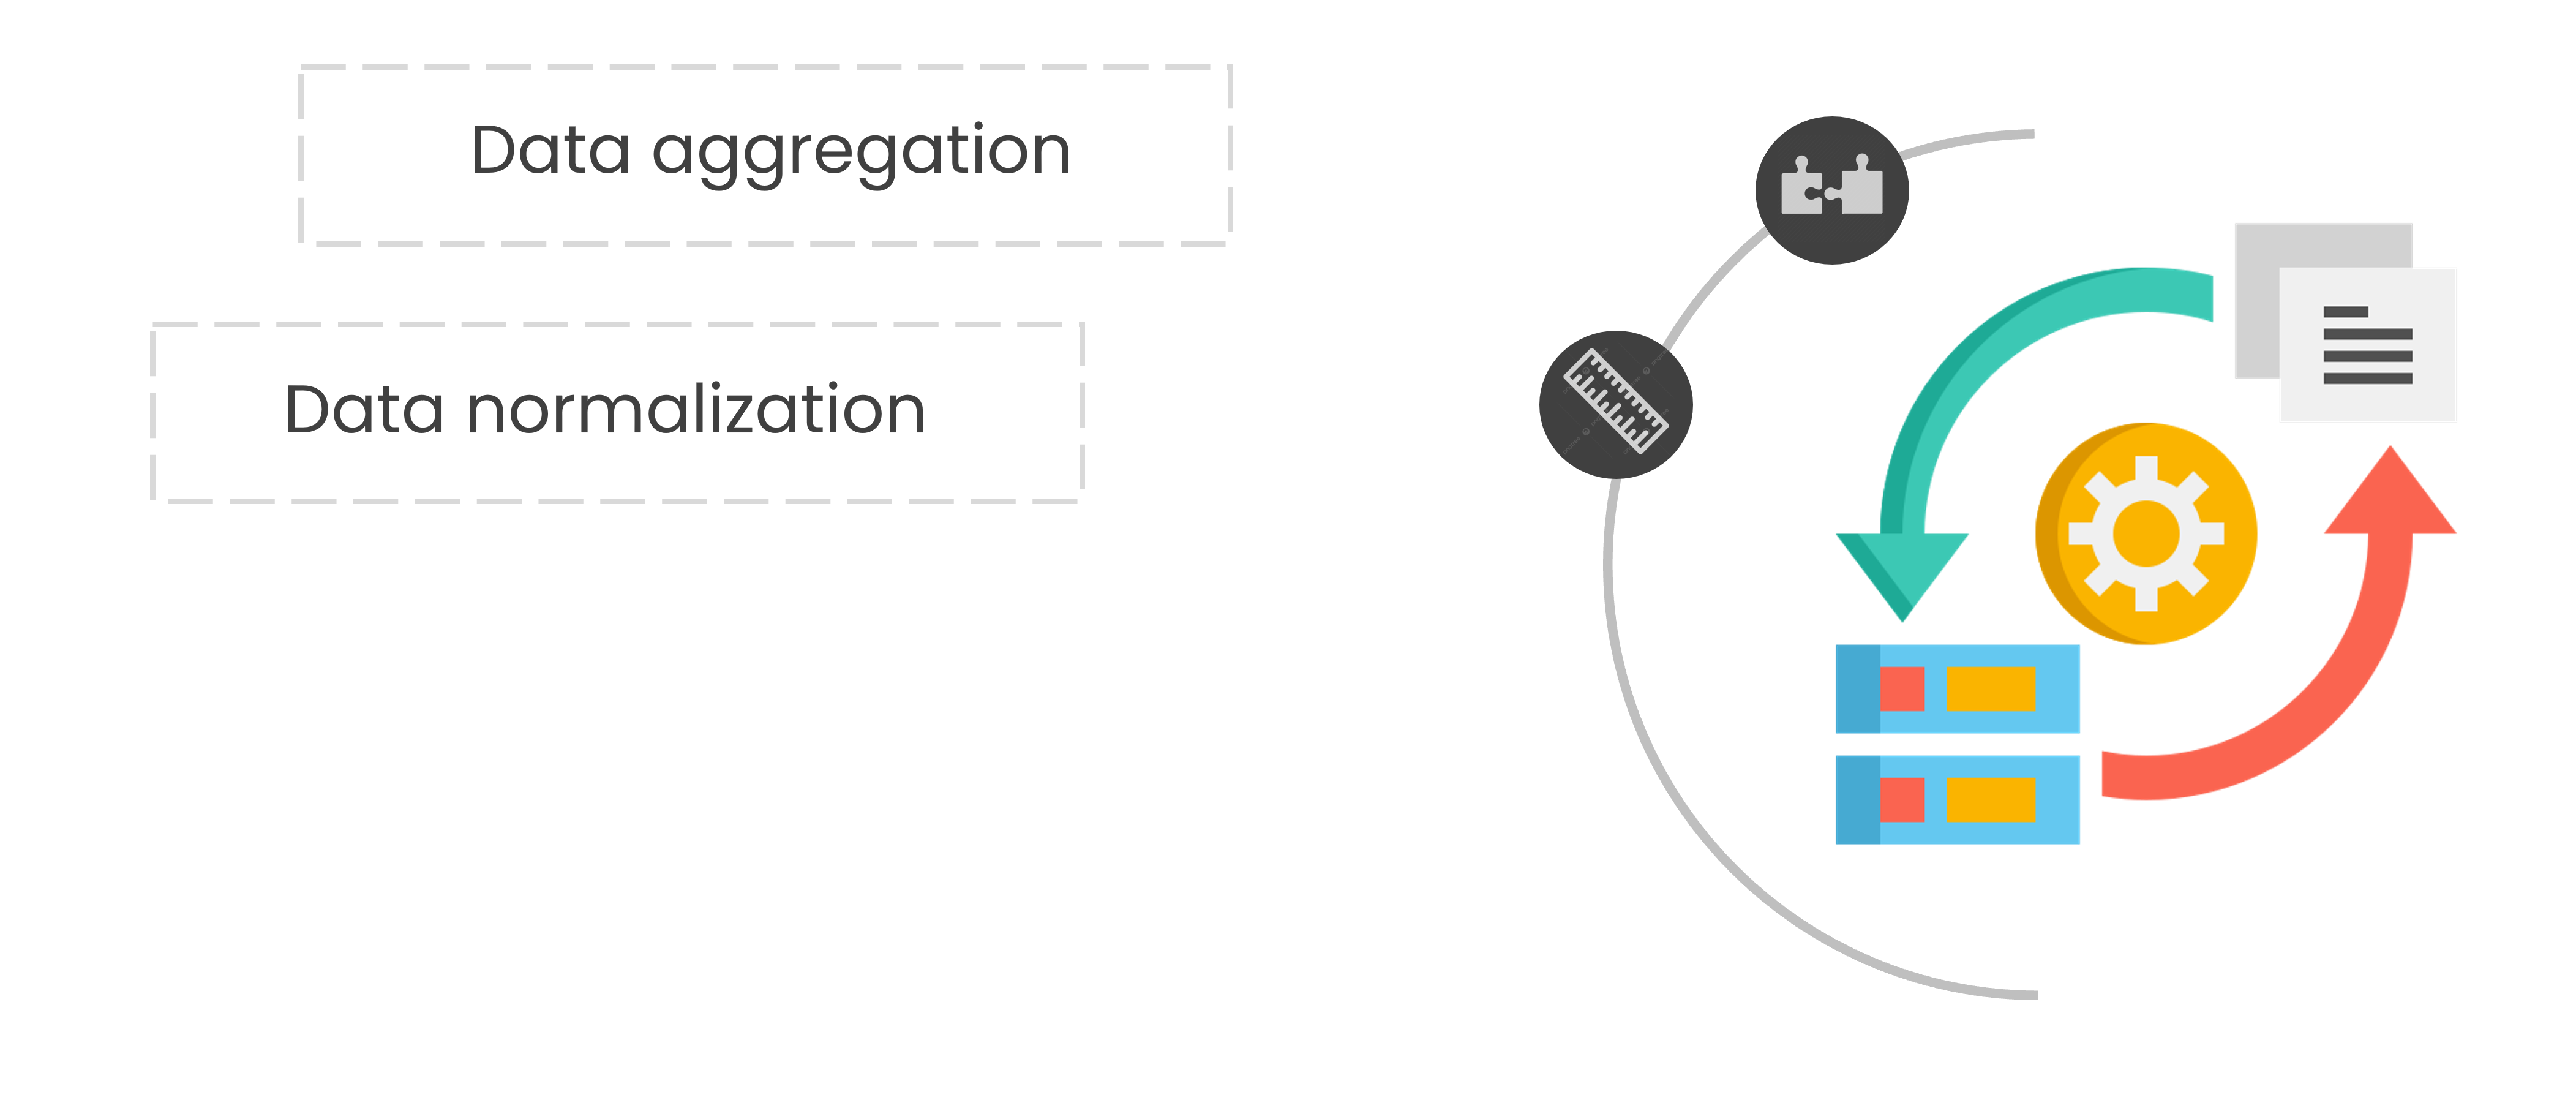
Data transformation
Restructure the data to make it suitable for analysis.
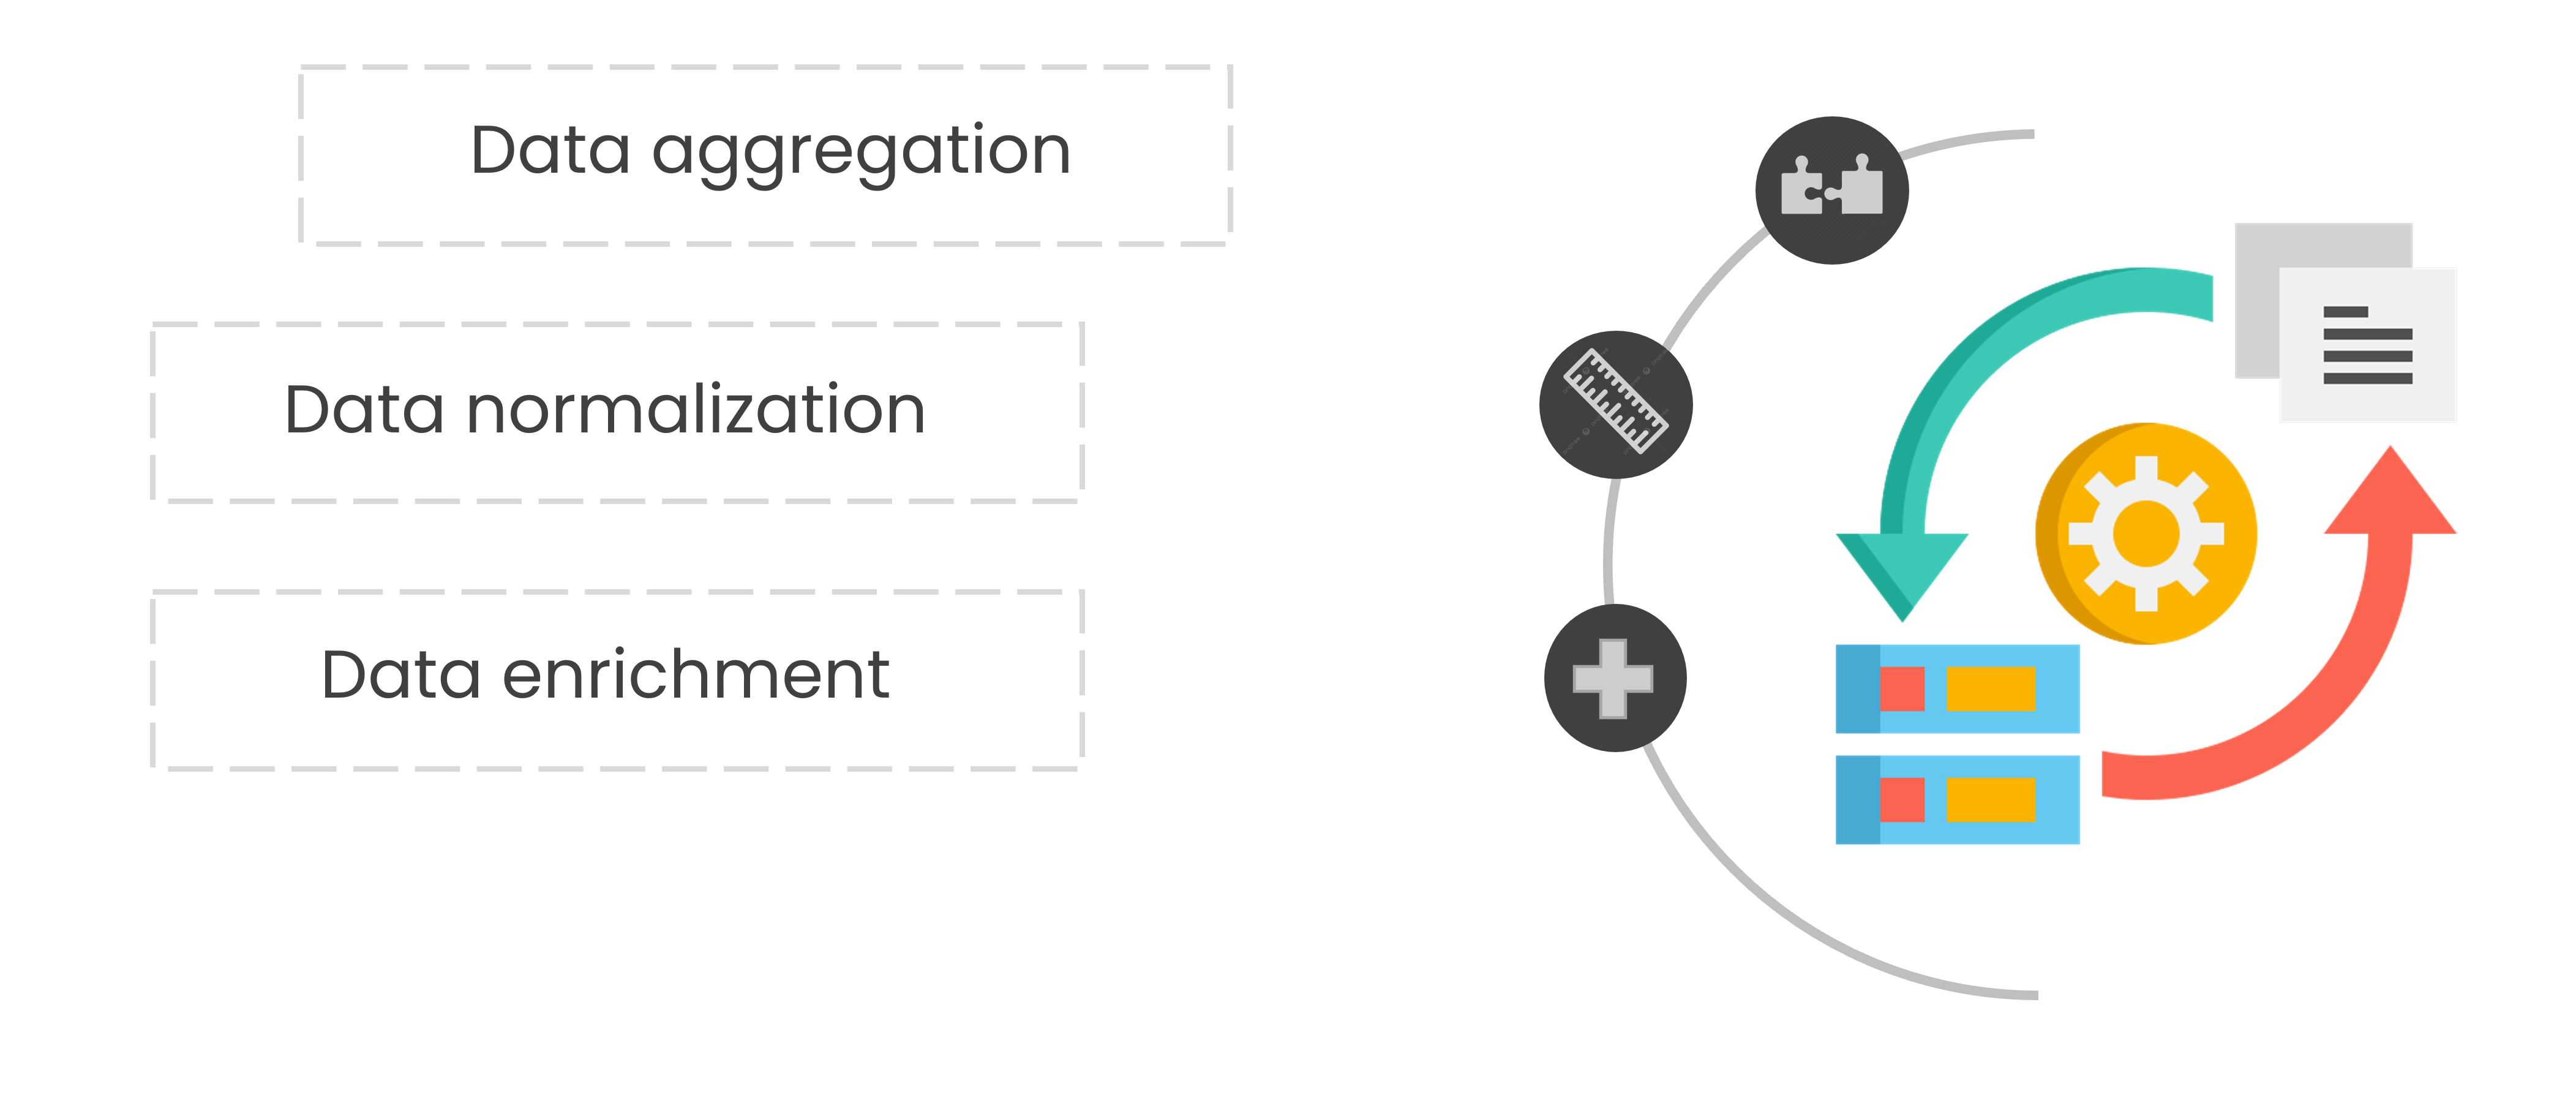
Data transformation
Restructure the data to make it suitable for analysis.
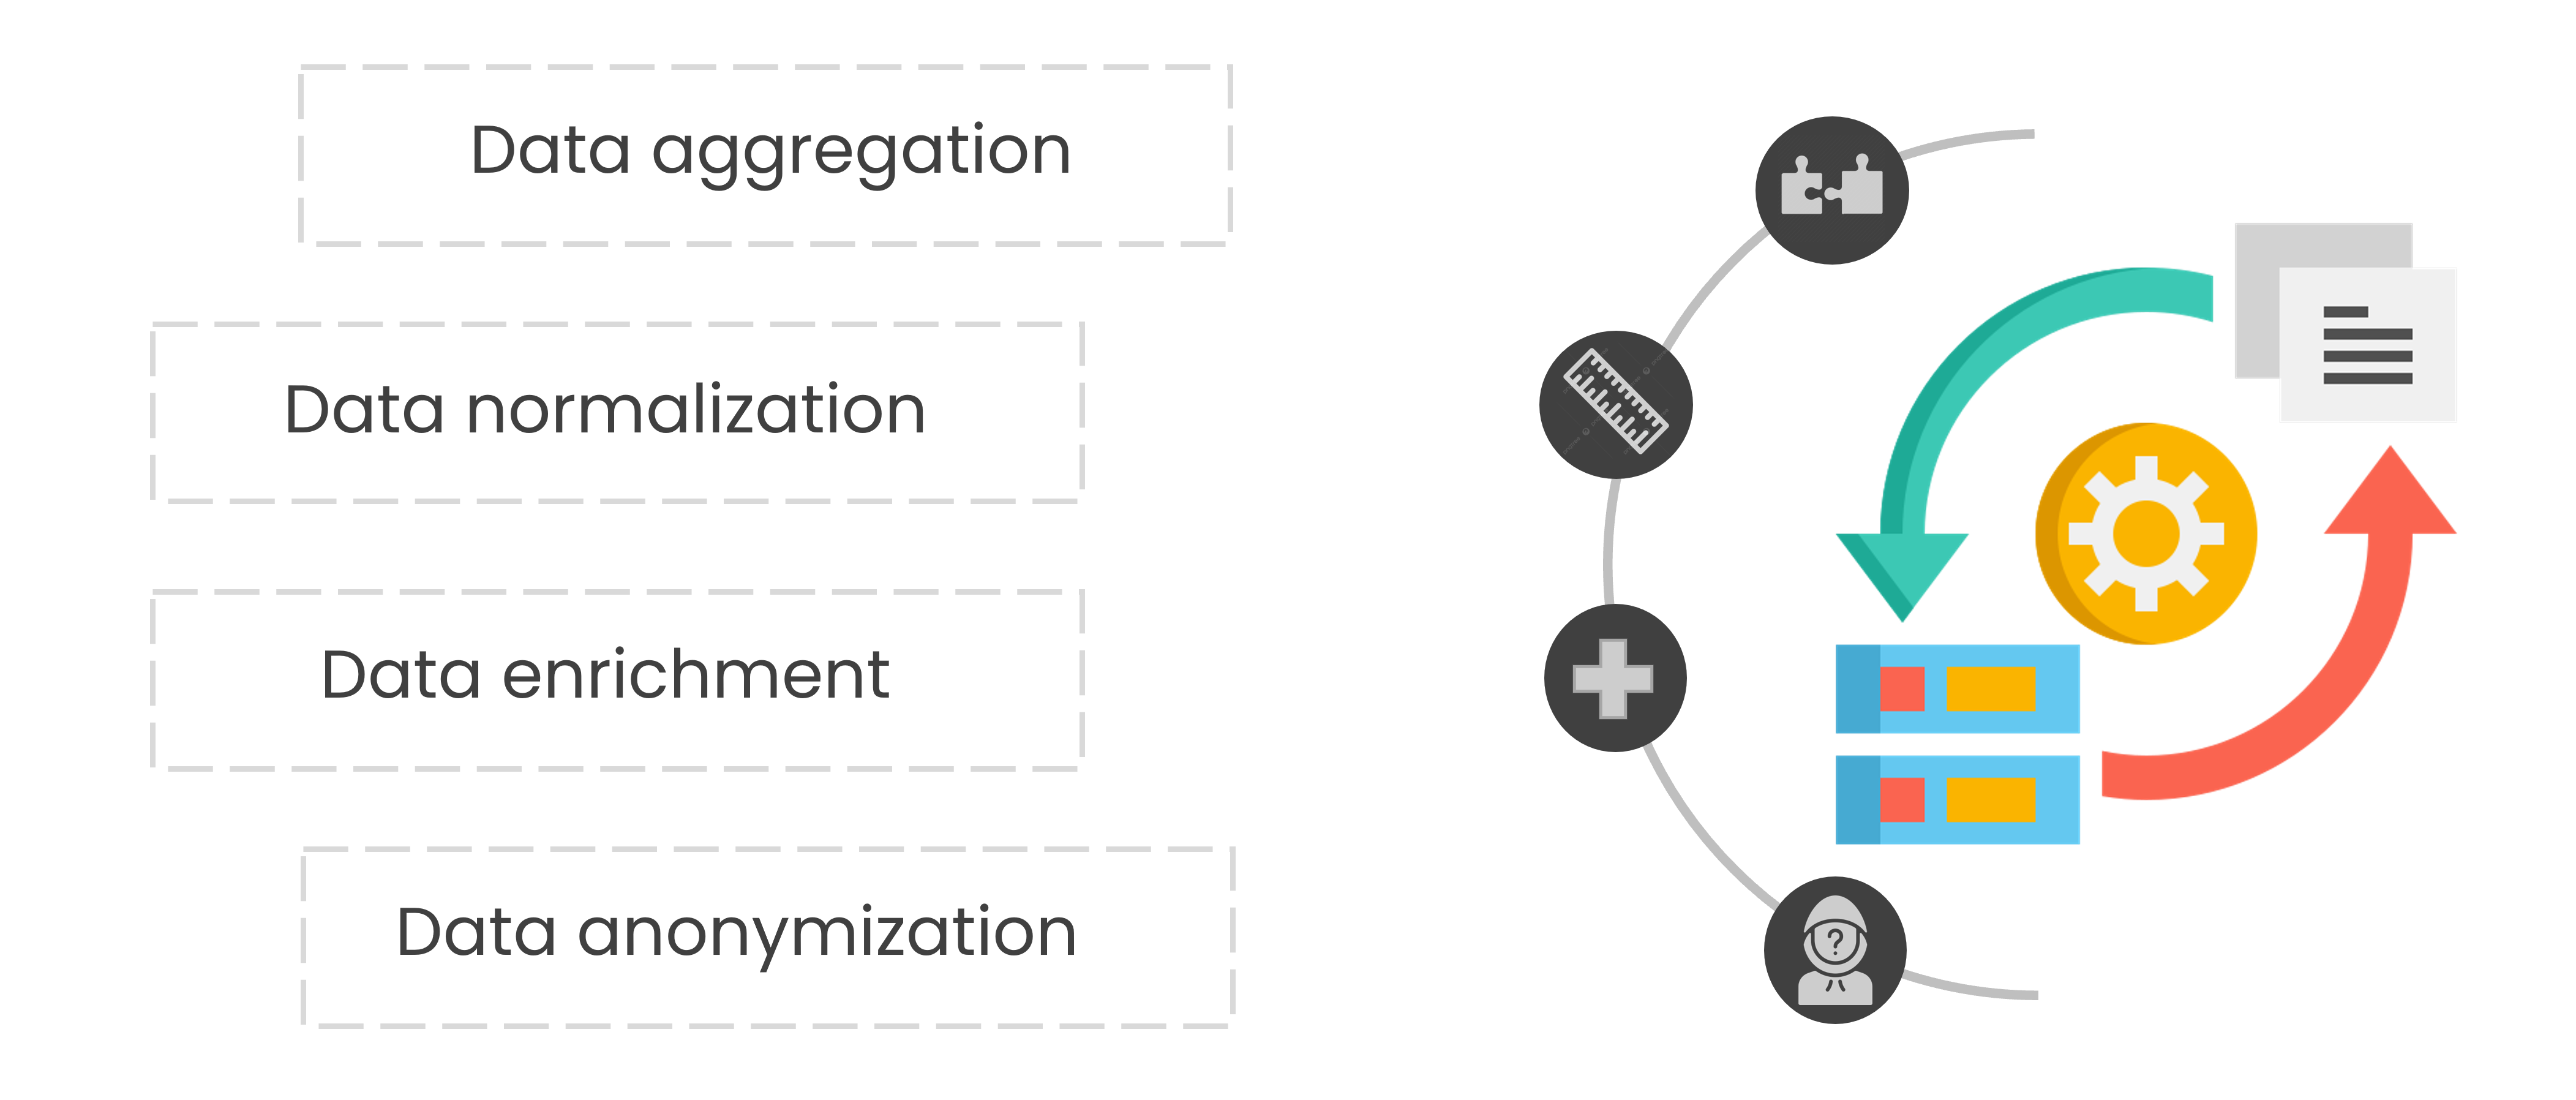
Data transformation
Restructure the data to make it suitable for analysis.
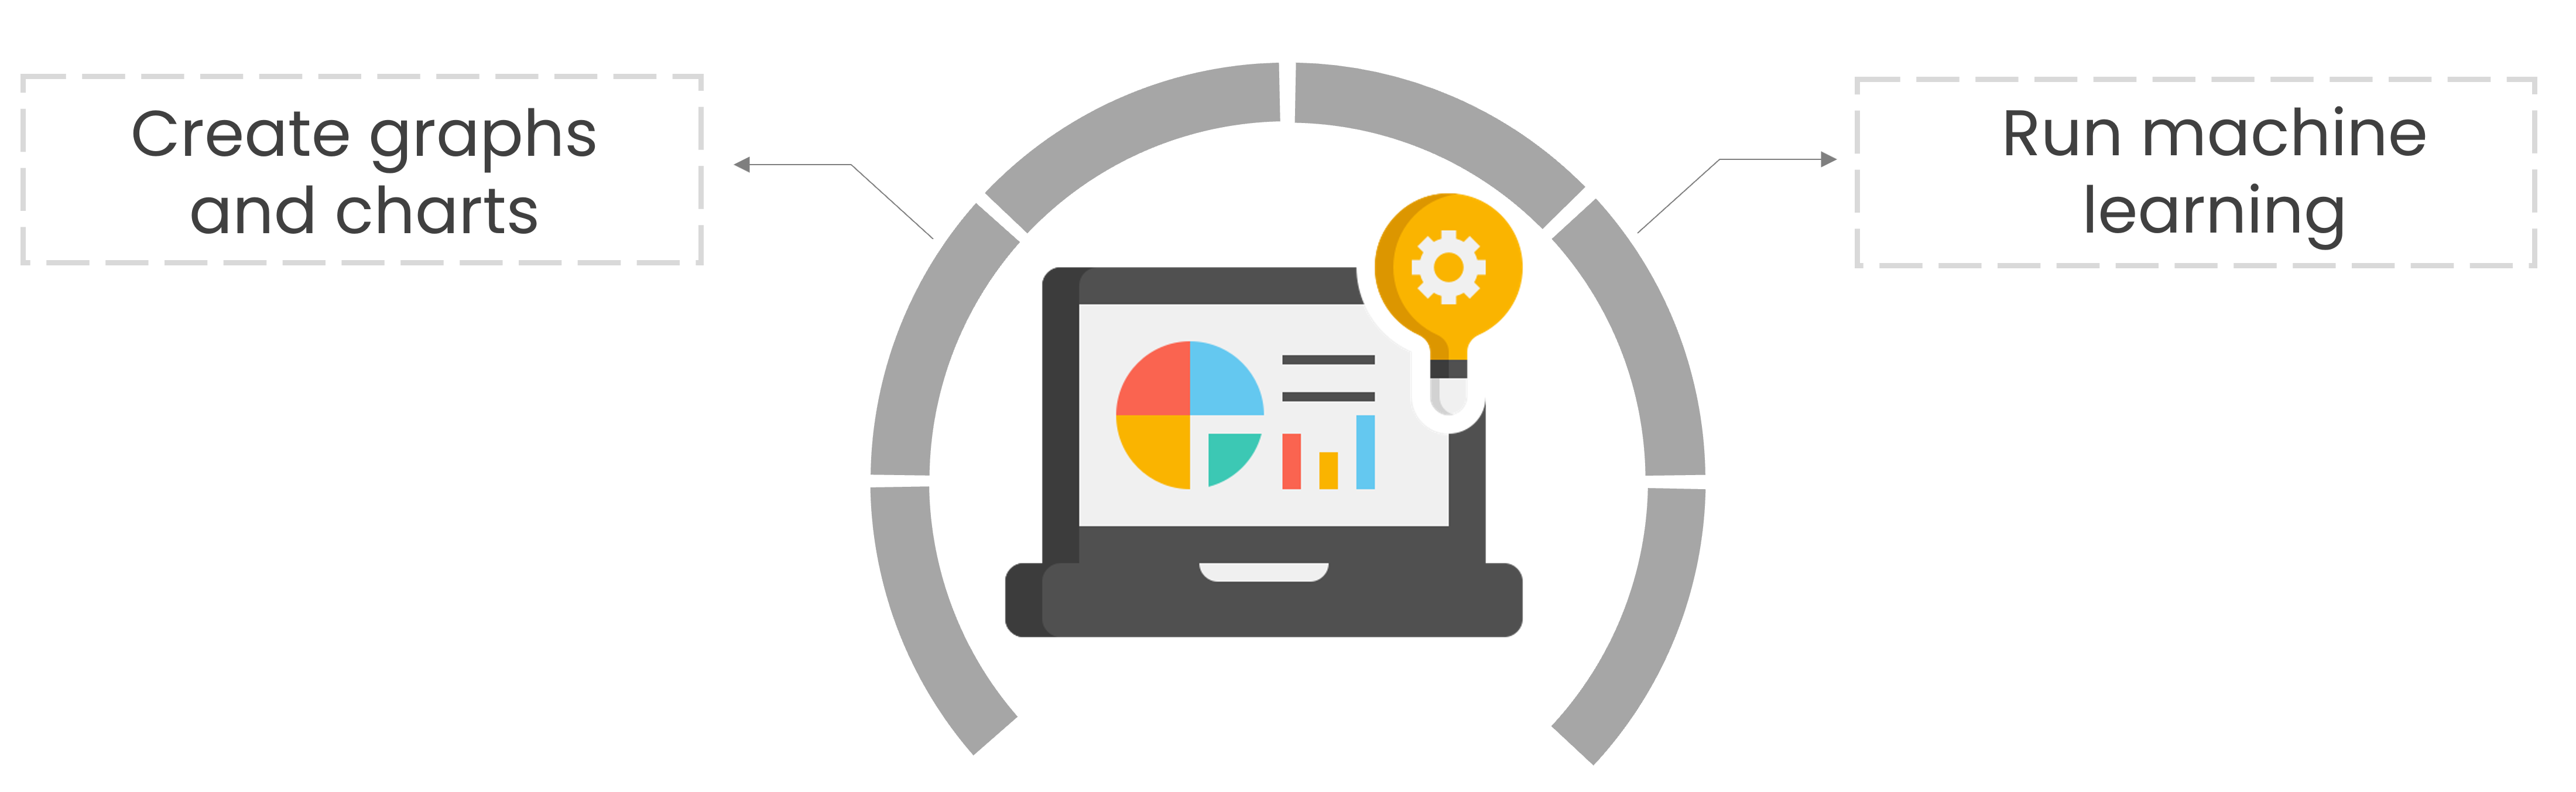
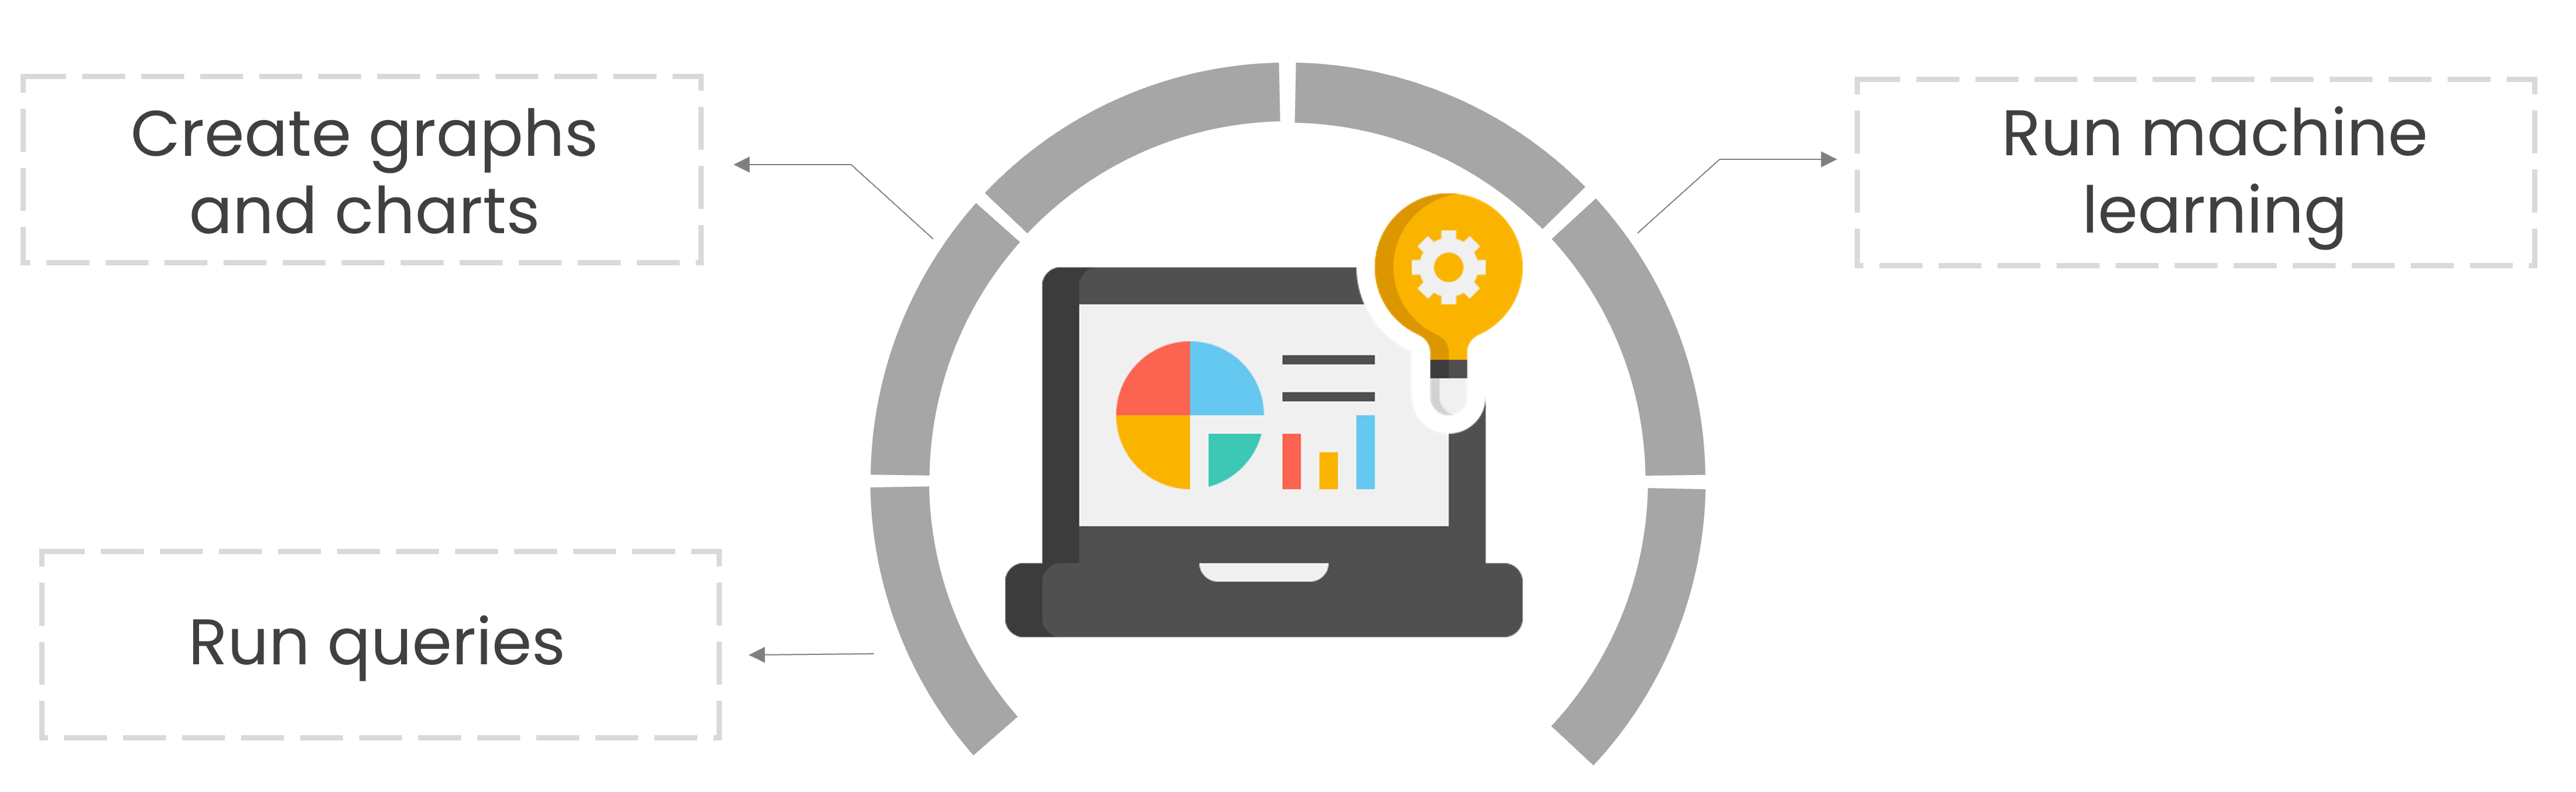
Generate insights
Produce relevant insights and extract valuable information from the data.


Generate insights
Produce relevant insights and extract valuable information from the data.
Generate insights
Produce relevant insights and extract valuable information from the data.
Generate insights
Produce relevant insights and extract valuable information from the data.