Constructing Decision Models

Decoding Decision Modeling

Tiago Brasil

Lead Data Engineer

Decision Models

Decision modeling is a systematic approach to represent, analyze, and optimize the decision-making process.

A white rectangle with a white outline to facilitate the slide formating

These models formalize decision problems by structuring them into elements using:

  • Graphical representations
  • Mathematical operations
  • Computational techniques

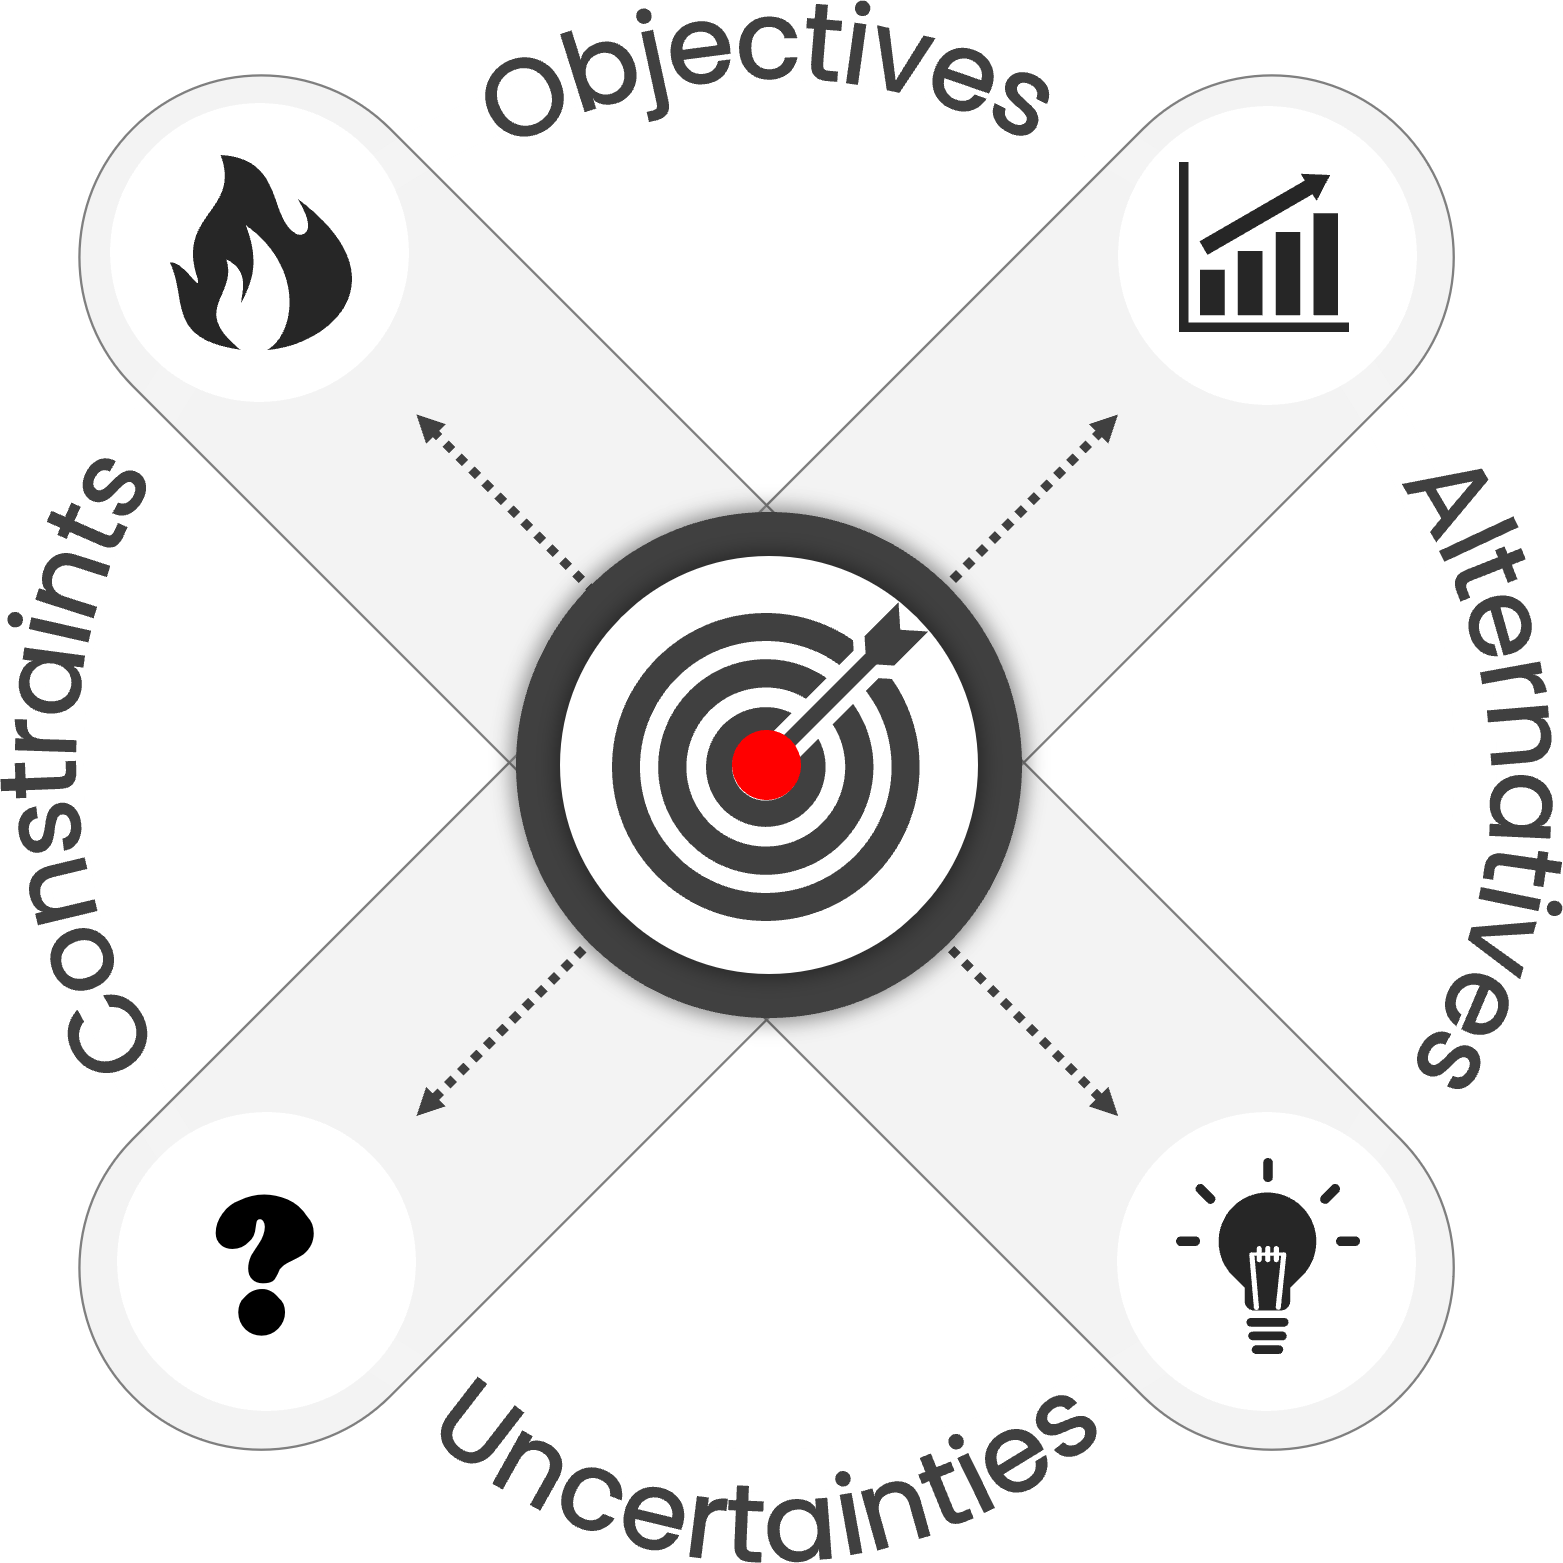
A diagram centered around a target symbol, representing decision-making. Four arrows point outward from the target in four different directions. Each arrow leads to a label and an icon of Objectives,Alternatives, Constraints and Uncertainties

Decoding Decision Modeling

Decision modeling techniques

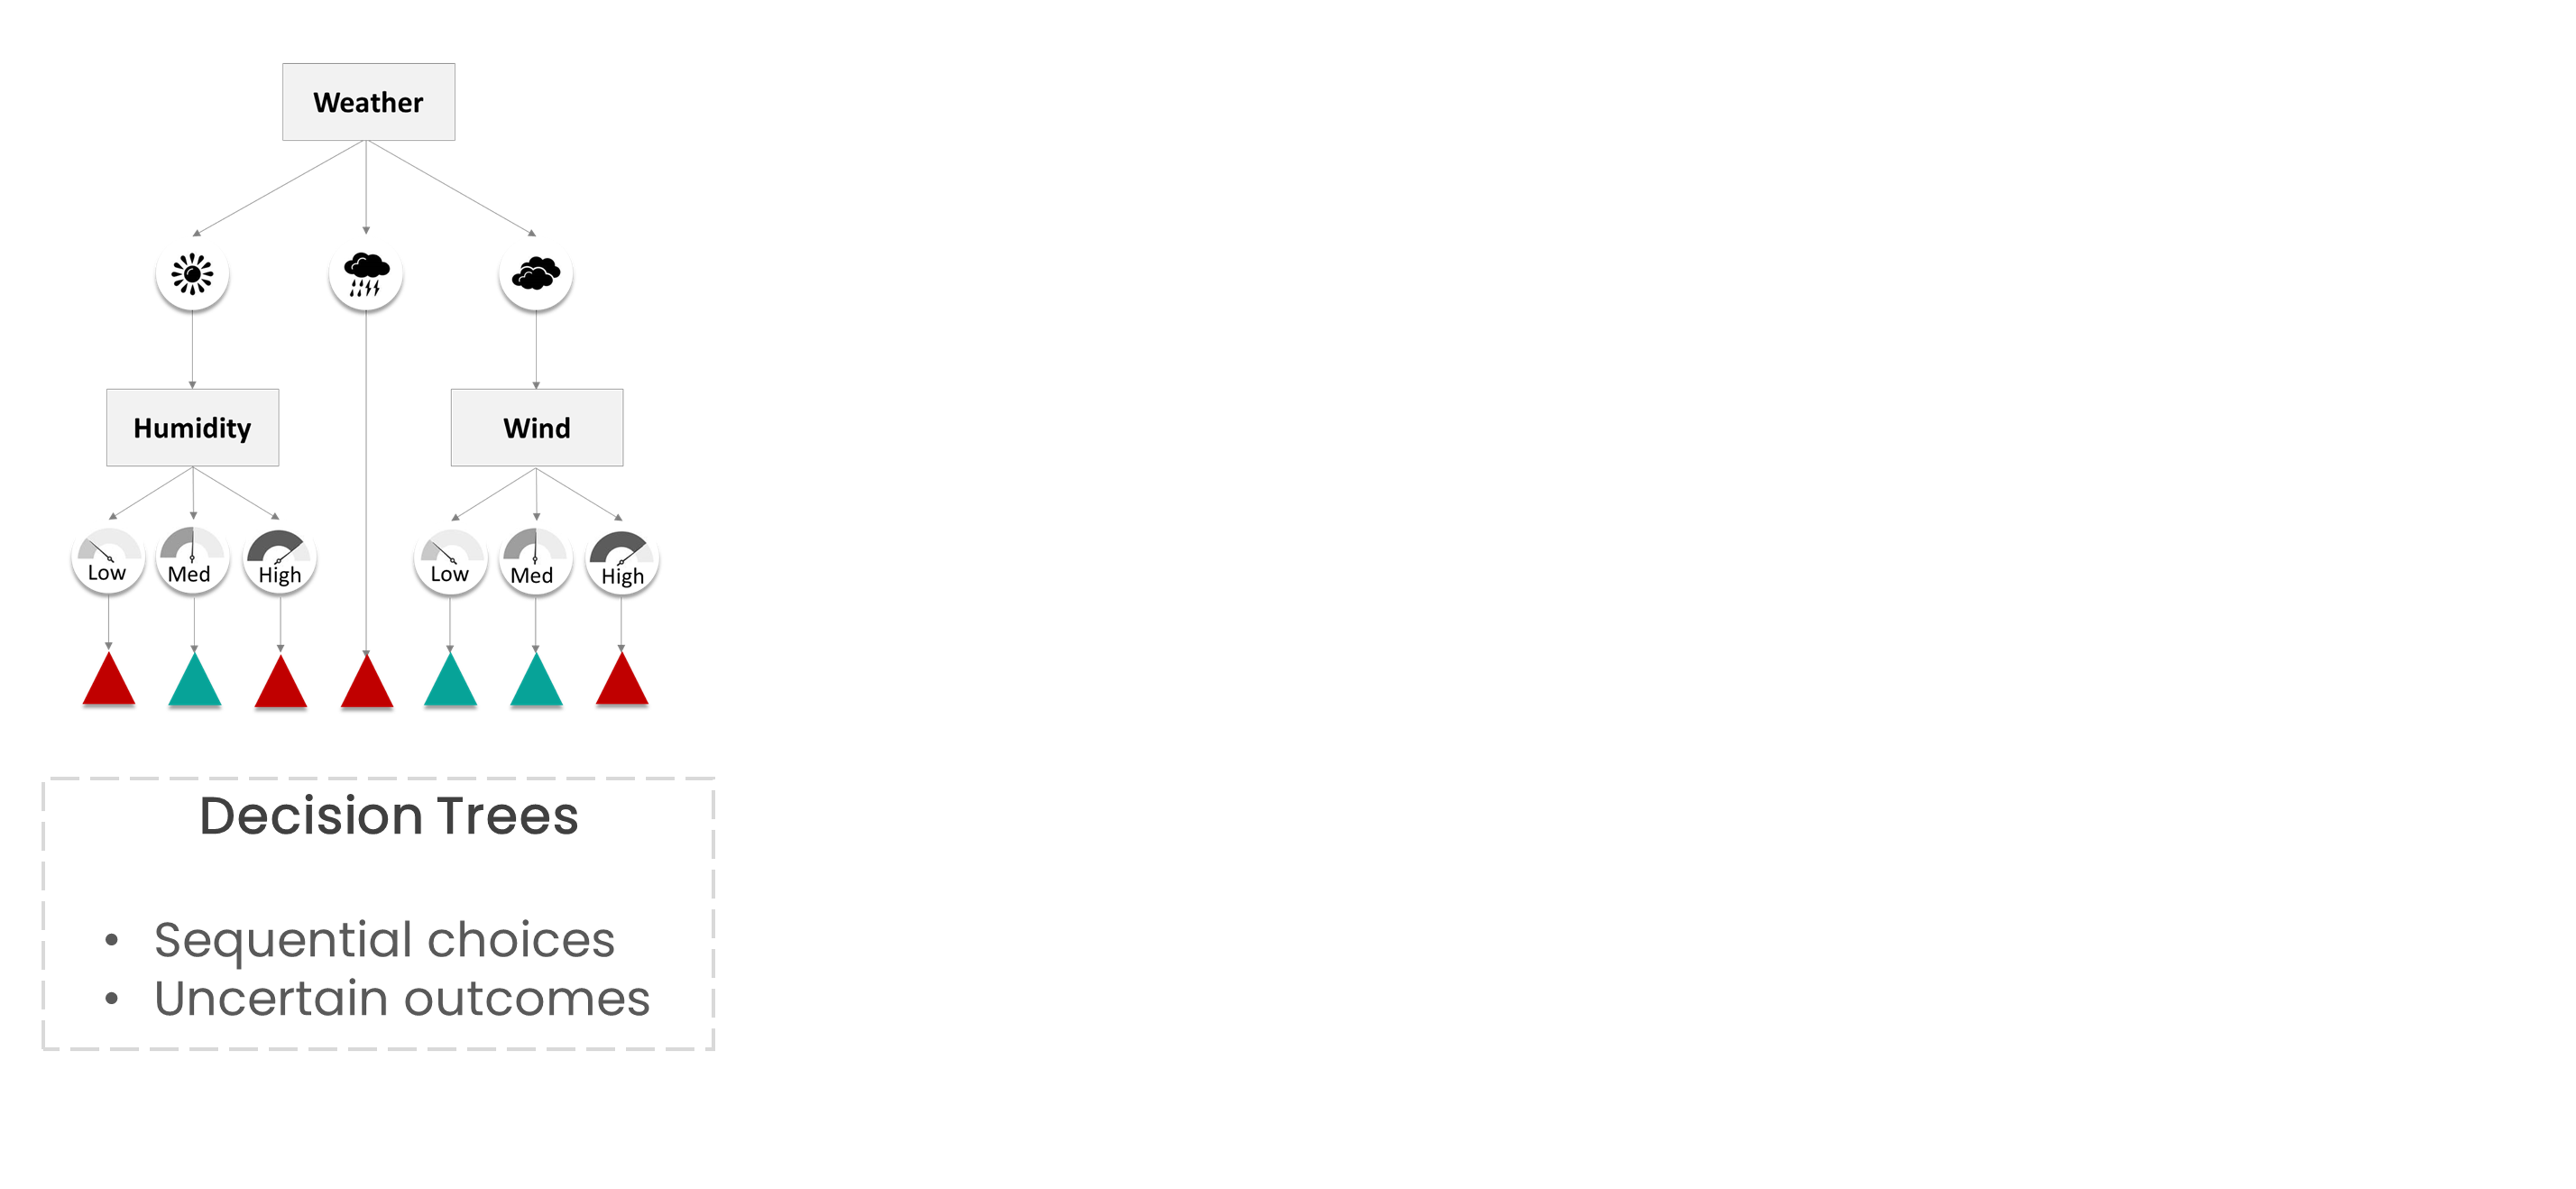
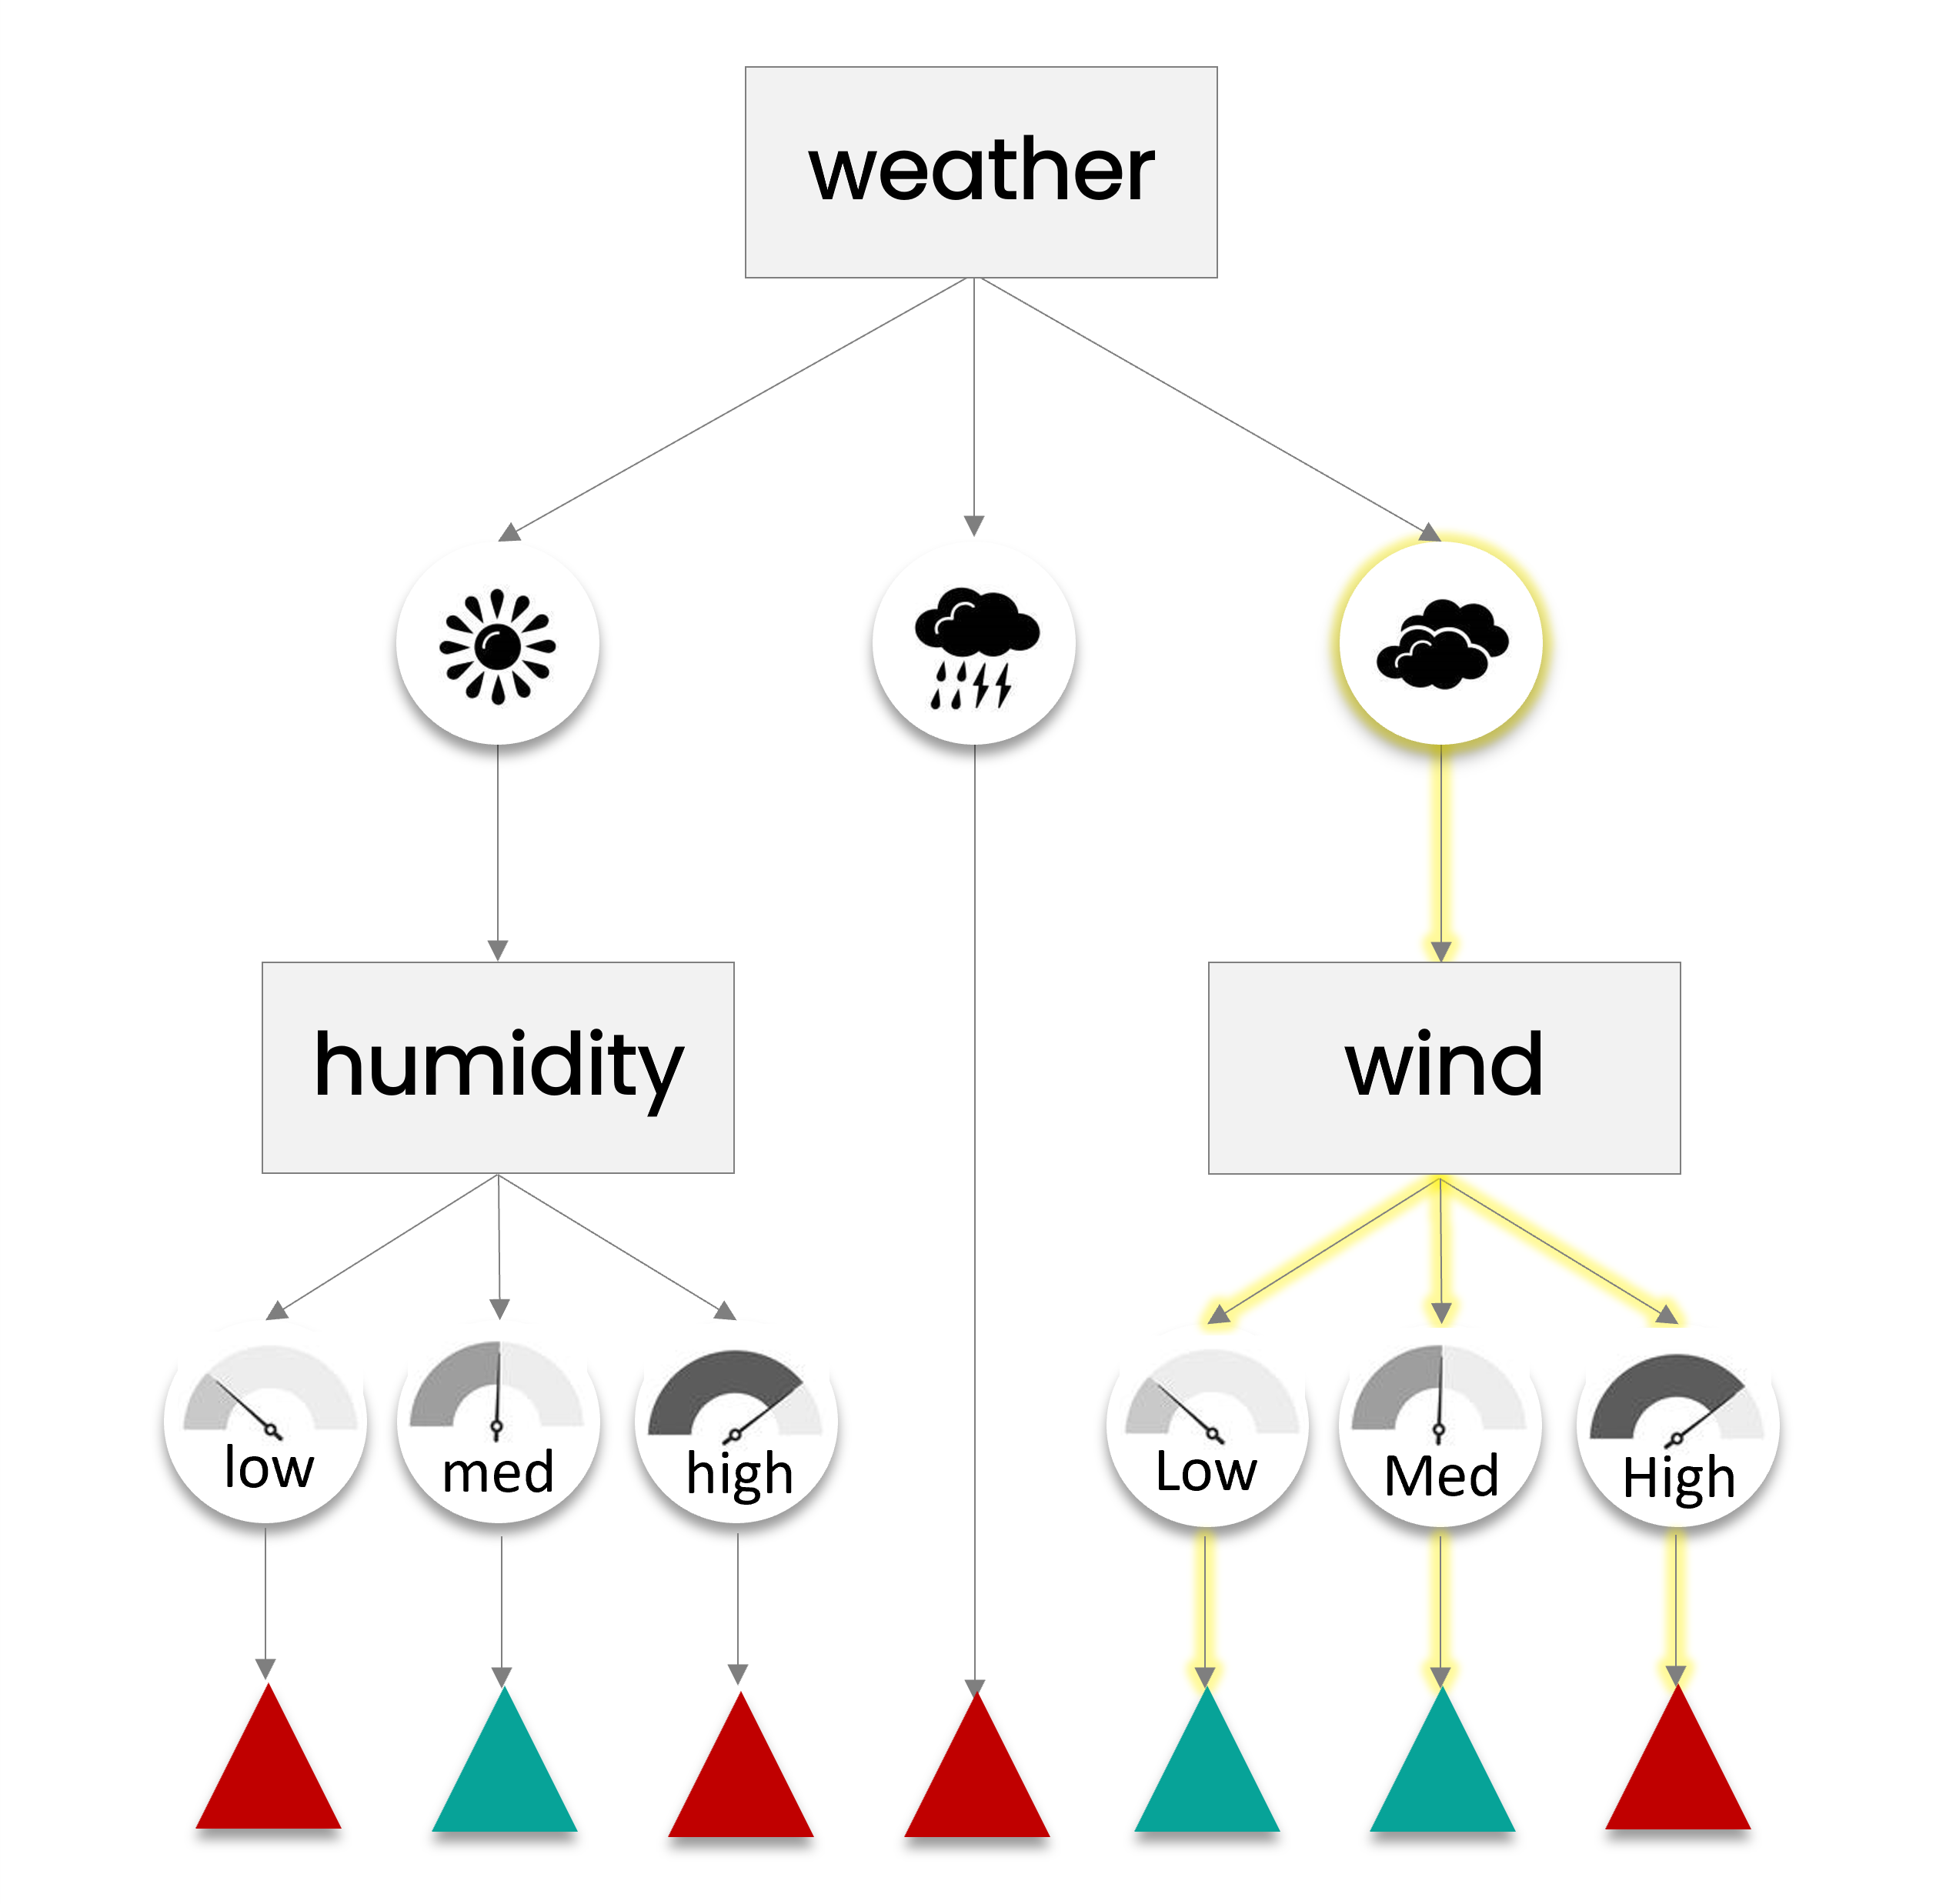
A Decision tree illustrating weather conditions, humidity and wind patterns.

Decoding Decision Modeling

Decision modeling techniques

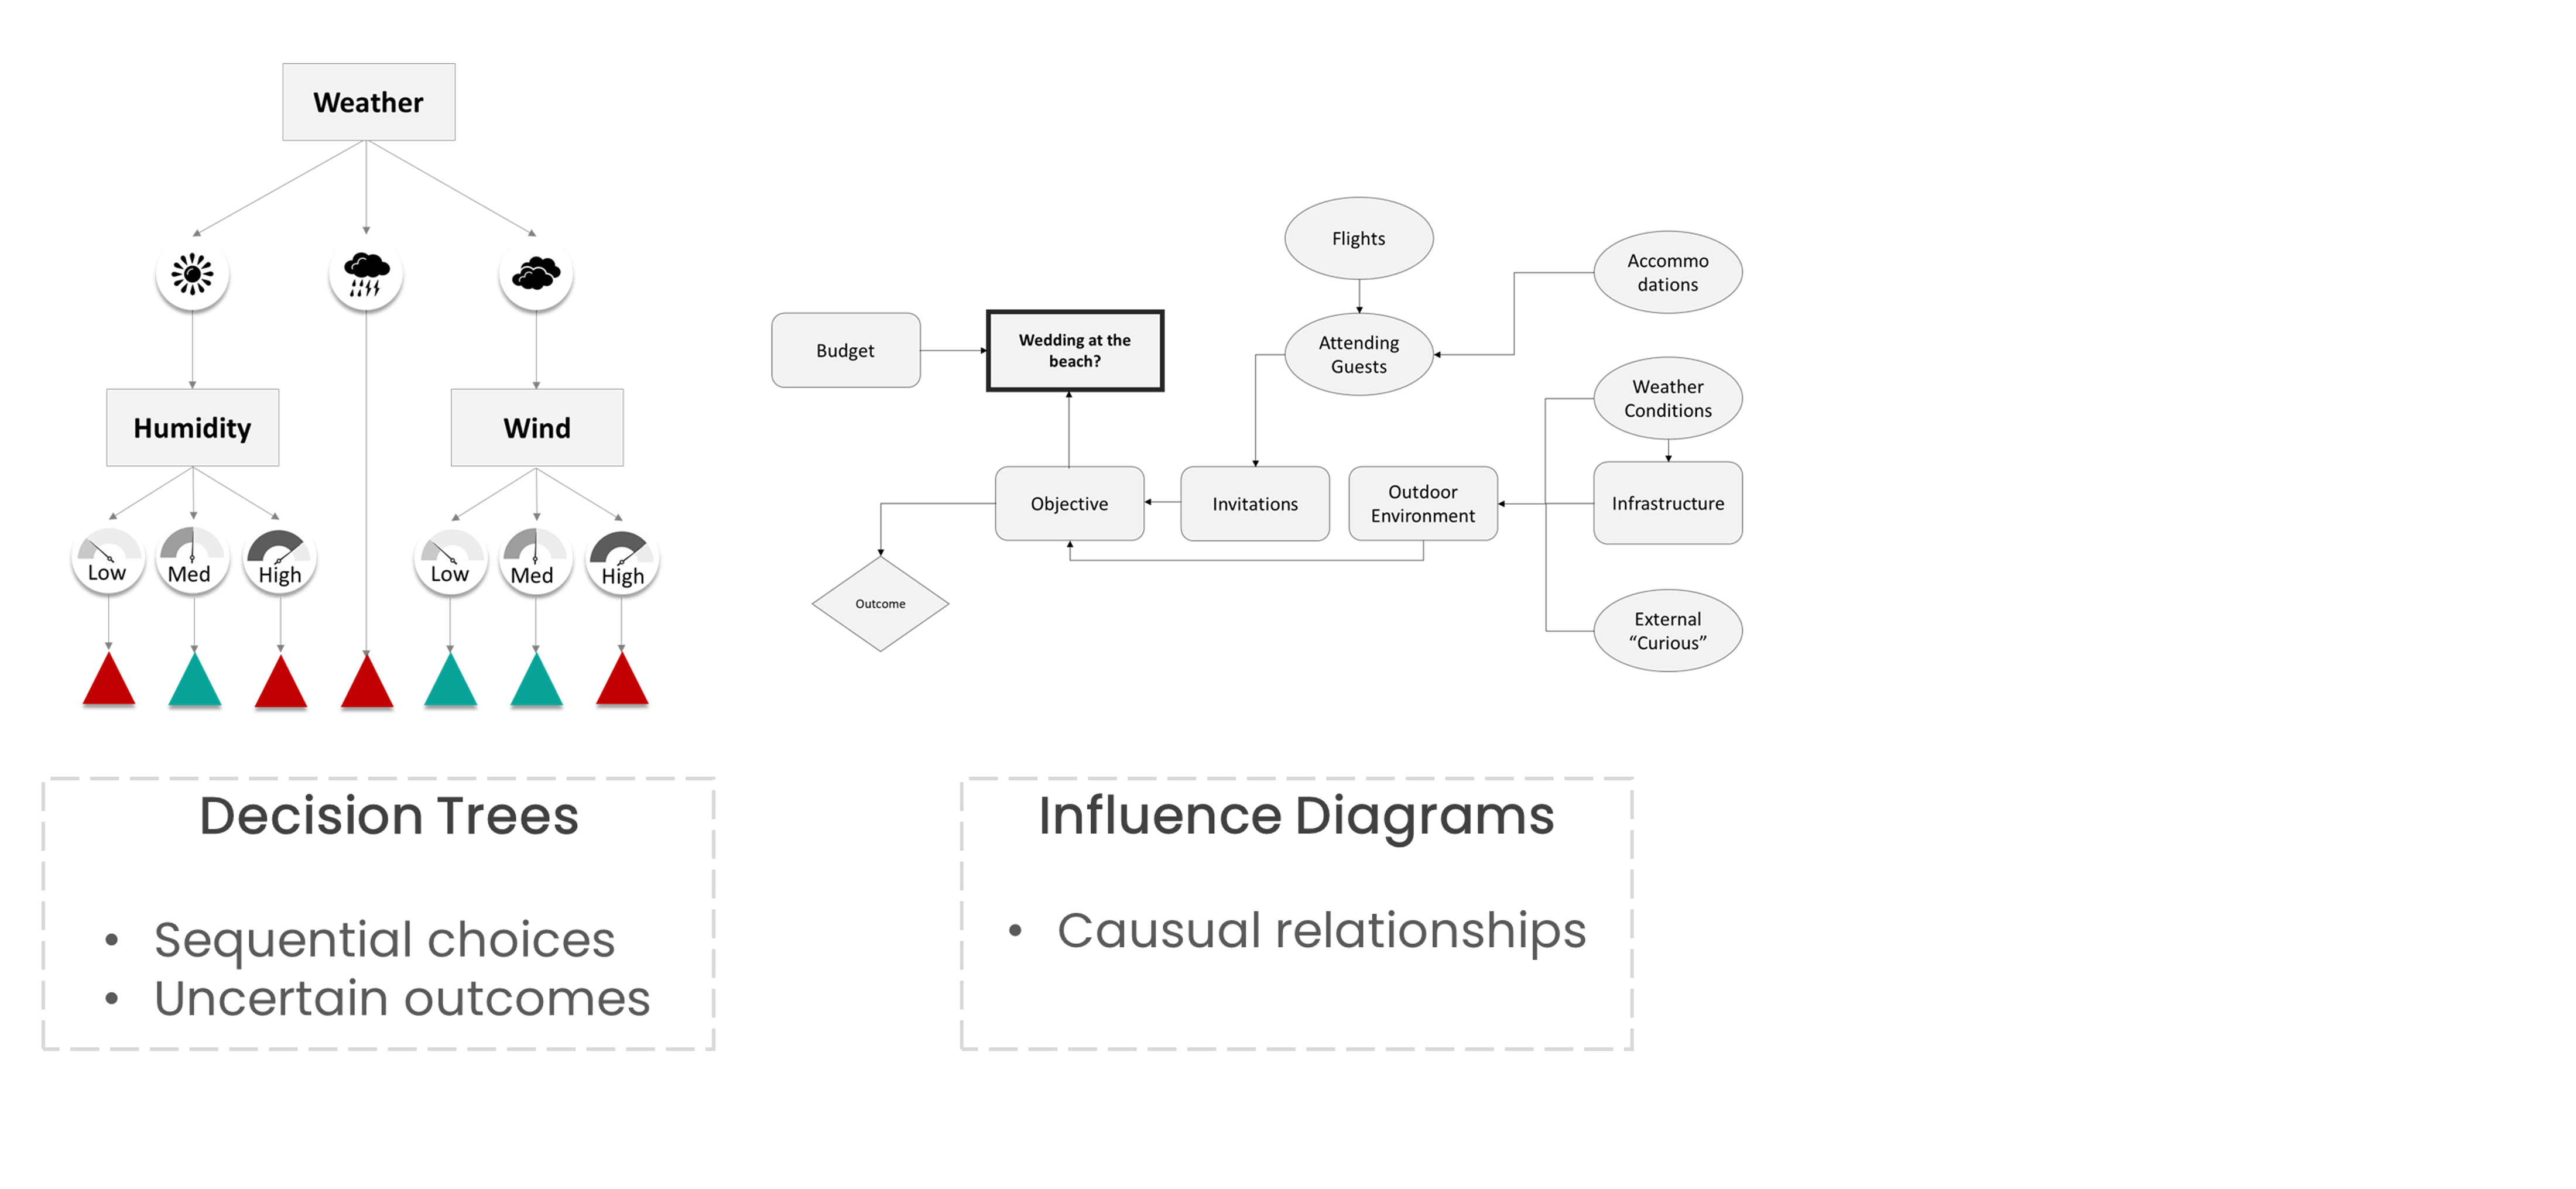
An example of an Influence Diagram illustrating the relationships between the components of the decision

Decoding Decision Modeling

Decision modeling techniques

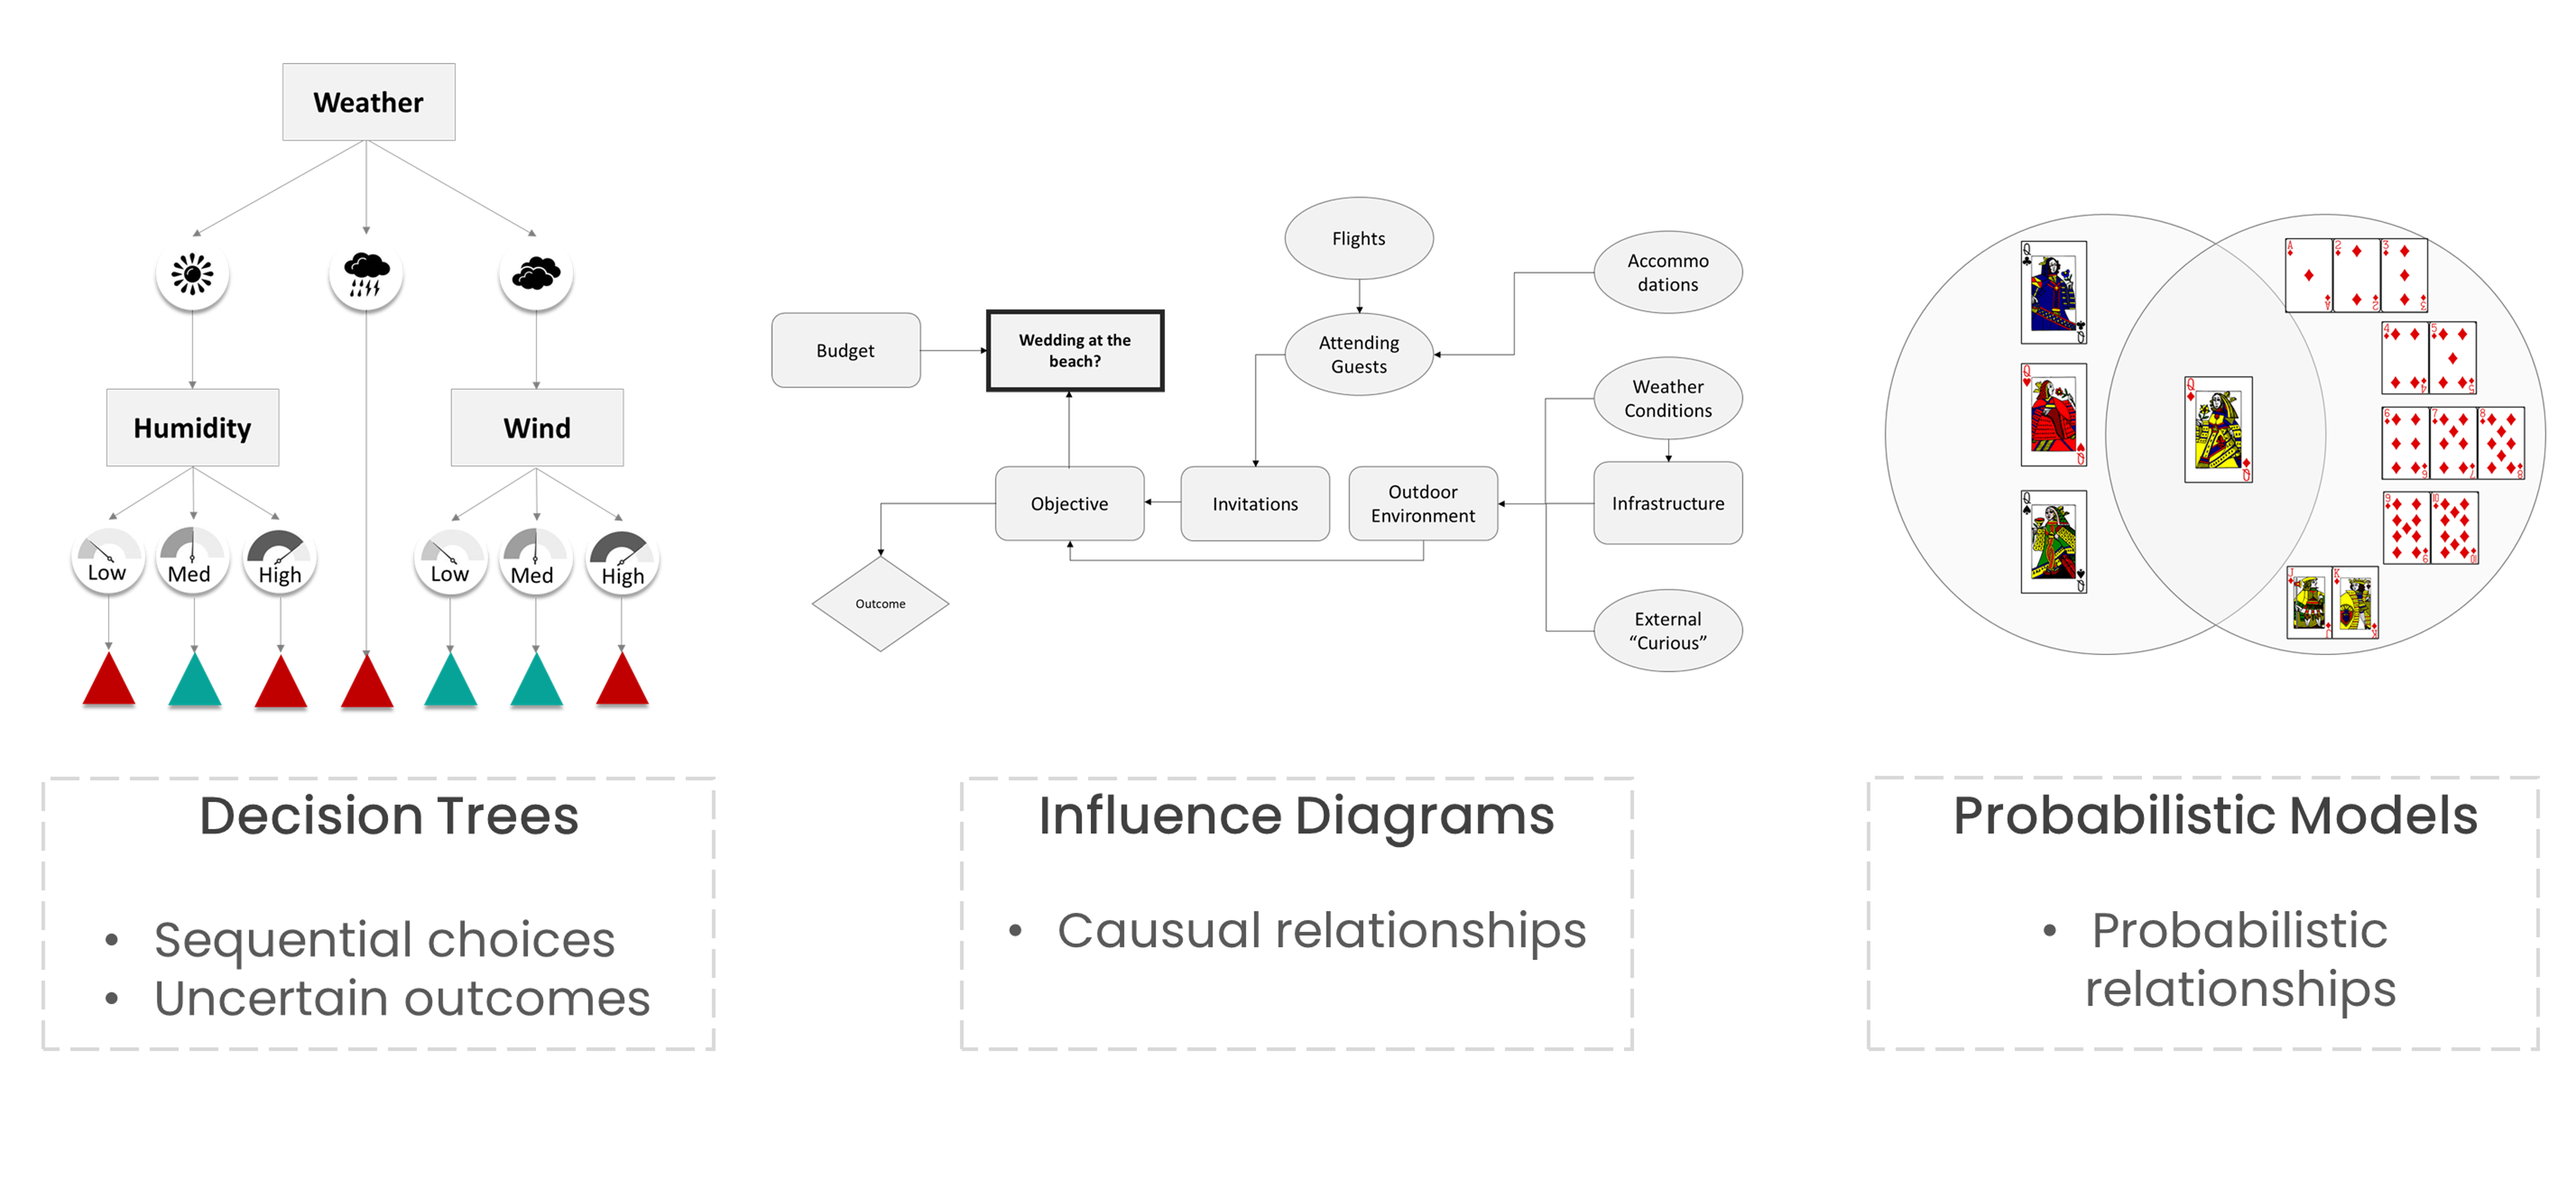
A Ven-Diagram with playing cards illustrating probabilistic relationships

Decoding Decision Modeling

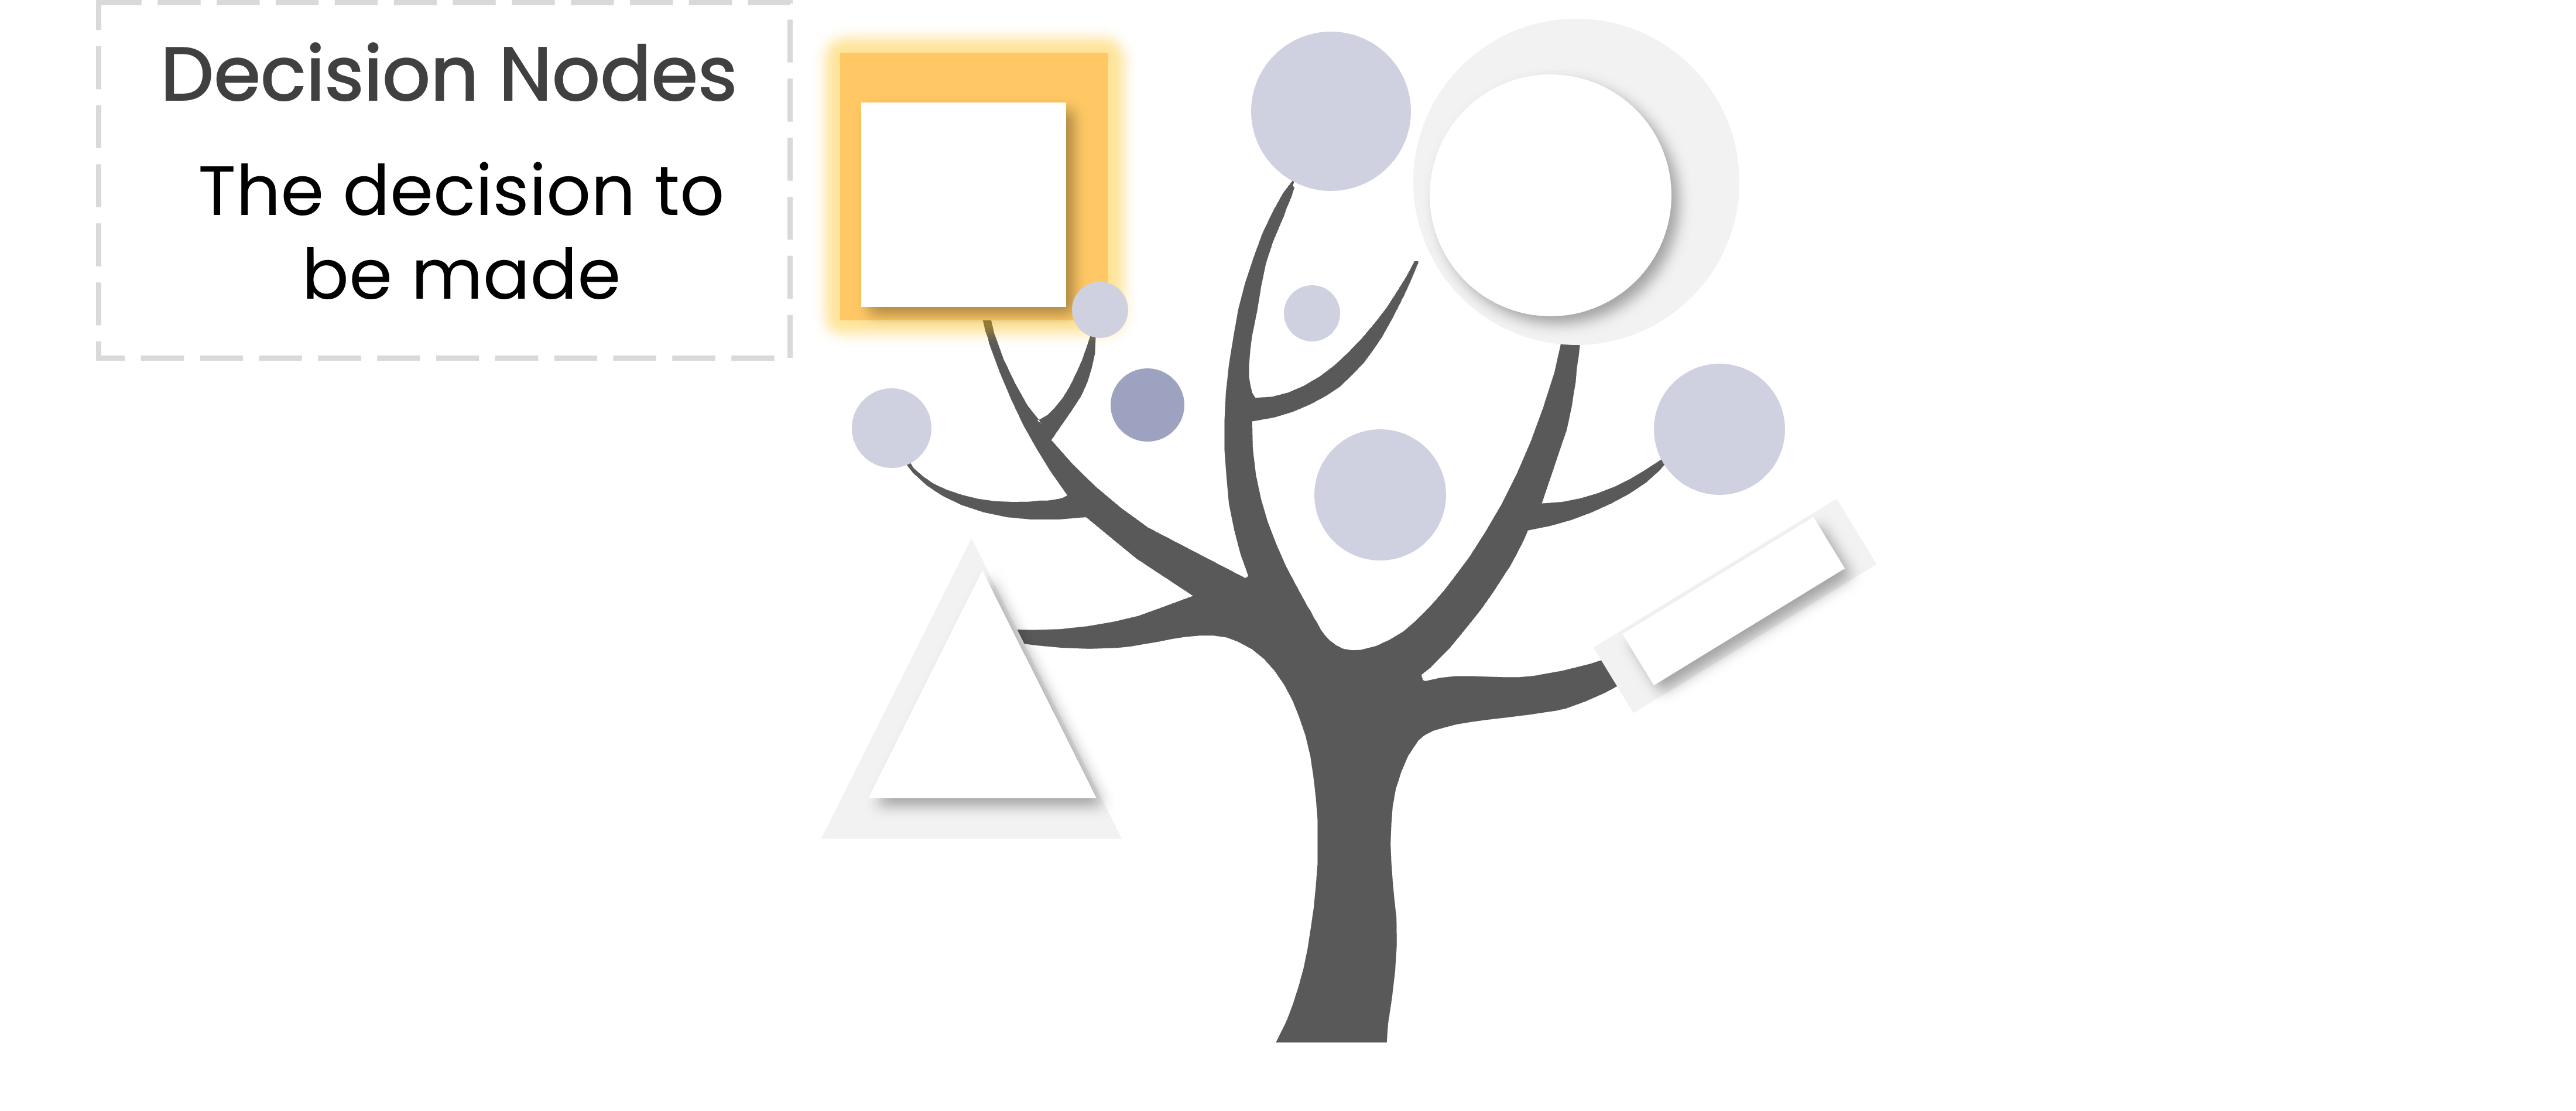
Decision Trees

A white rectangle with a white outline to facilitate the slide formatting A tree with a square on its branch highlighted in yellow

Decoding Decision Modeling

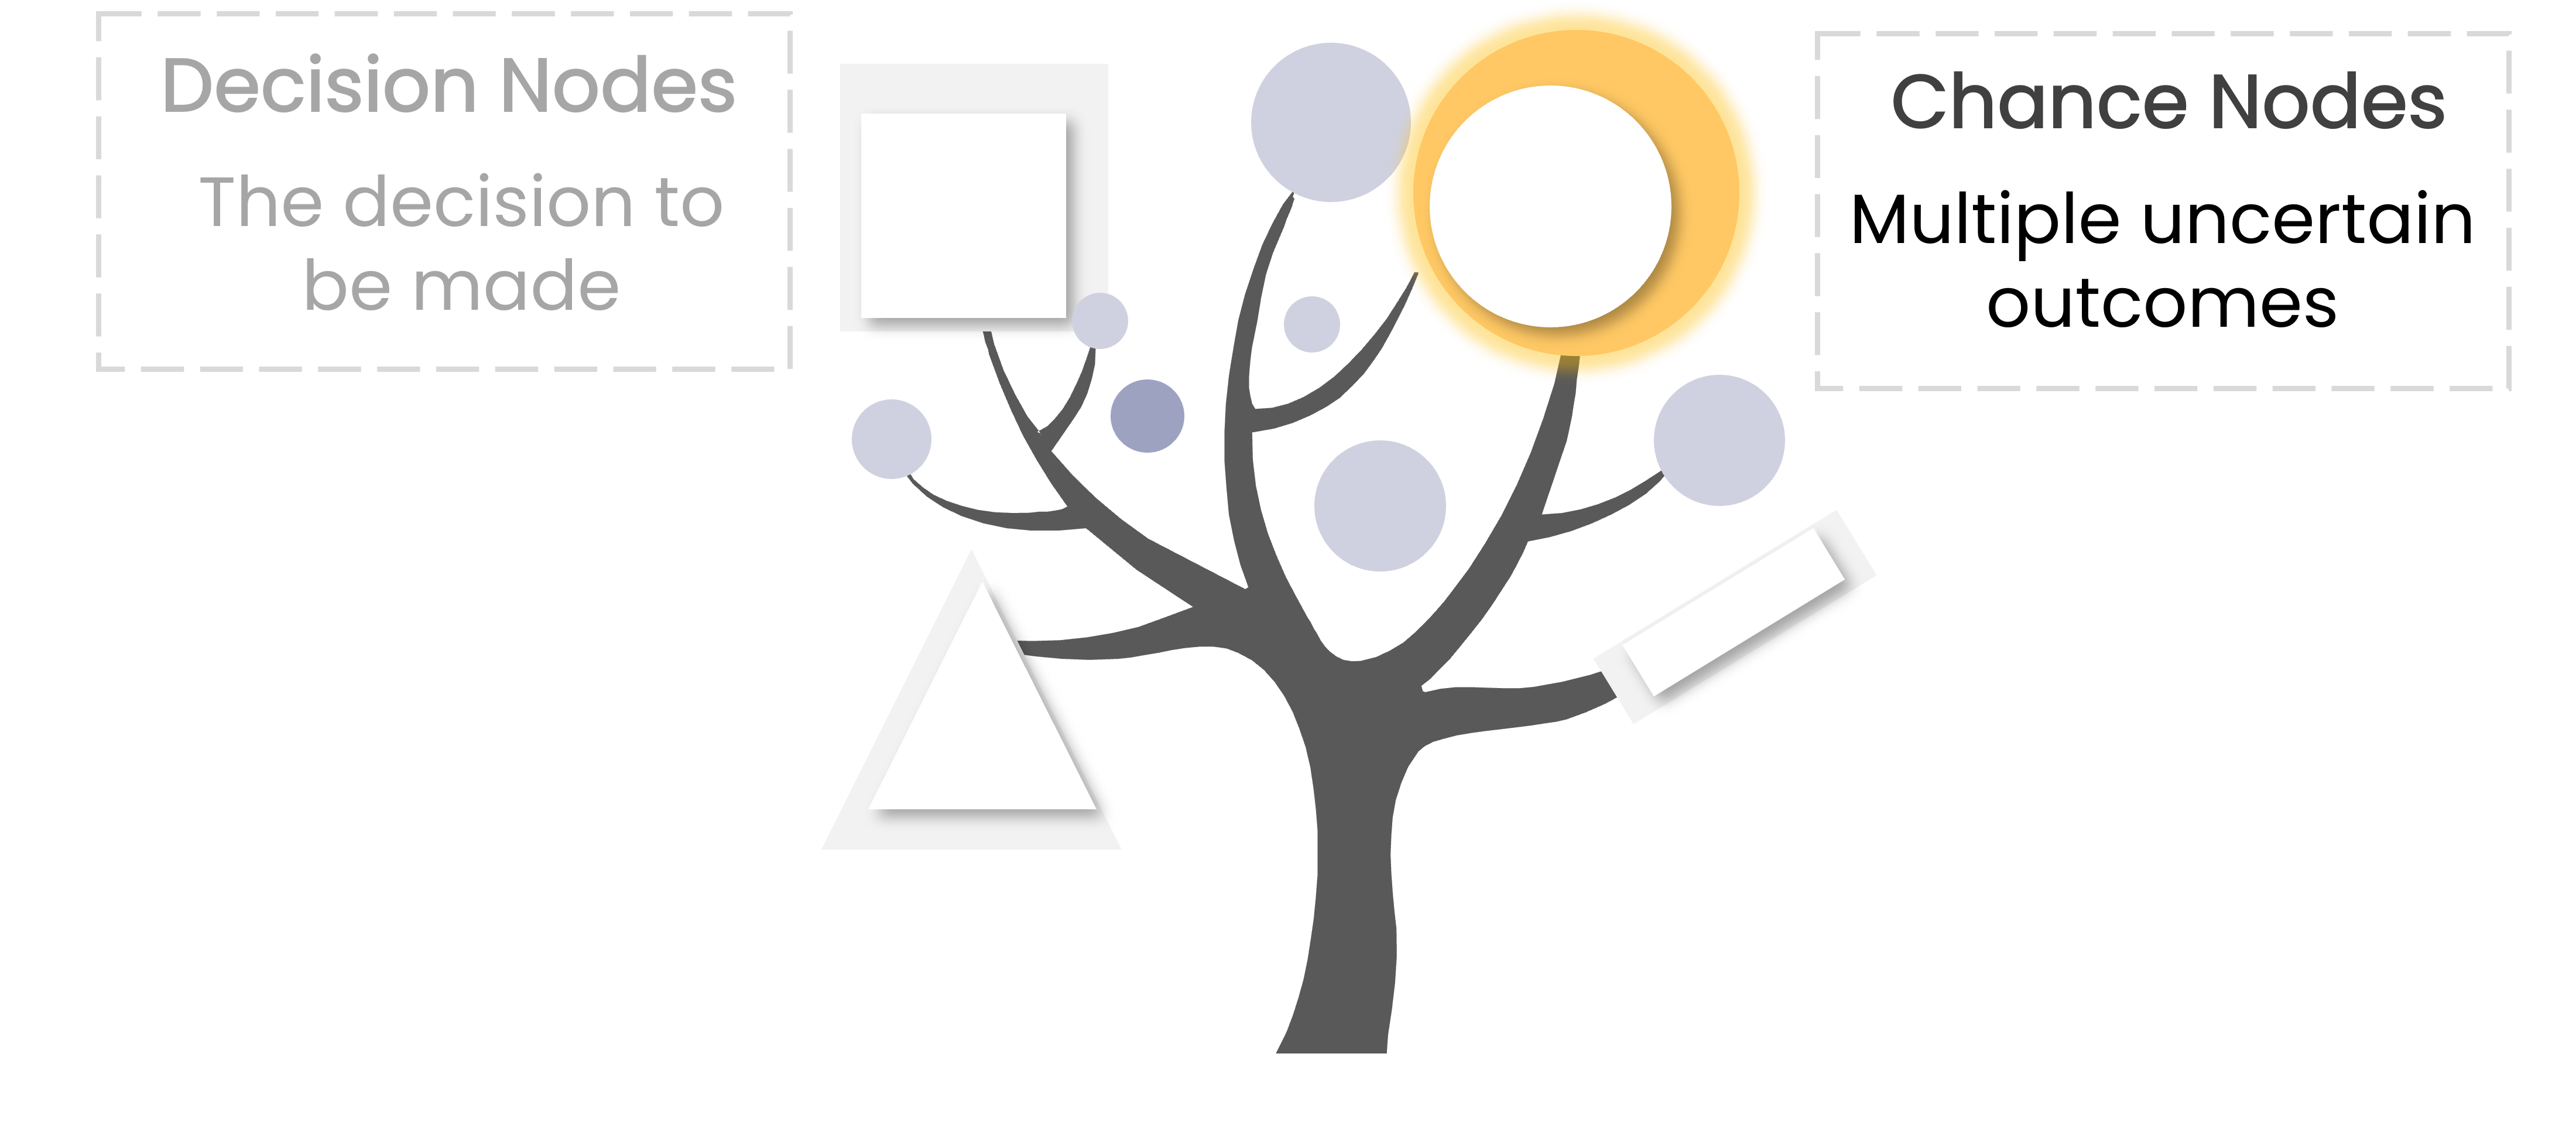
Decision Trees

A white rectangle with a white outline to facilitate the slide formating A tree with a circle on its branch highlighted in yellow

Decoding Decision Modeling

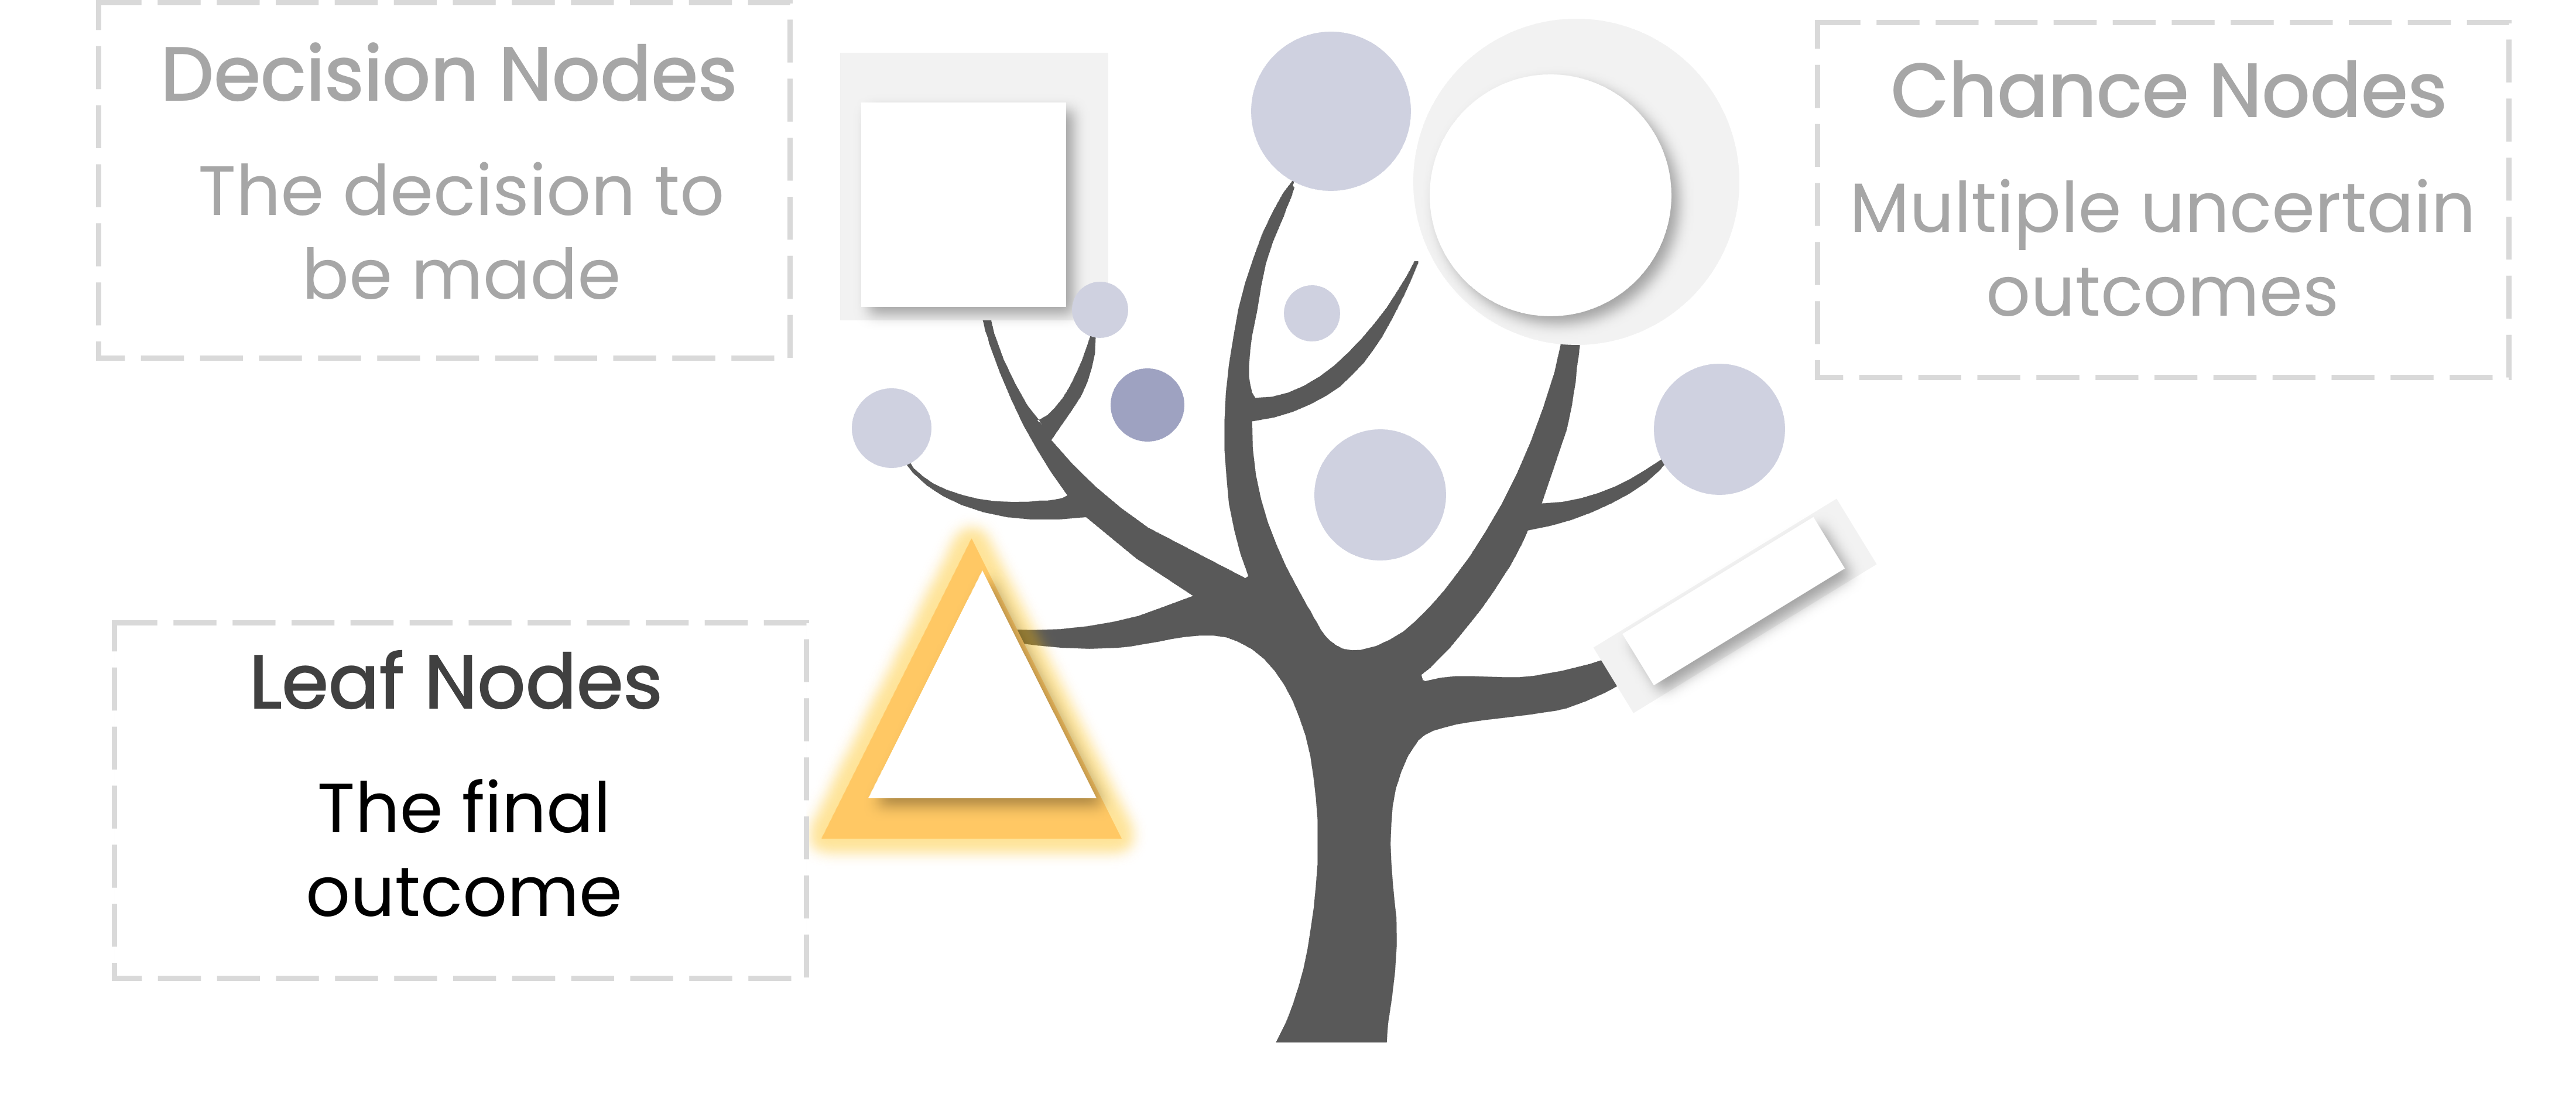
Decision Trees

A white rectangle with a white outline to facilitate the slide formating A tree with a triangle on its branch highlighted in yellow

Decoding Decision Modeling

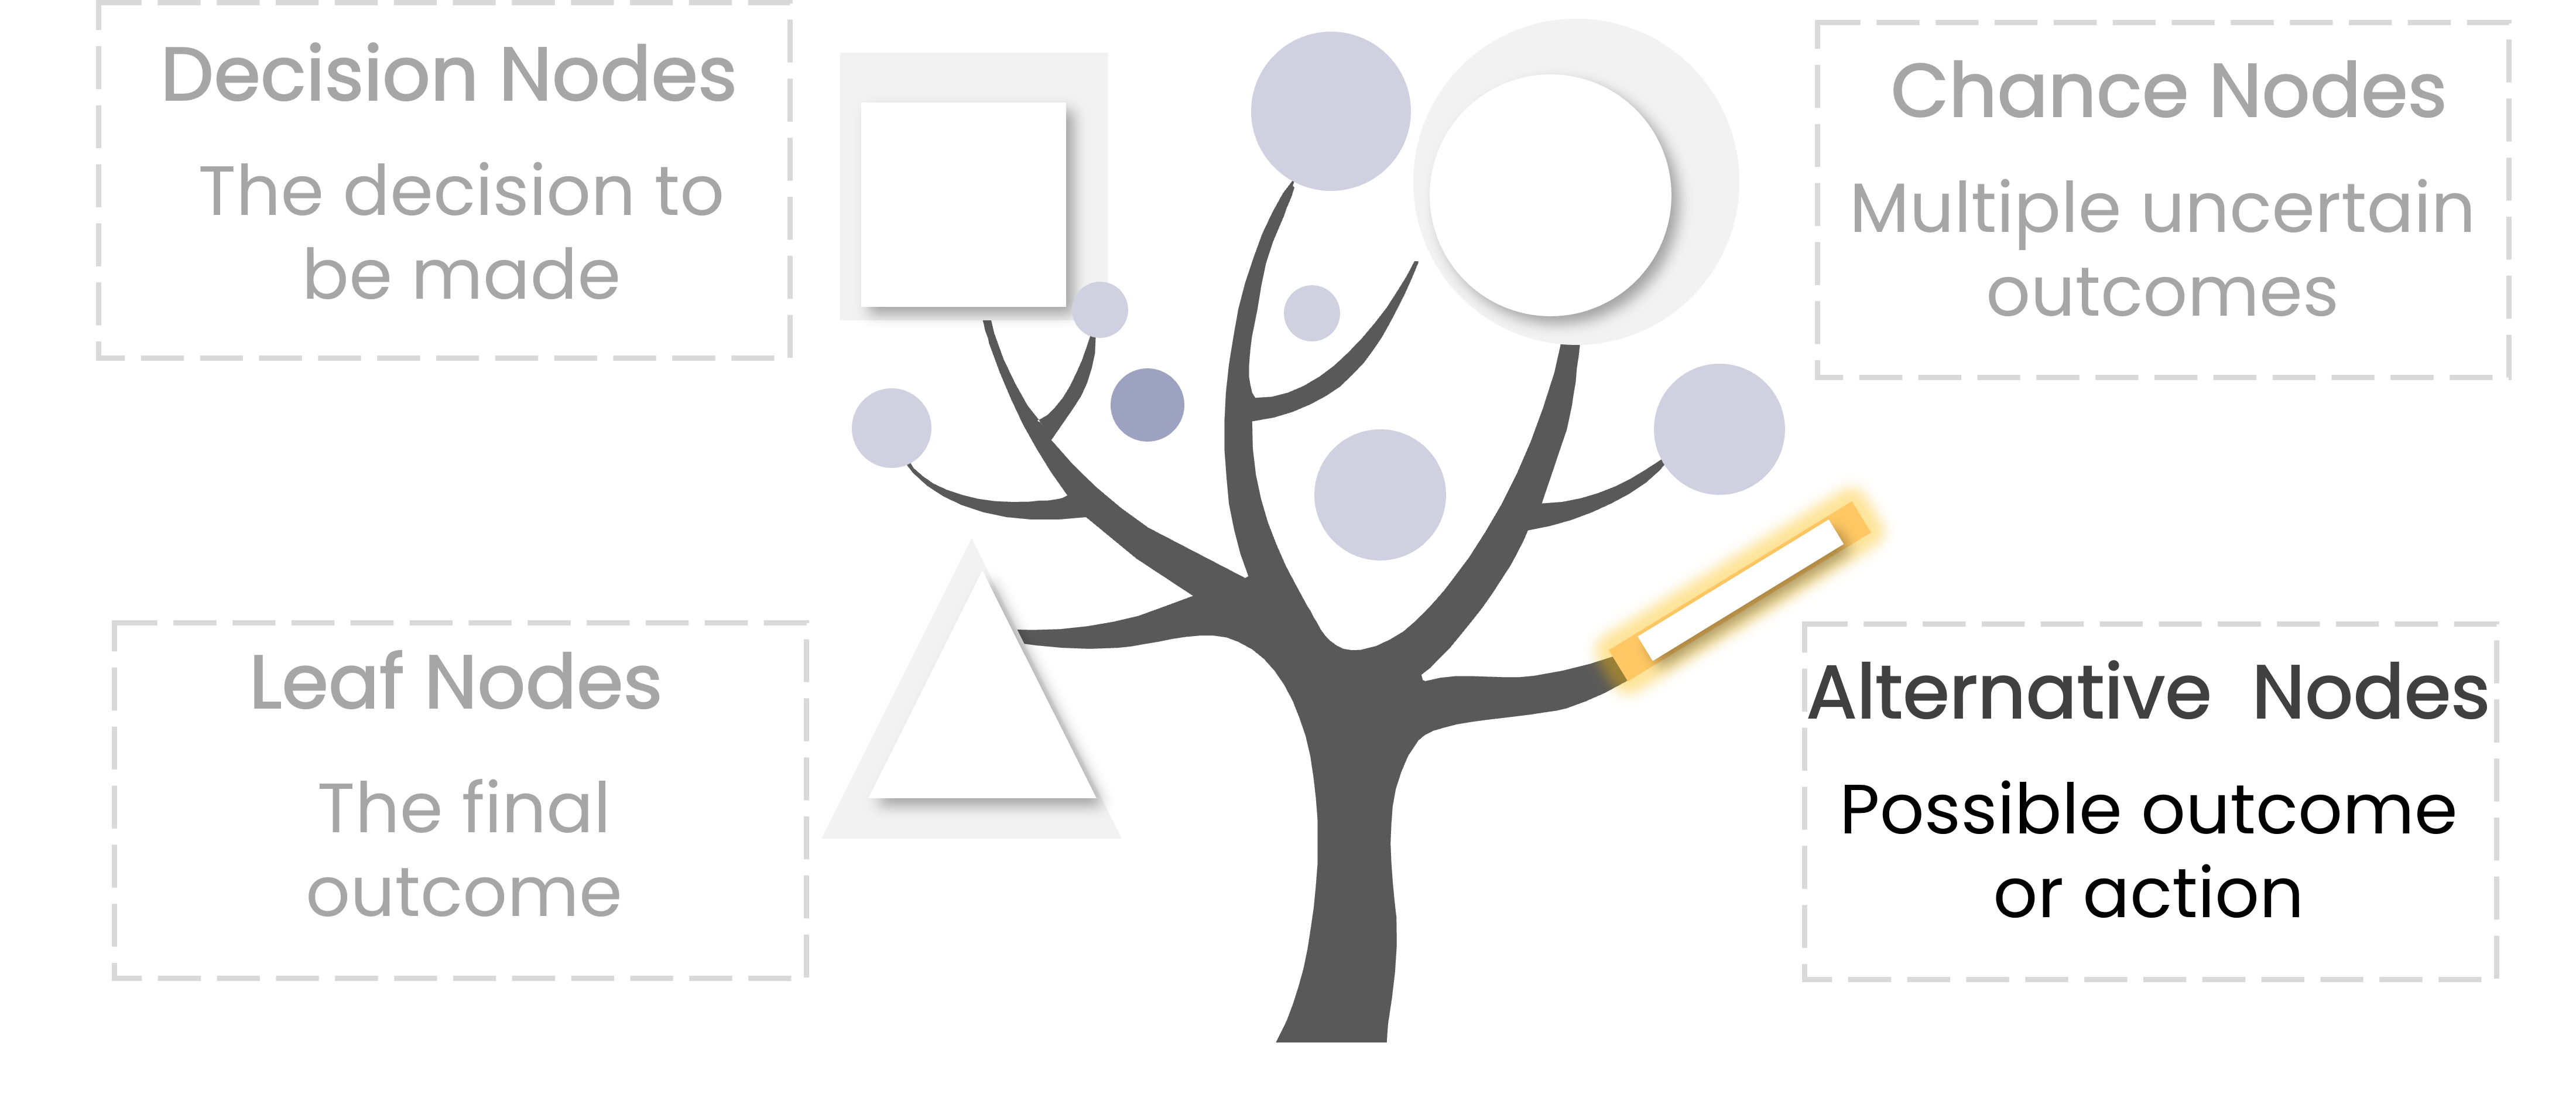
Decision Trees

A white rectangle with a white outline to facilitate the slide formating A tree with a line on its branch highlighted in yellow

Decoding Decision Modeling

Applying a Decision Tree

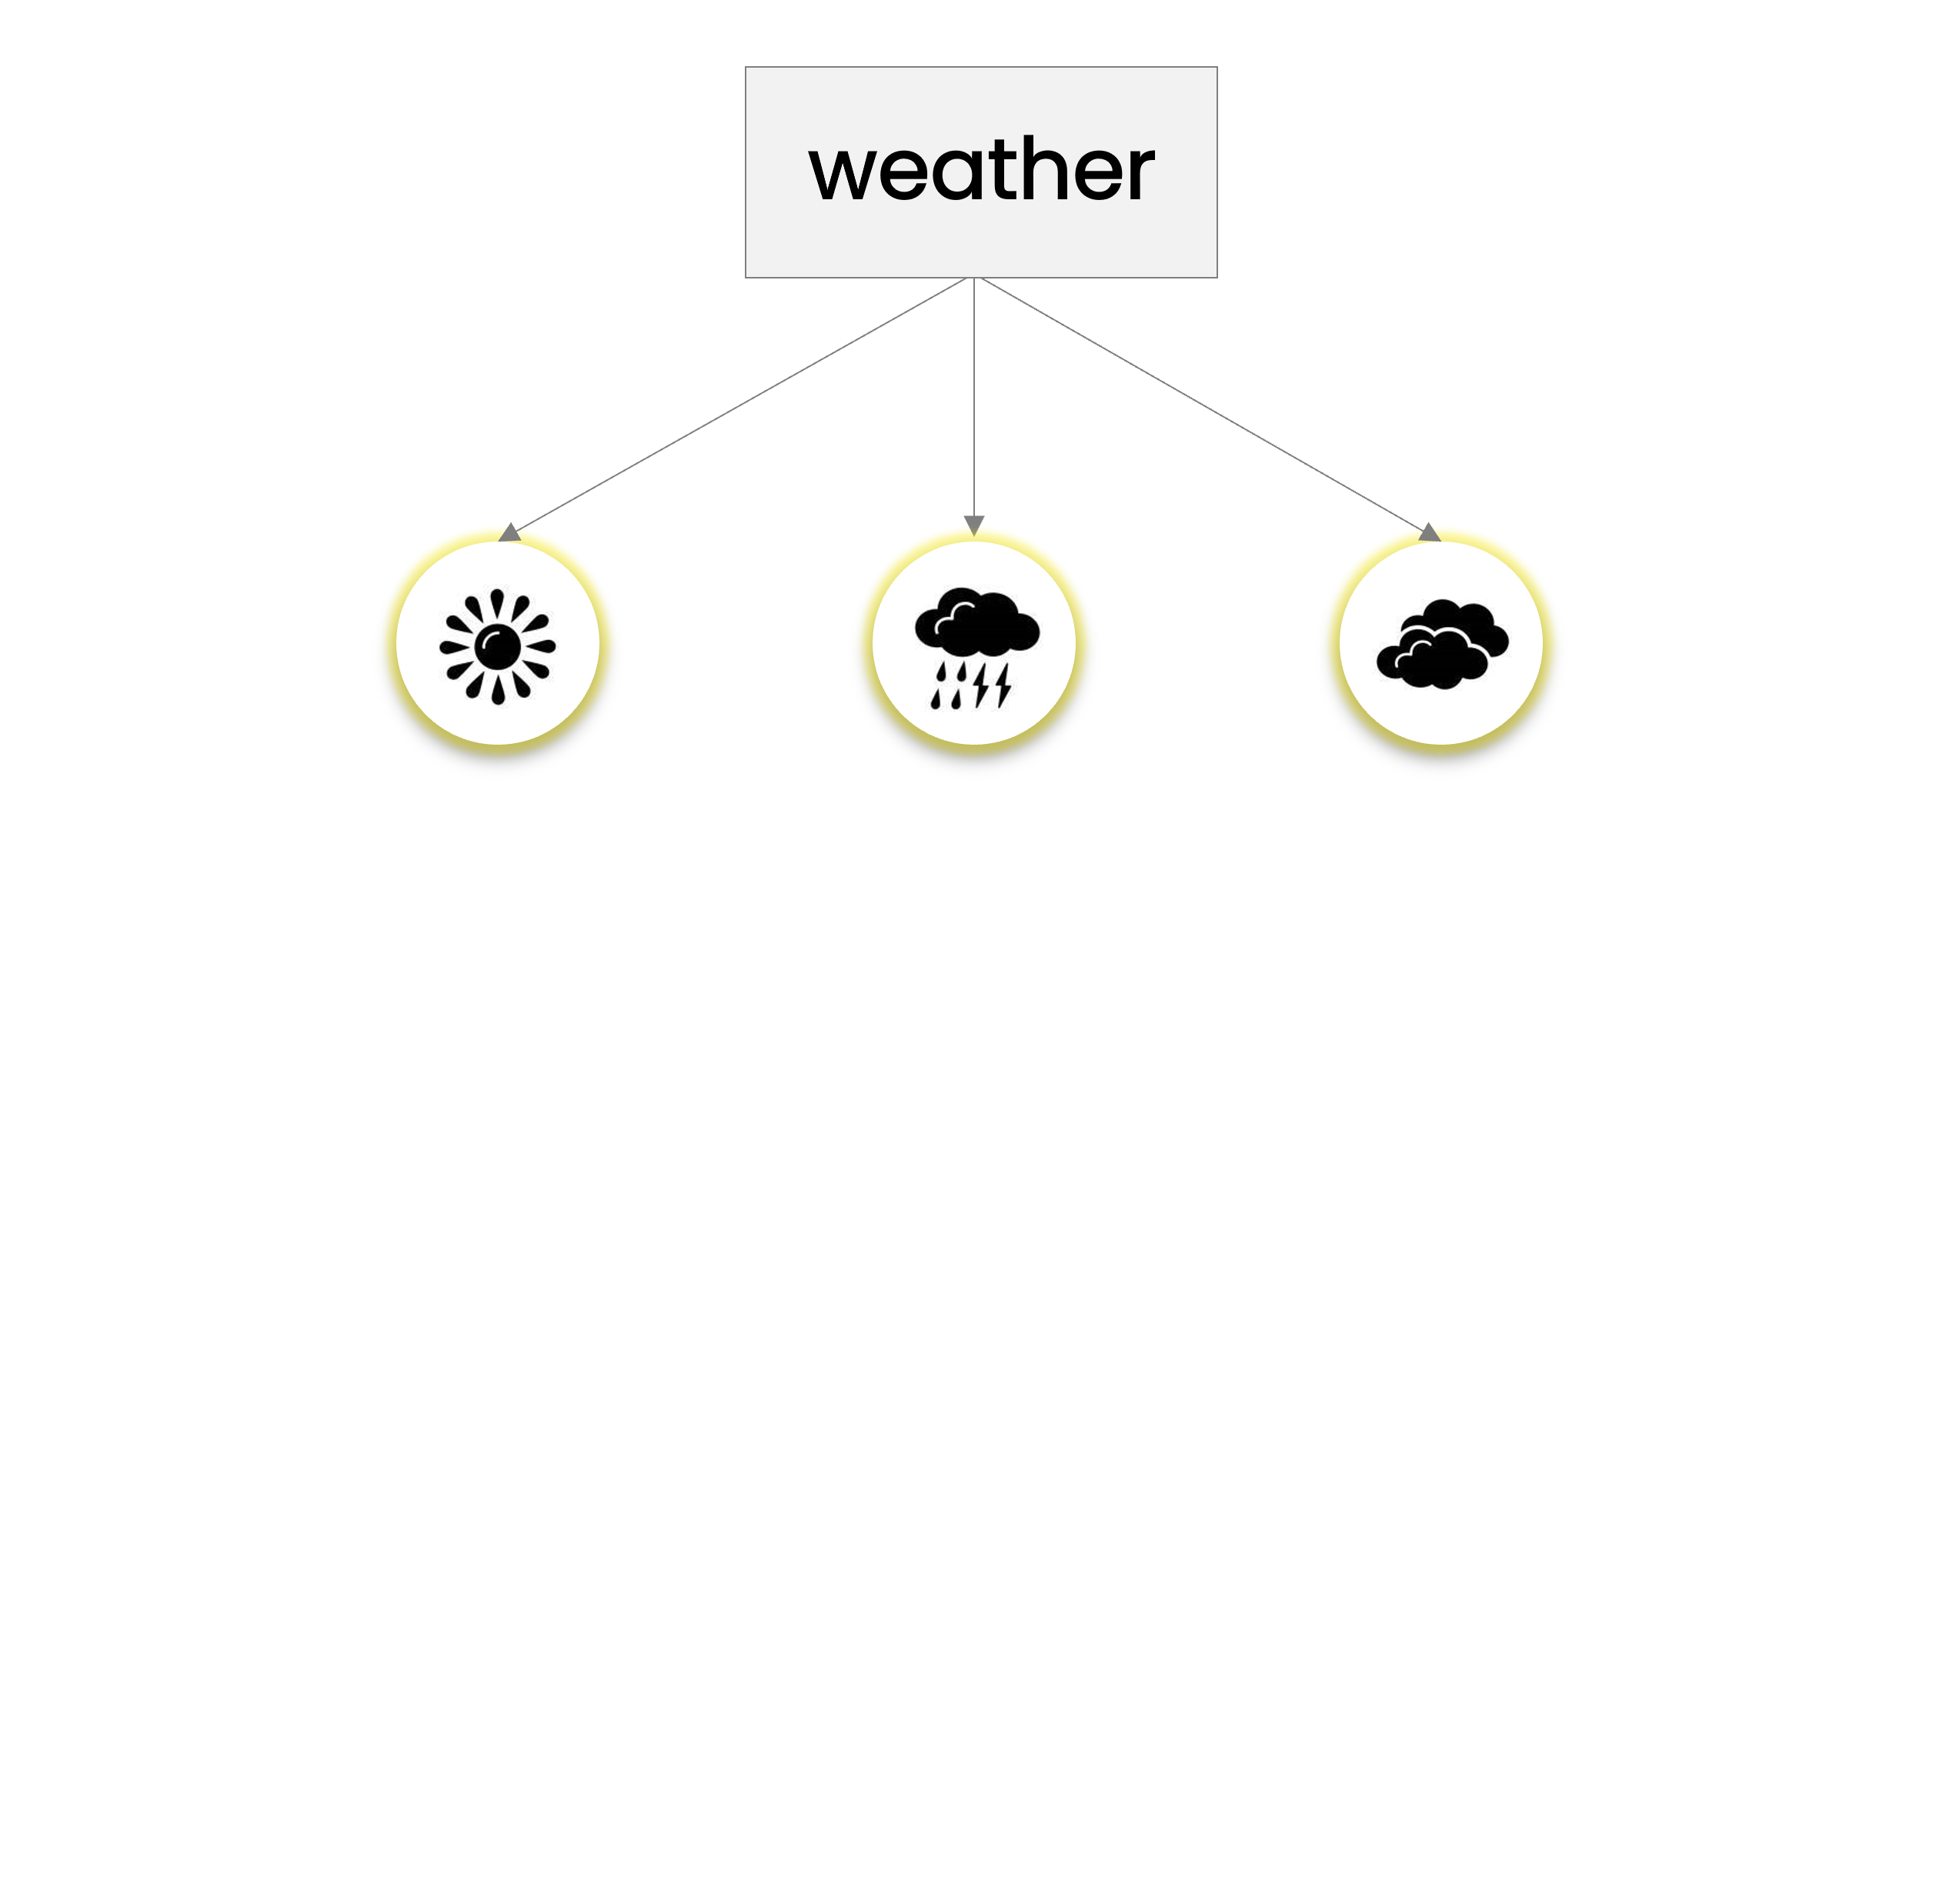
The top branch of the Decision Tree with the node "Weather" and three icon of sun, rain and cloud

Decoding Decision Modeling

Applying a Decision Tree

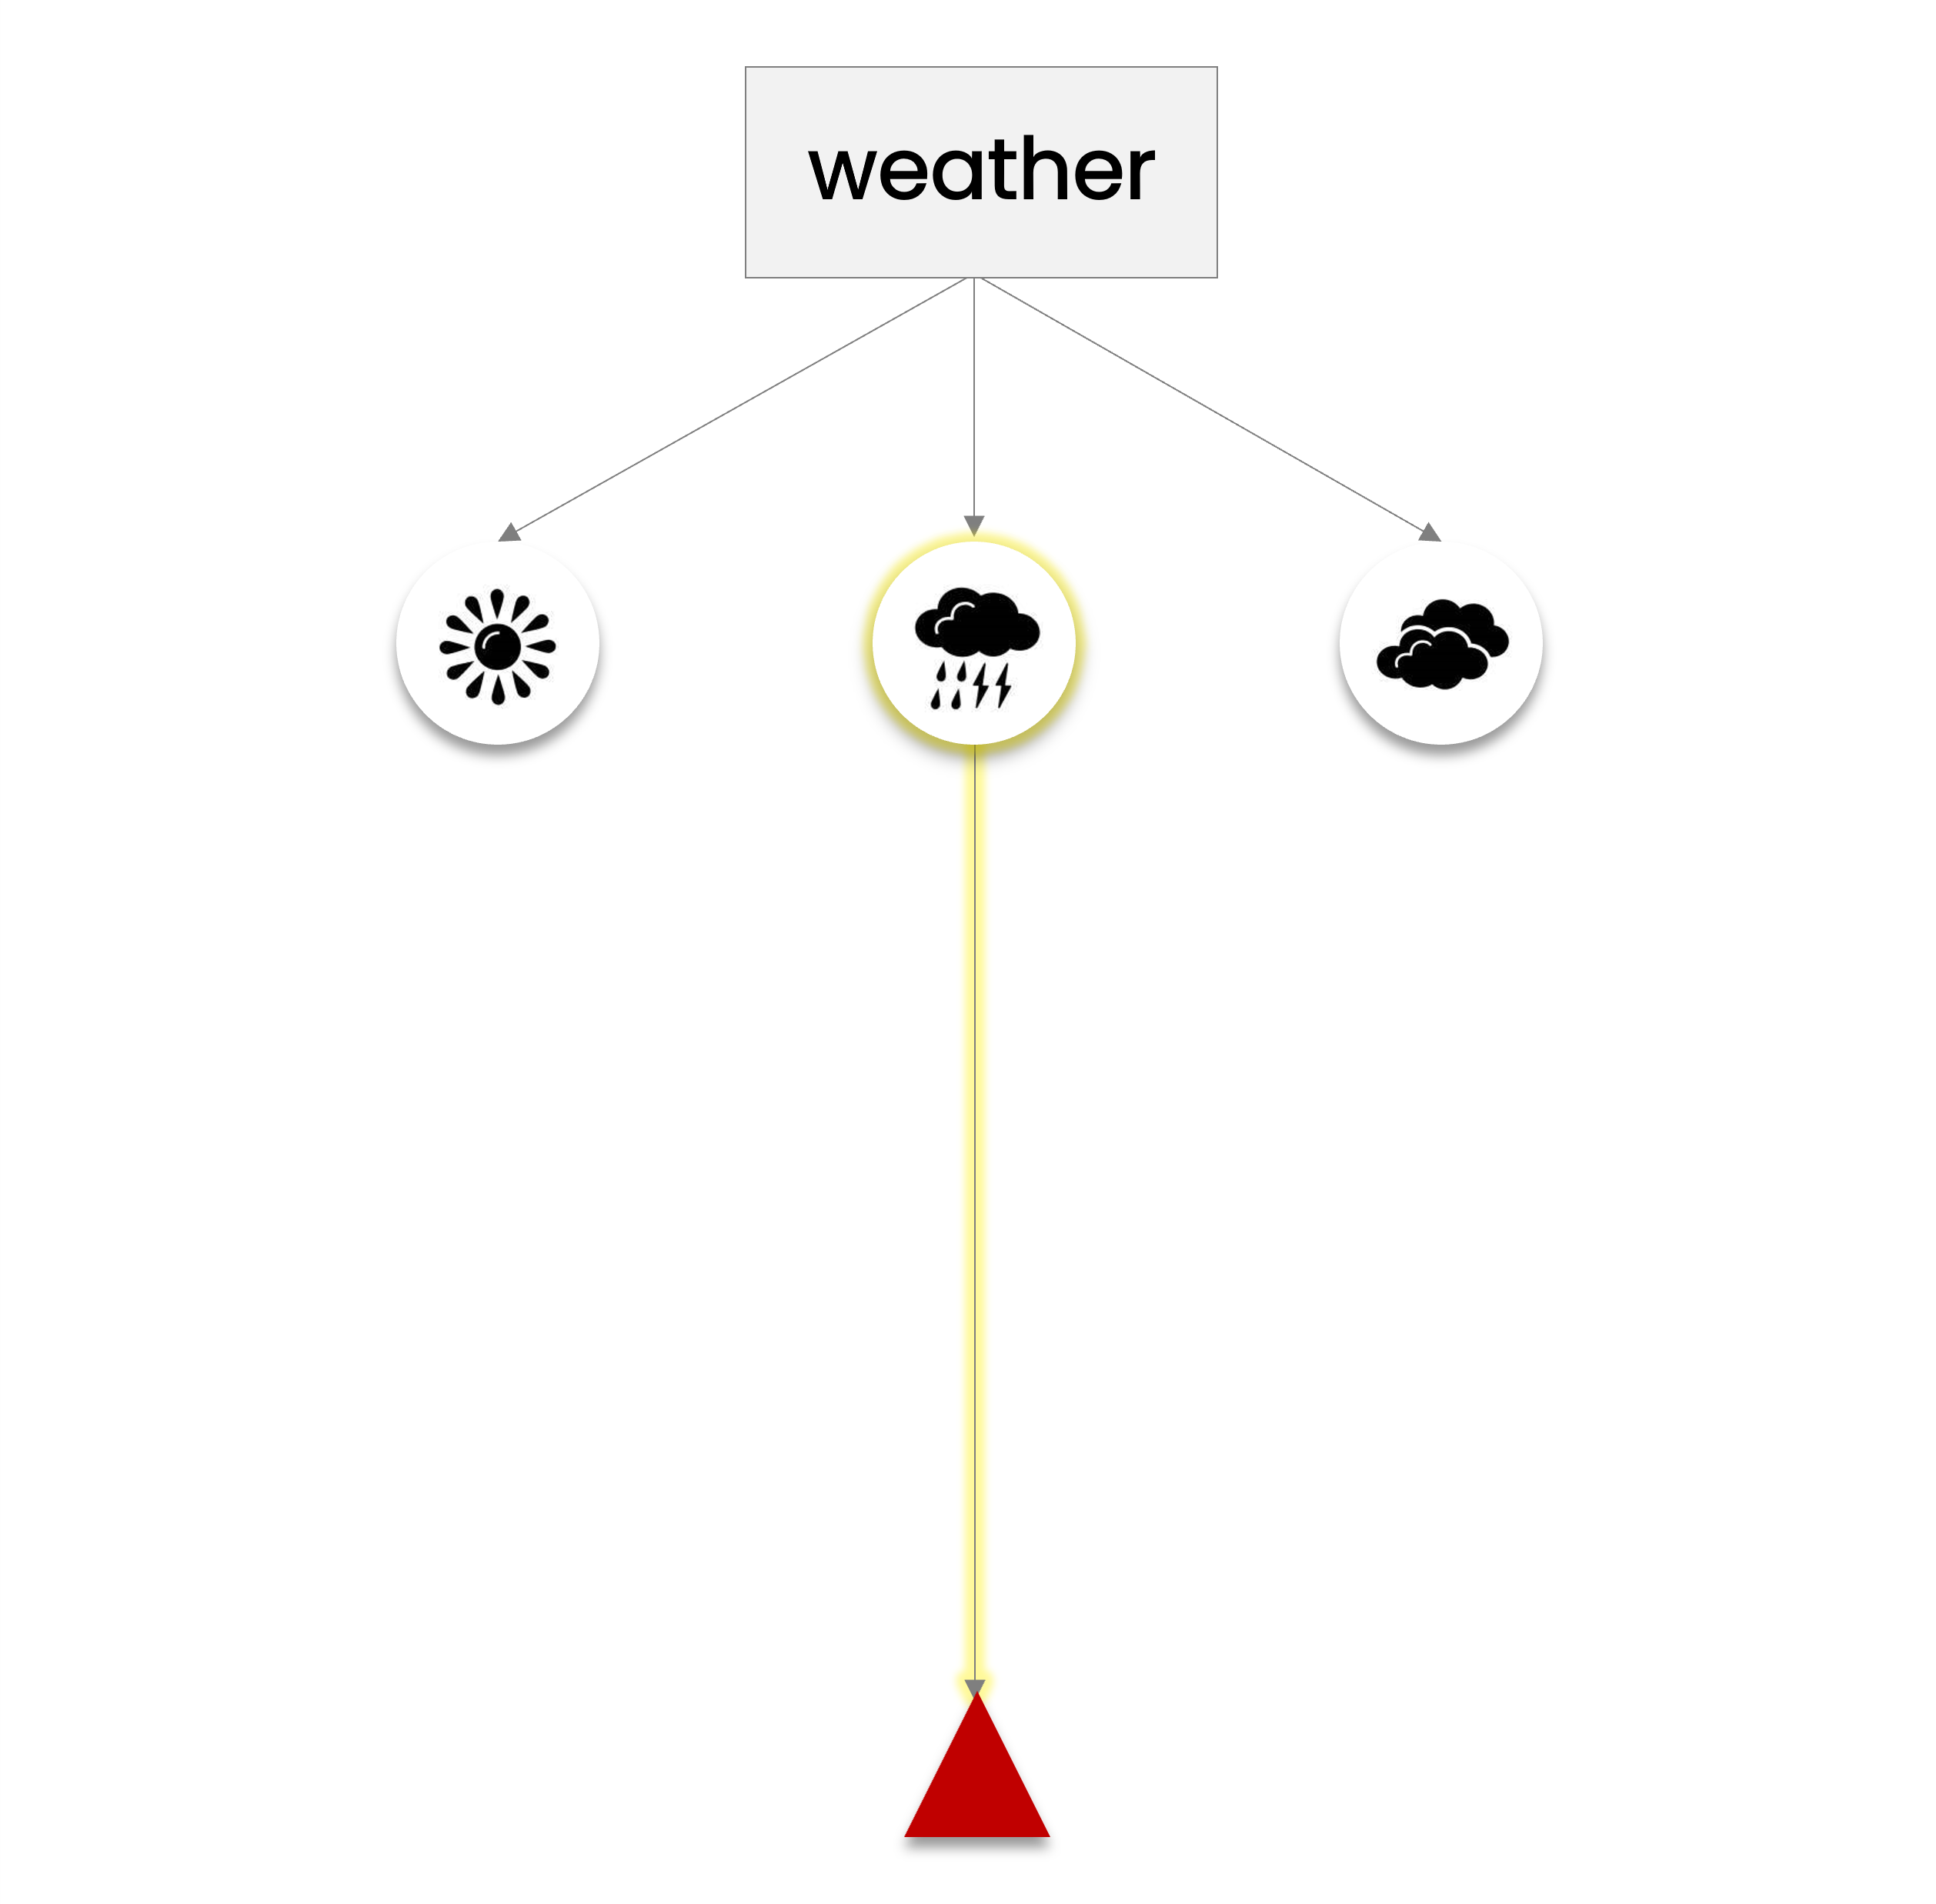
Highlighted rain icon and yellow line leading to a red triangle representing an undesired outcome

Decoding Decision Modeling

Applying a Decision Tree

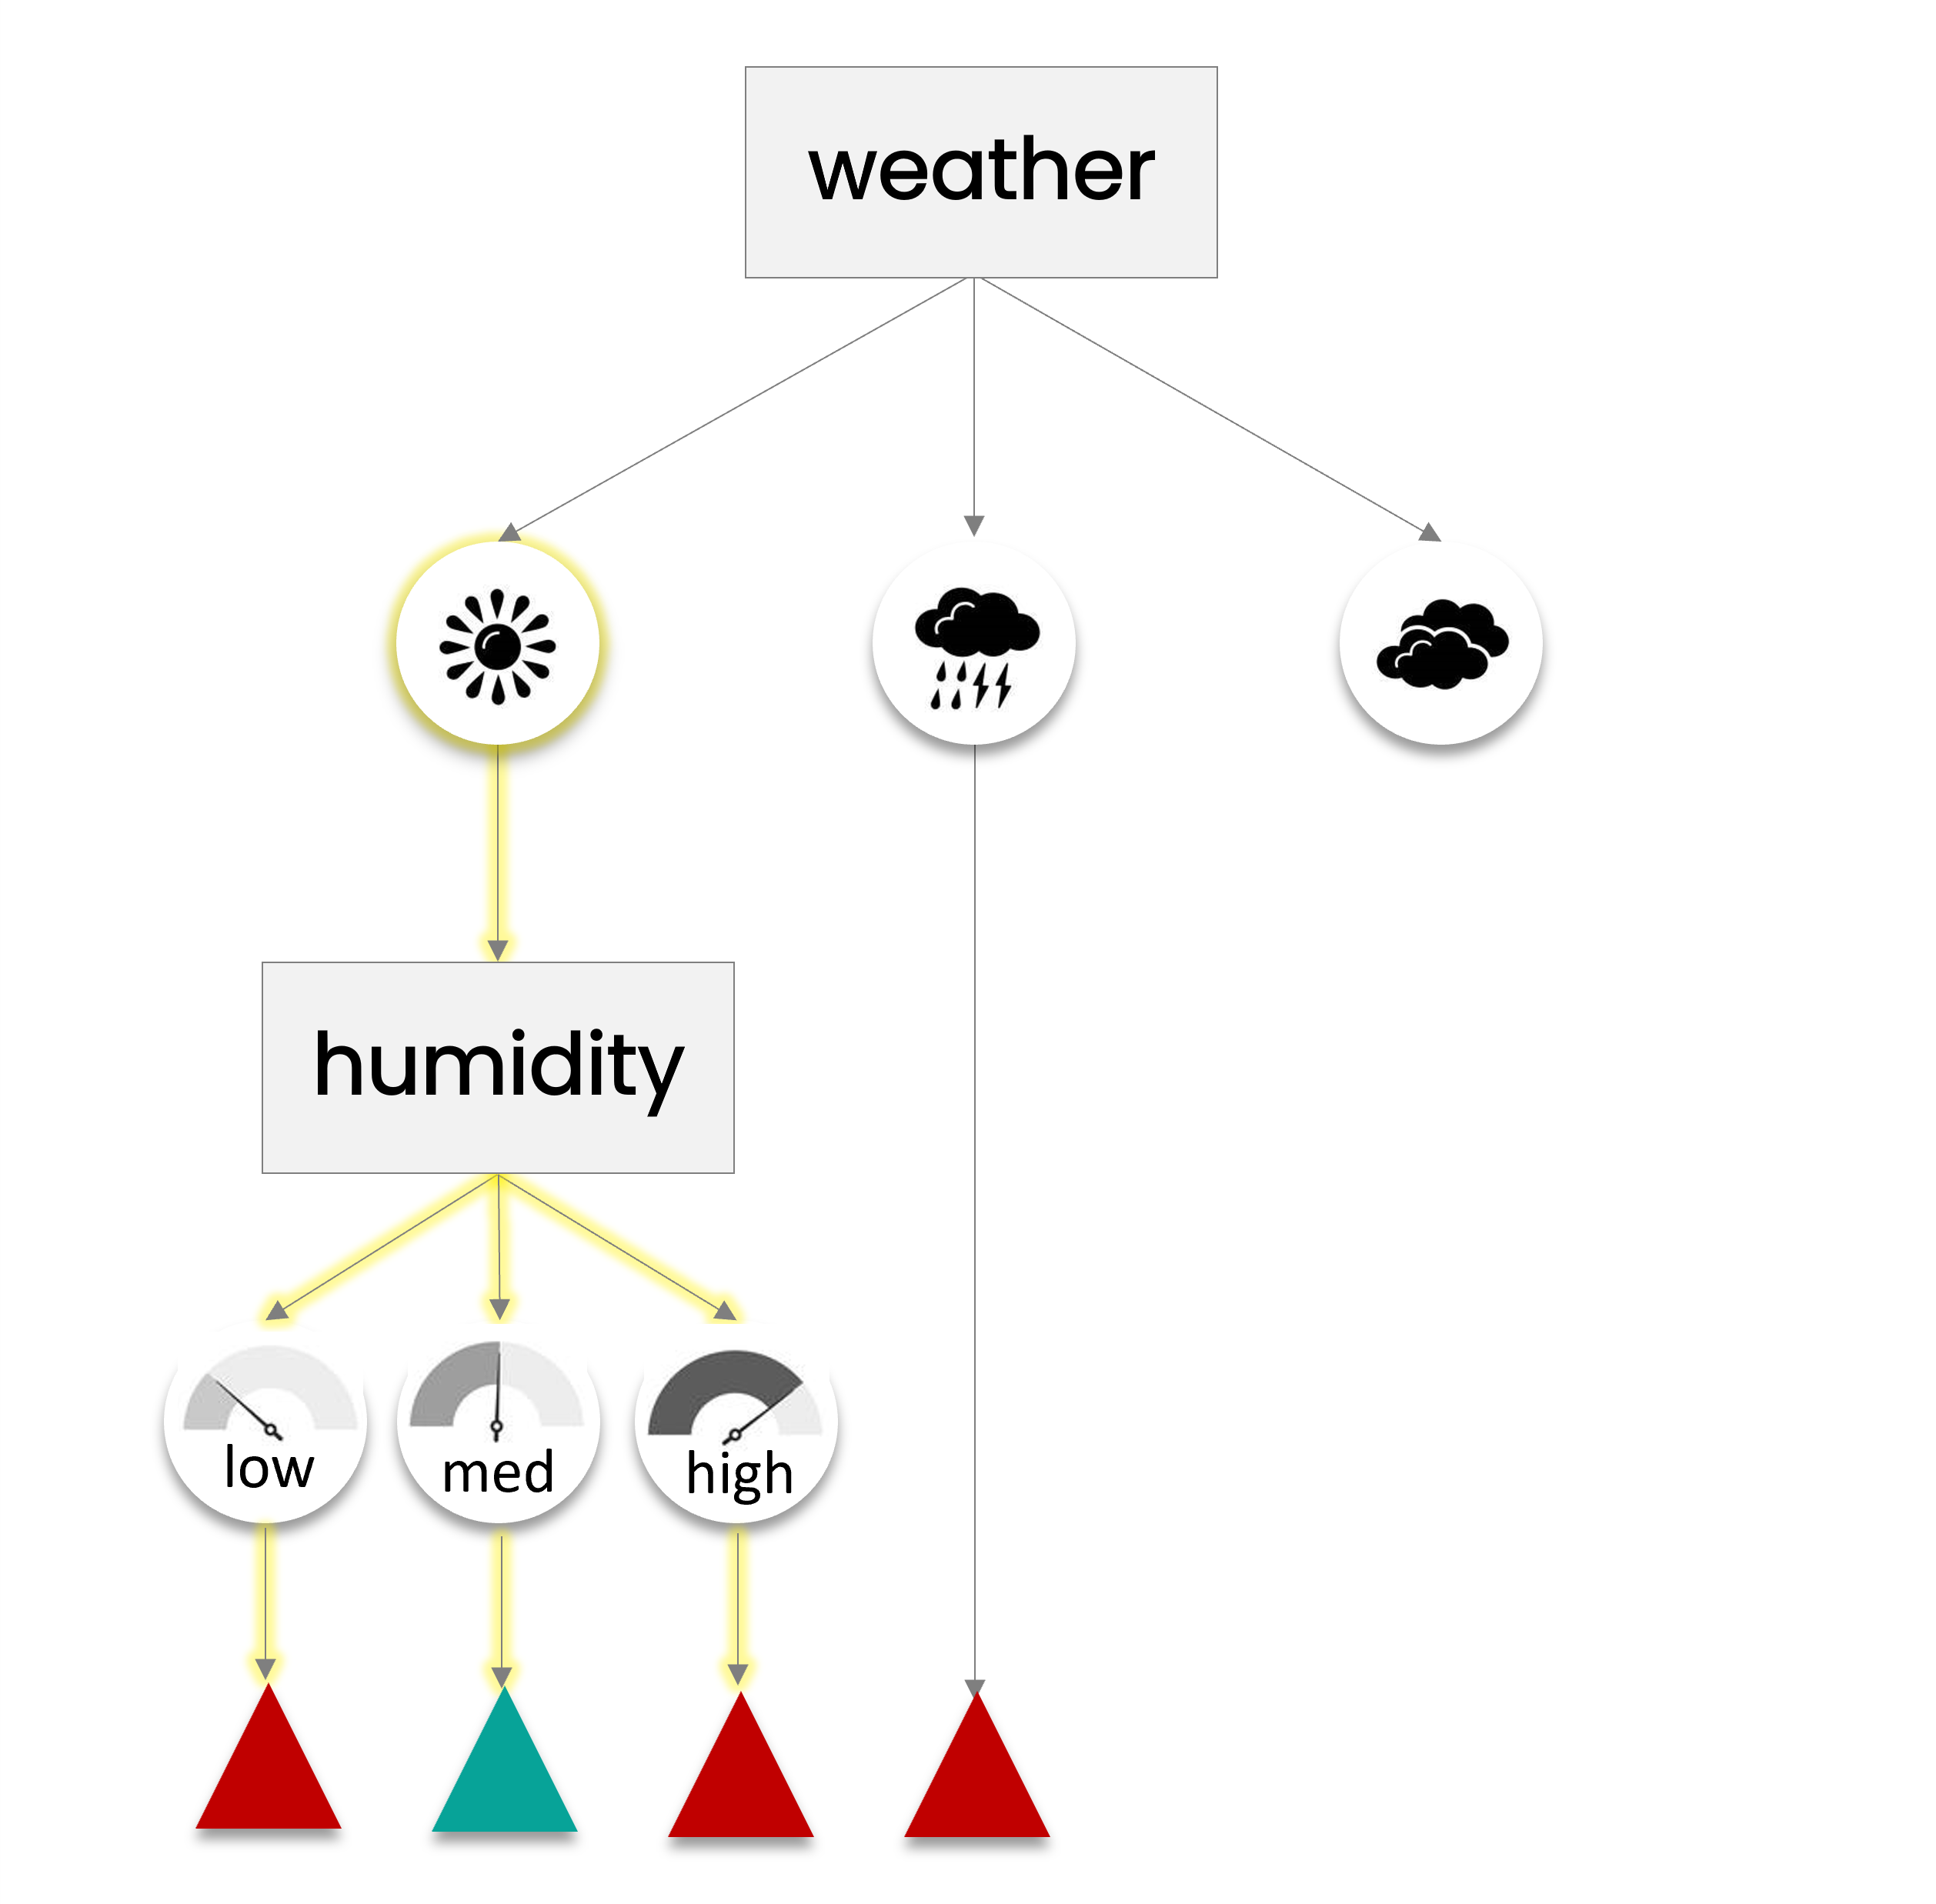
Highlighted sun icon with a yellow line leading to a label humidity leading to the icons low, medium and high leading to outcomes undesired, desired and undesired respectively

Decoding Decision Modeling

Applying a Decision Tree

Highlighted cloudy icon with a yellow line leading to a label wind leading to the icons low, medium and high leading to outcomes desired, desired and undesired respectively

Decoding Decision Modeling

Influence Diagrams

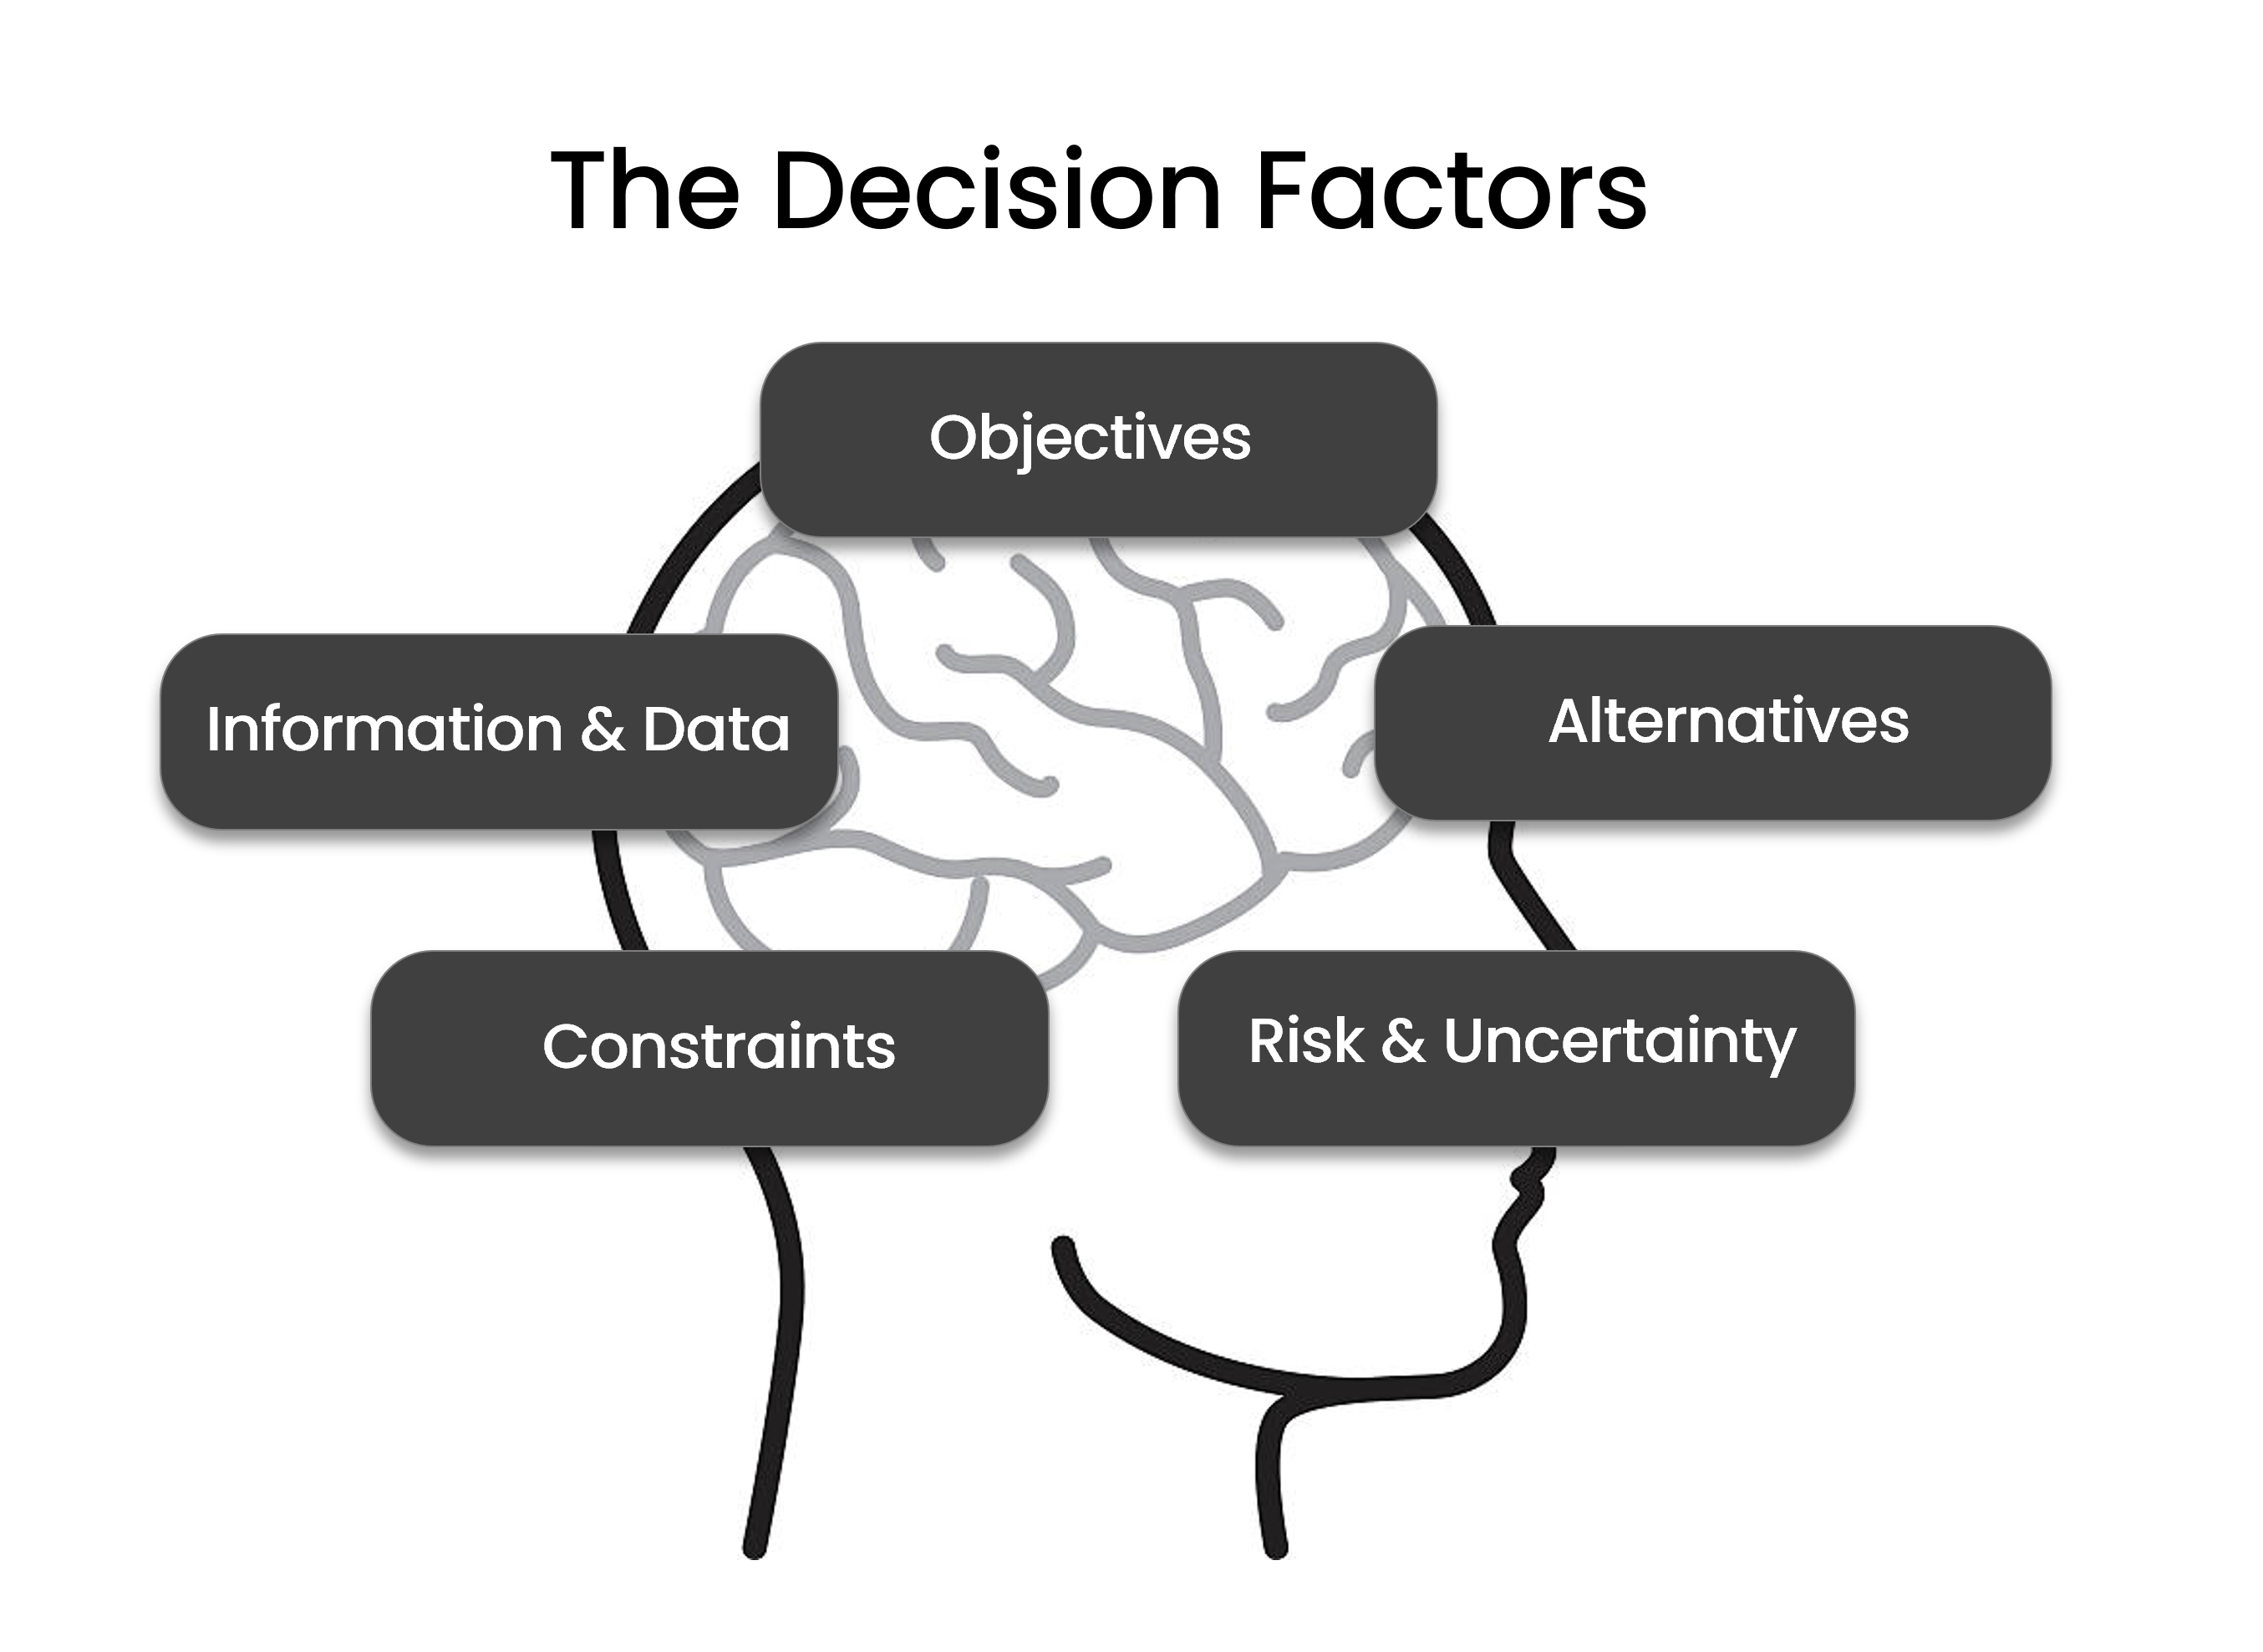
A white rectangle with a white outline to facilitate the slide formating A diagram depicting a side profile of a human head with a brain outline inside. The decision factors Objectives, Alternatives, Risks & Uncertainty, Constraints and Information & Data.

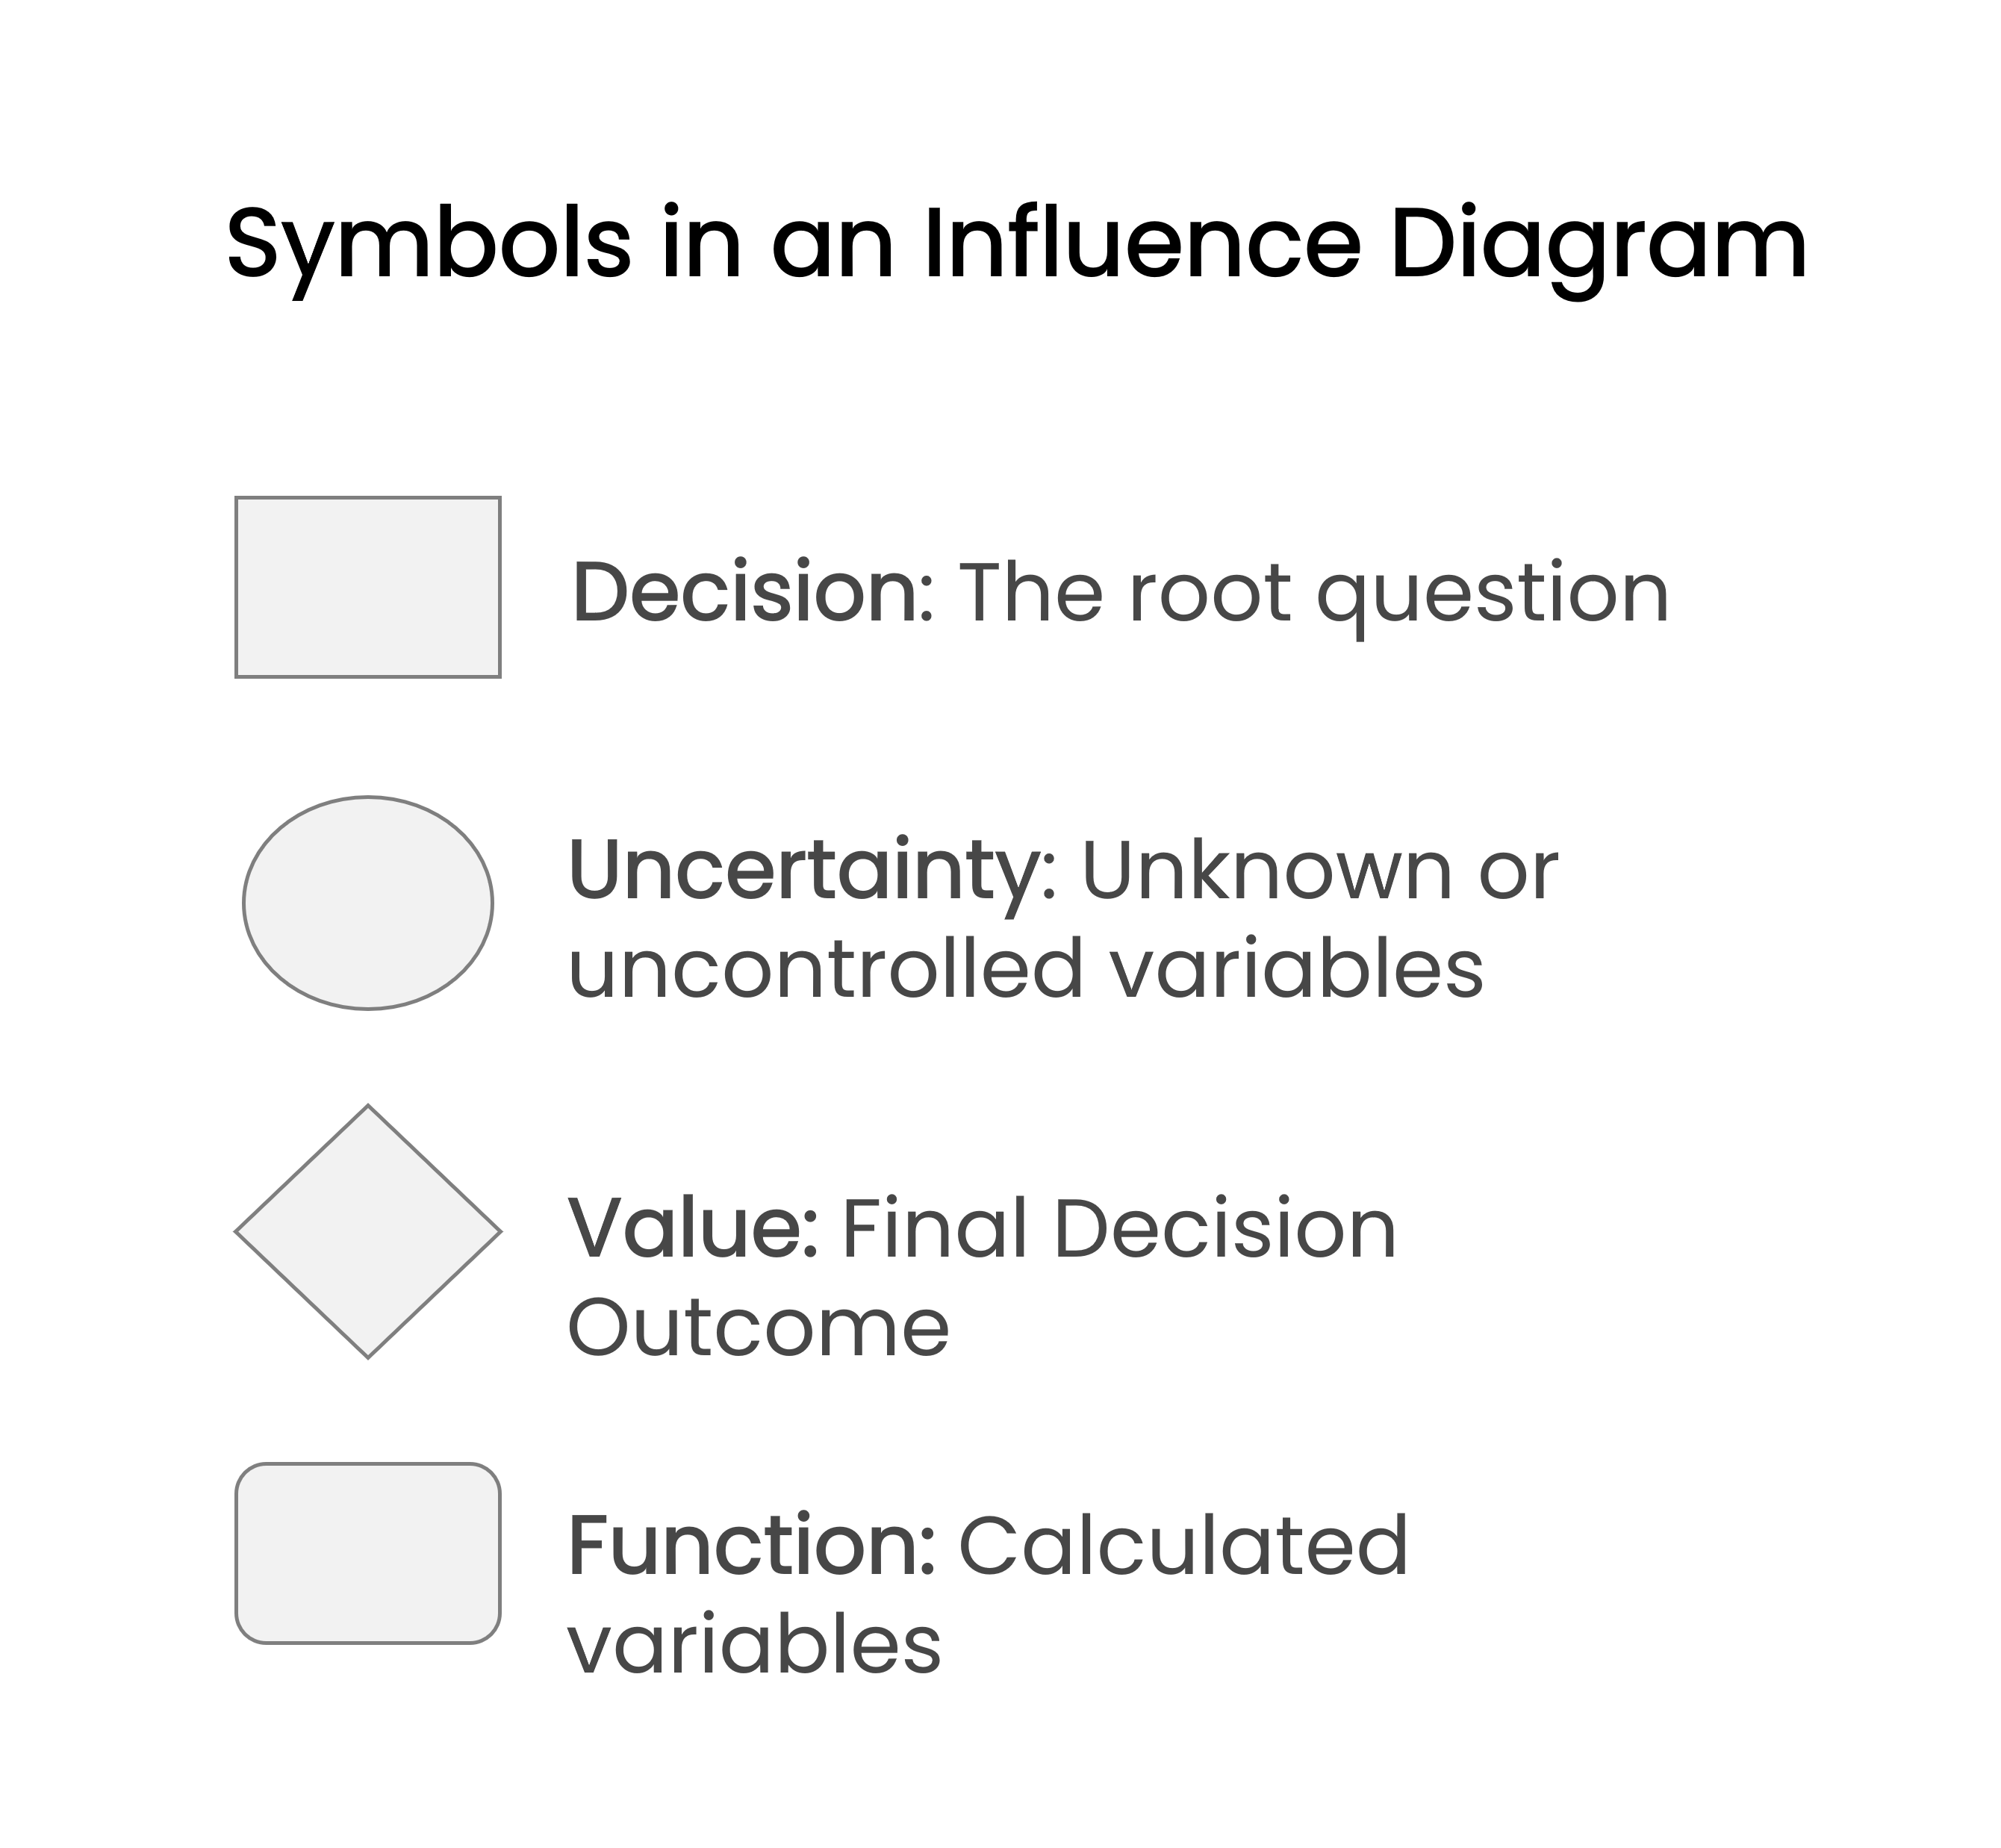
Image with the symbols of the influence Diagram. Decision as a rectangle,uncertainty as an oval, diamond as Value and the rounded rectangle as function

Decoding Decision Modeling

Applying an Influence Diagram

The Millers are finally getting married! They're considering a beach wedding at sunset. What variables can influence this decision?
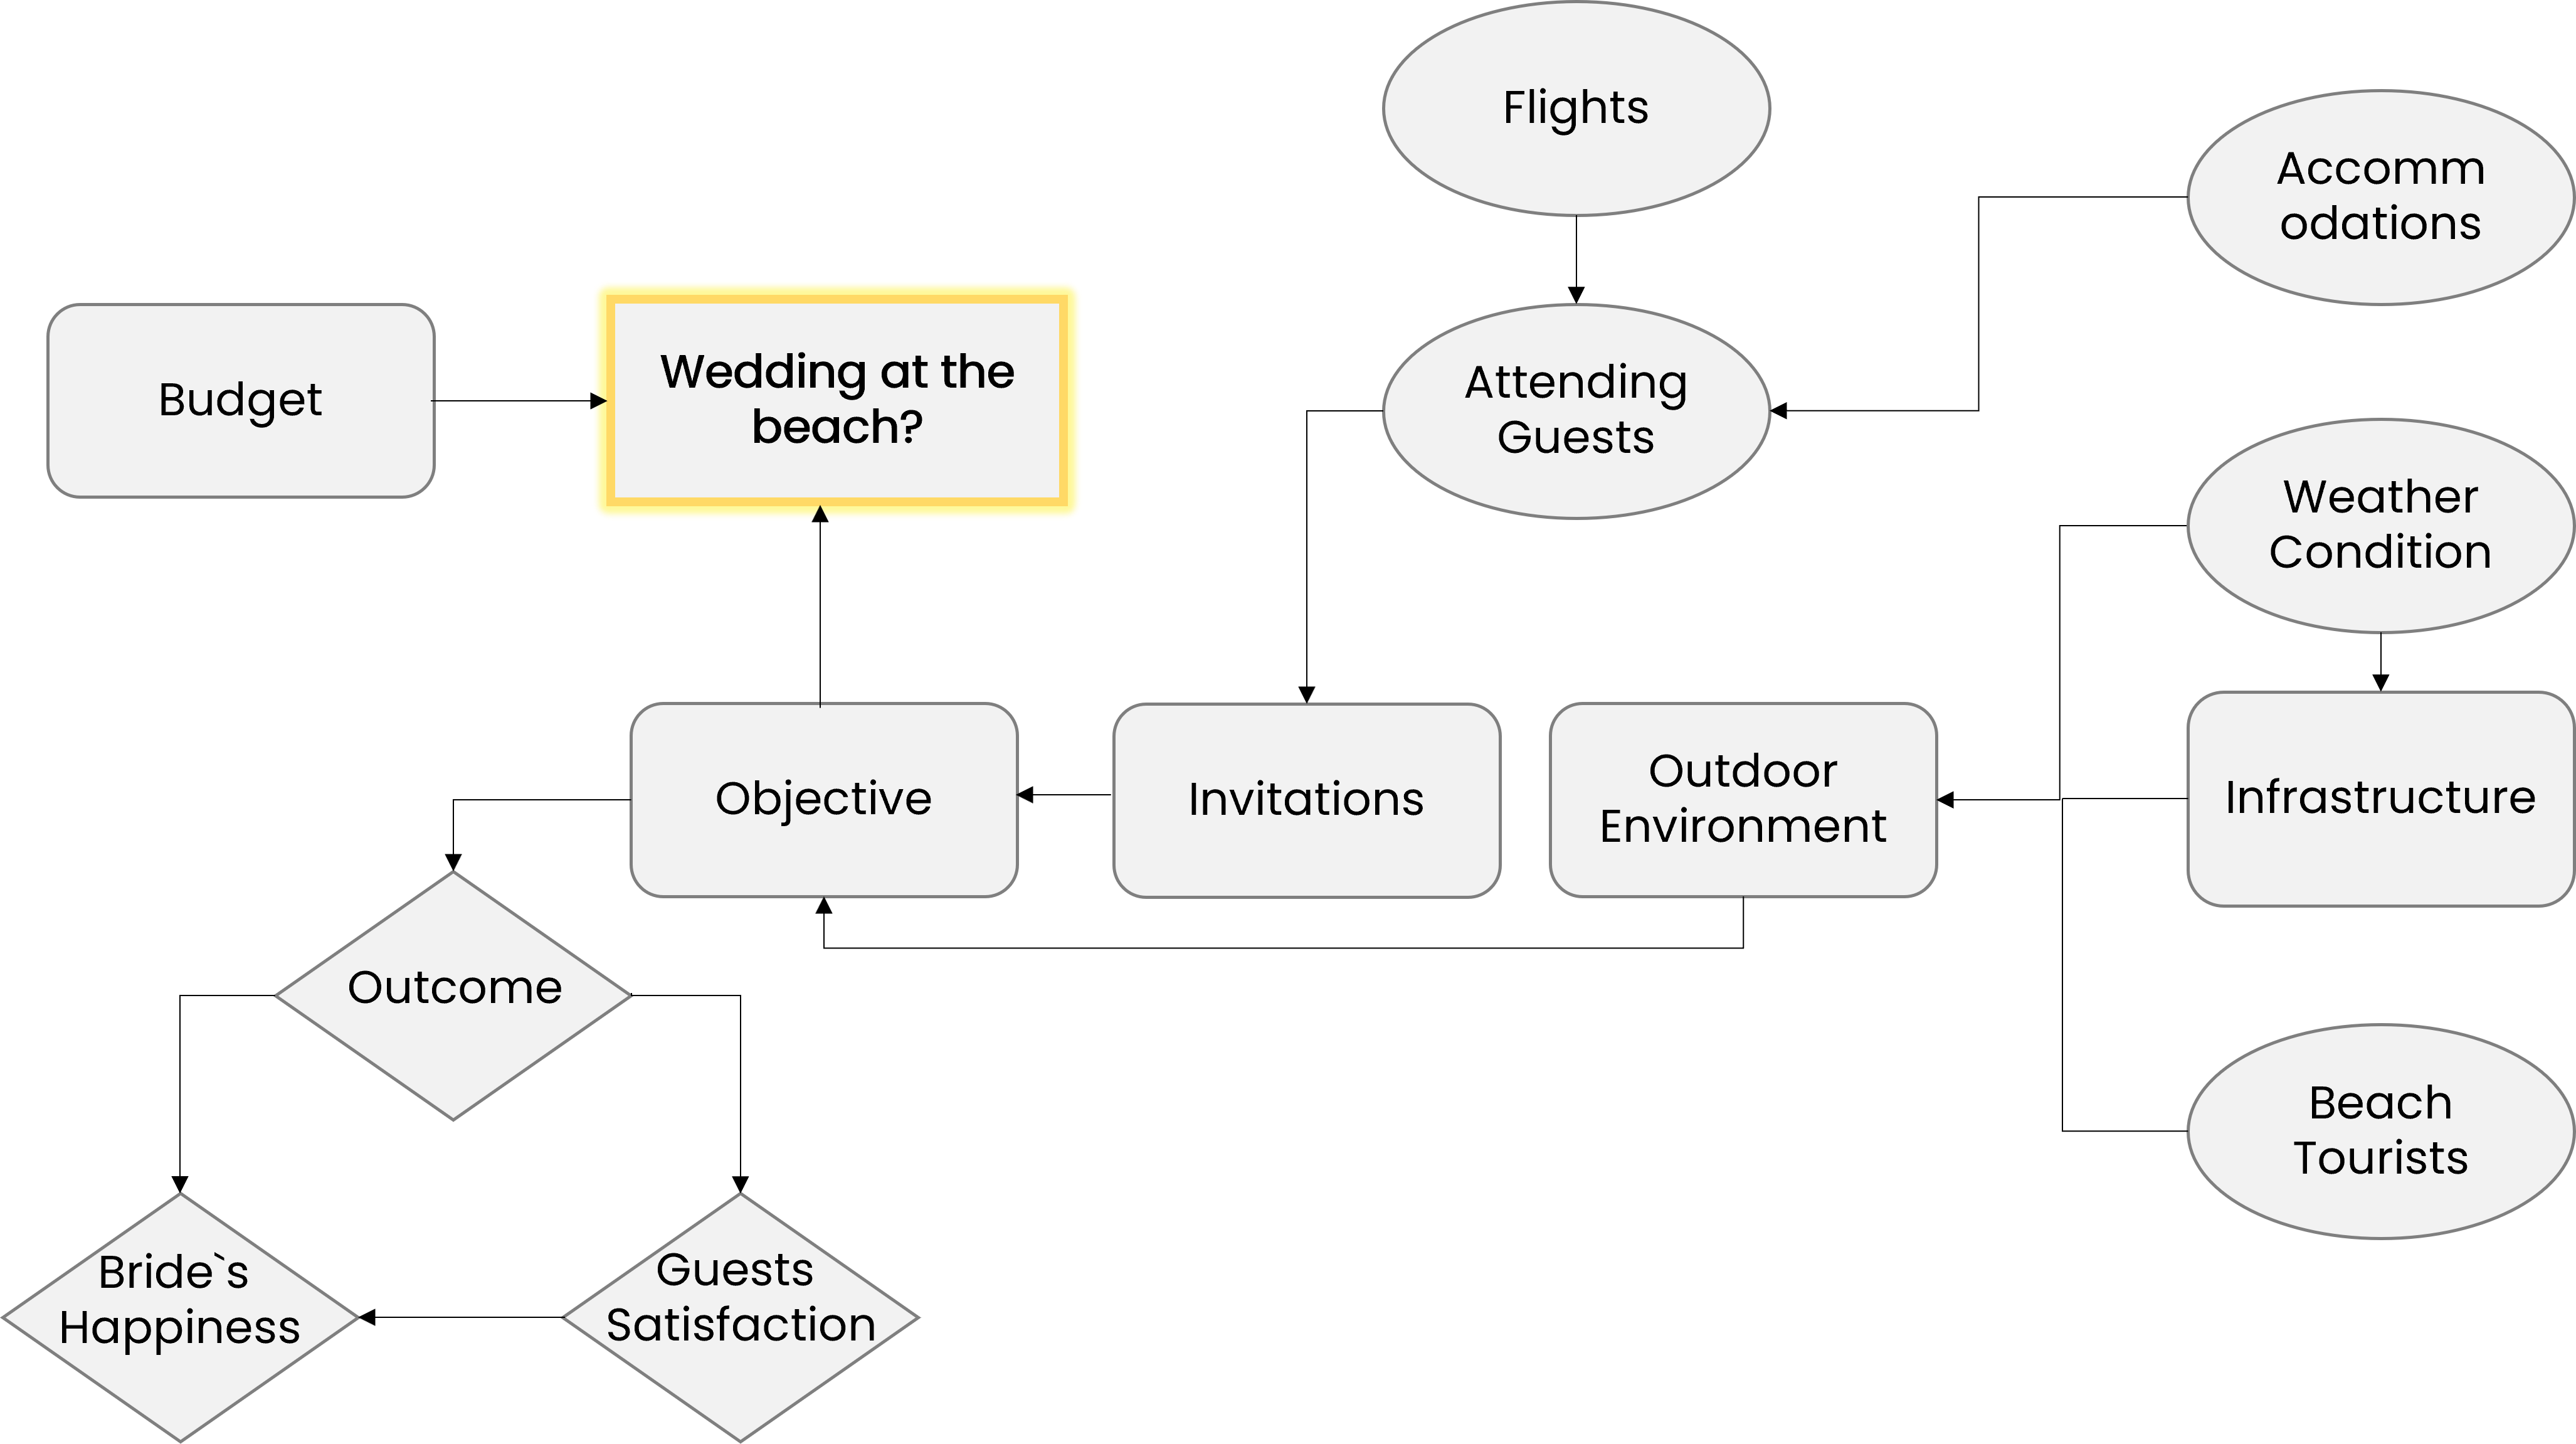
An influence diagram showing all the components that influence the decision to have a outdoor beach wedding

Decoding Decision Modeling

Applying an Influence Diagram

The Millers are finally getting married! They're considering a beach wedding at sunset. What variables can influence this decision?
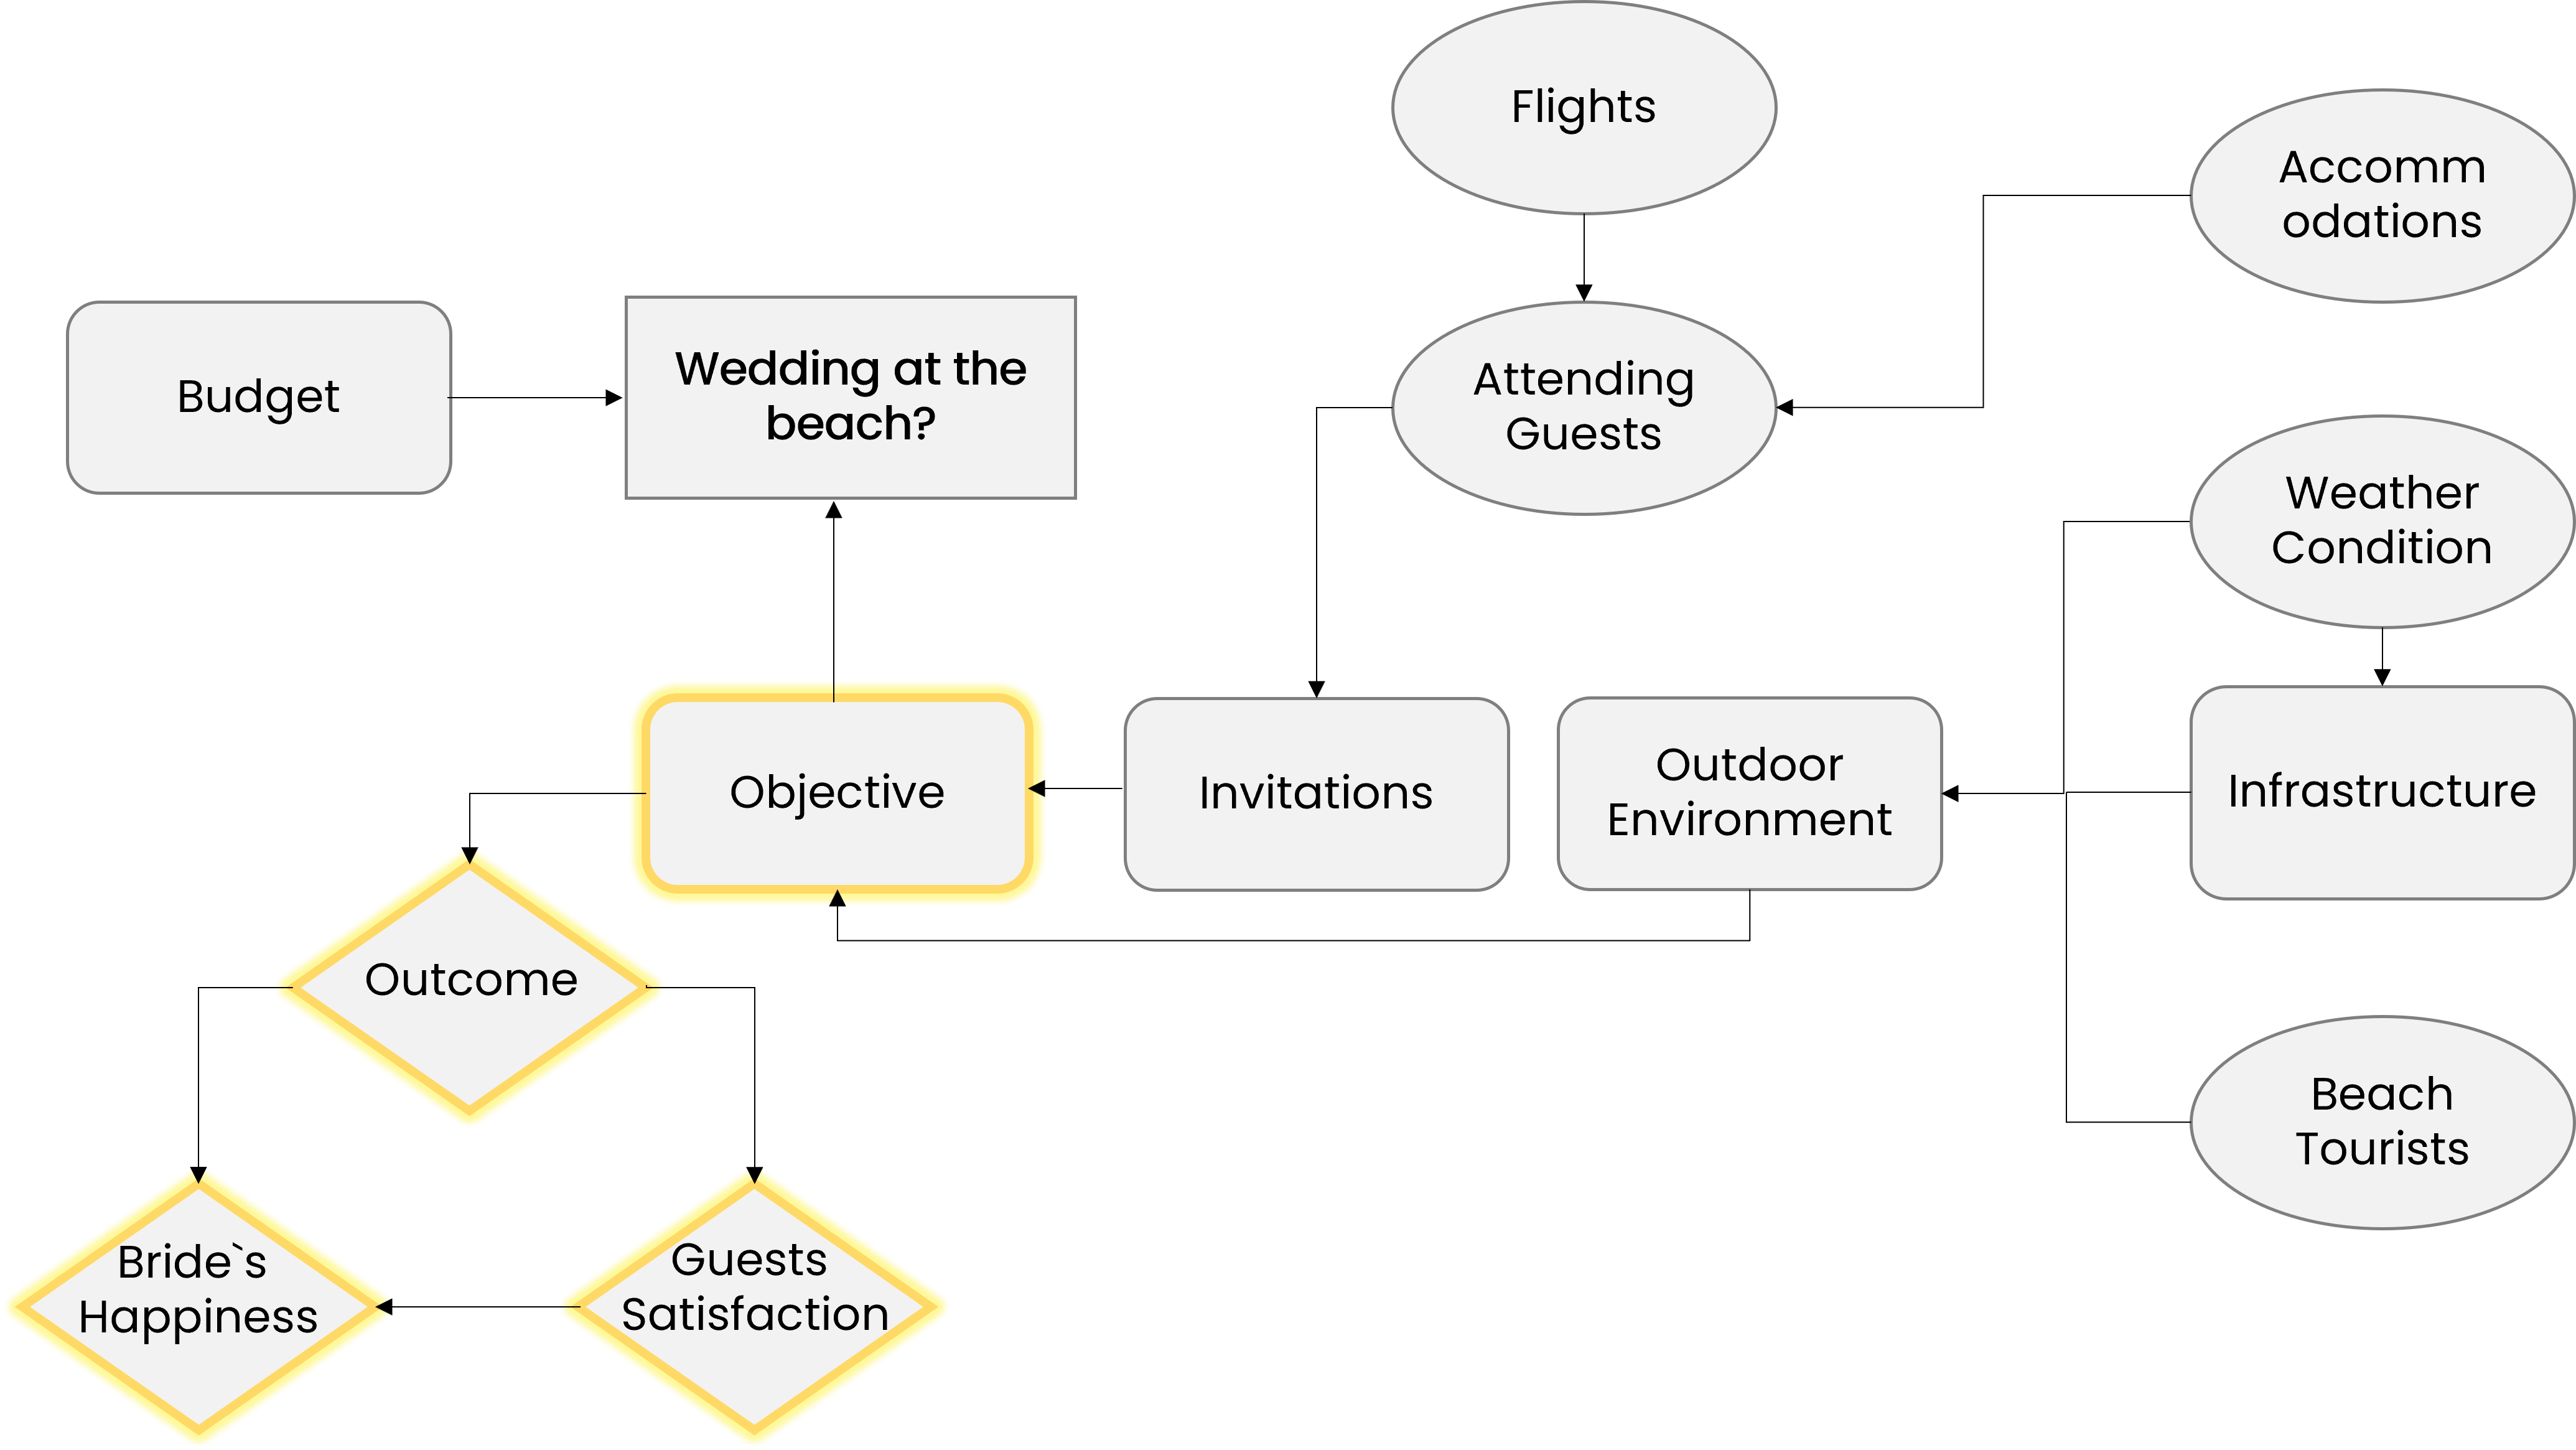
An influence diagram with the objective represented as a rectangle highlighted in yellow

Decoding Decision Modeling

Applying an Influence Diagram

The Millers are finally getting married! They're considering a beach wedding at sunset. What variables can influence this decision?
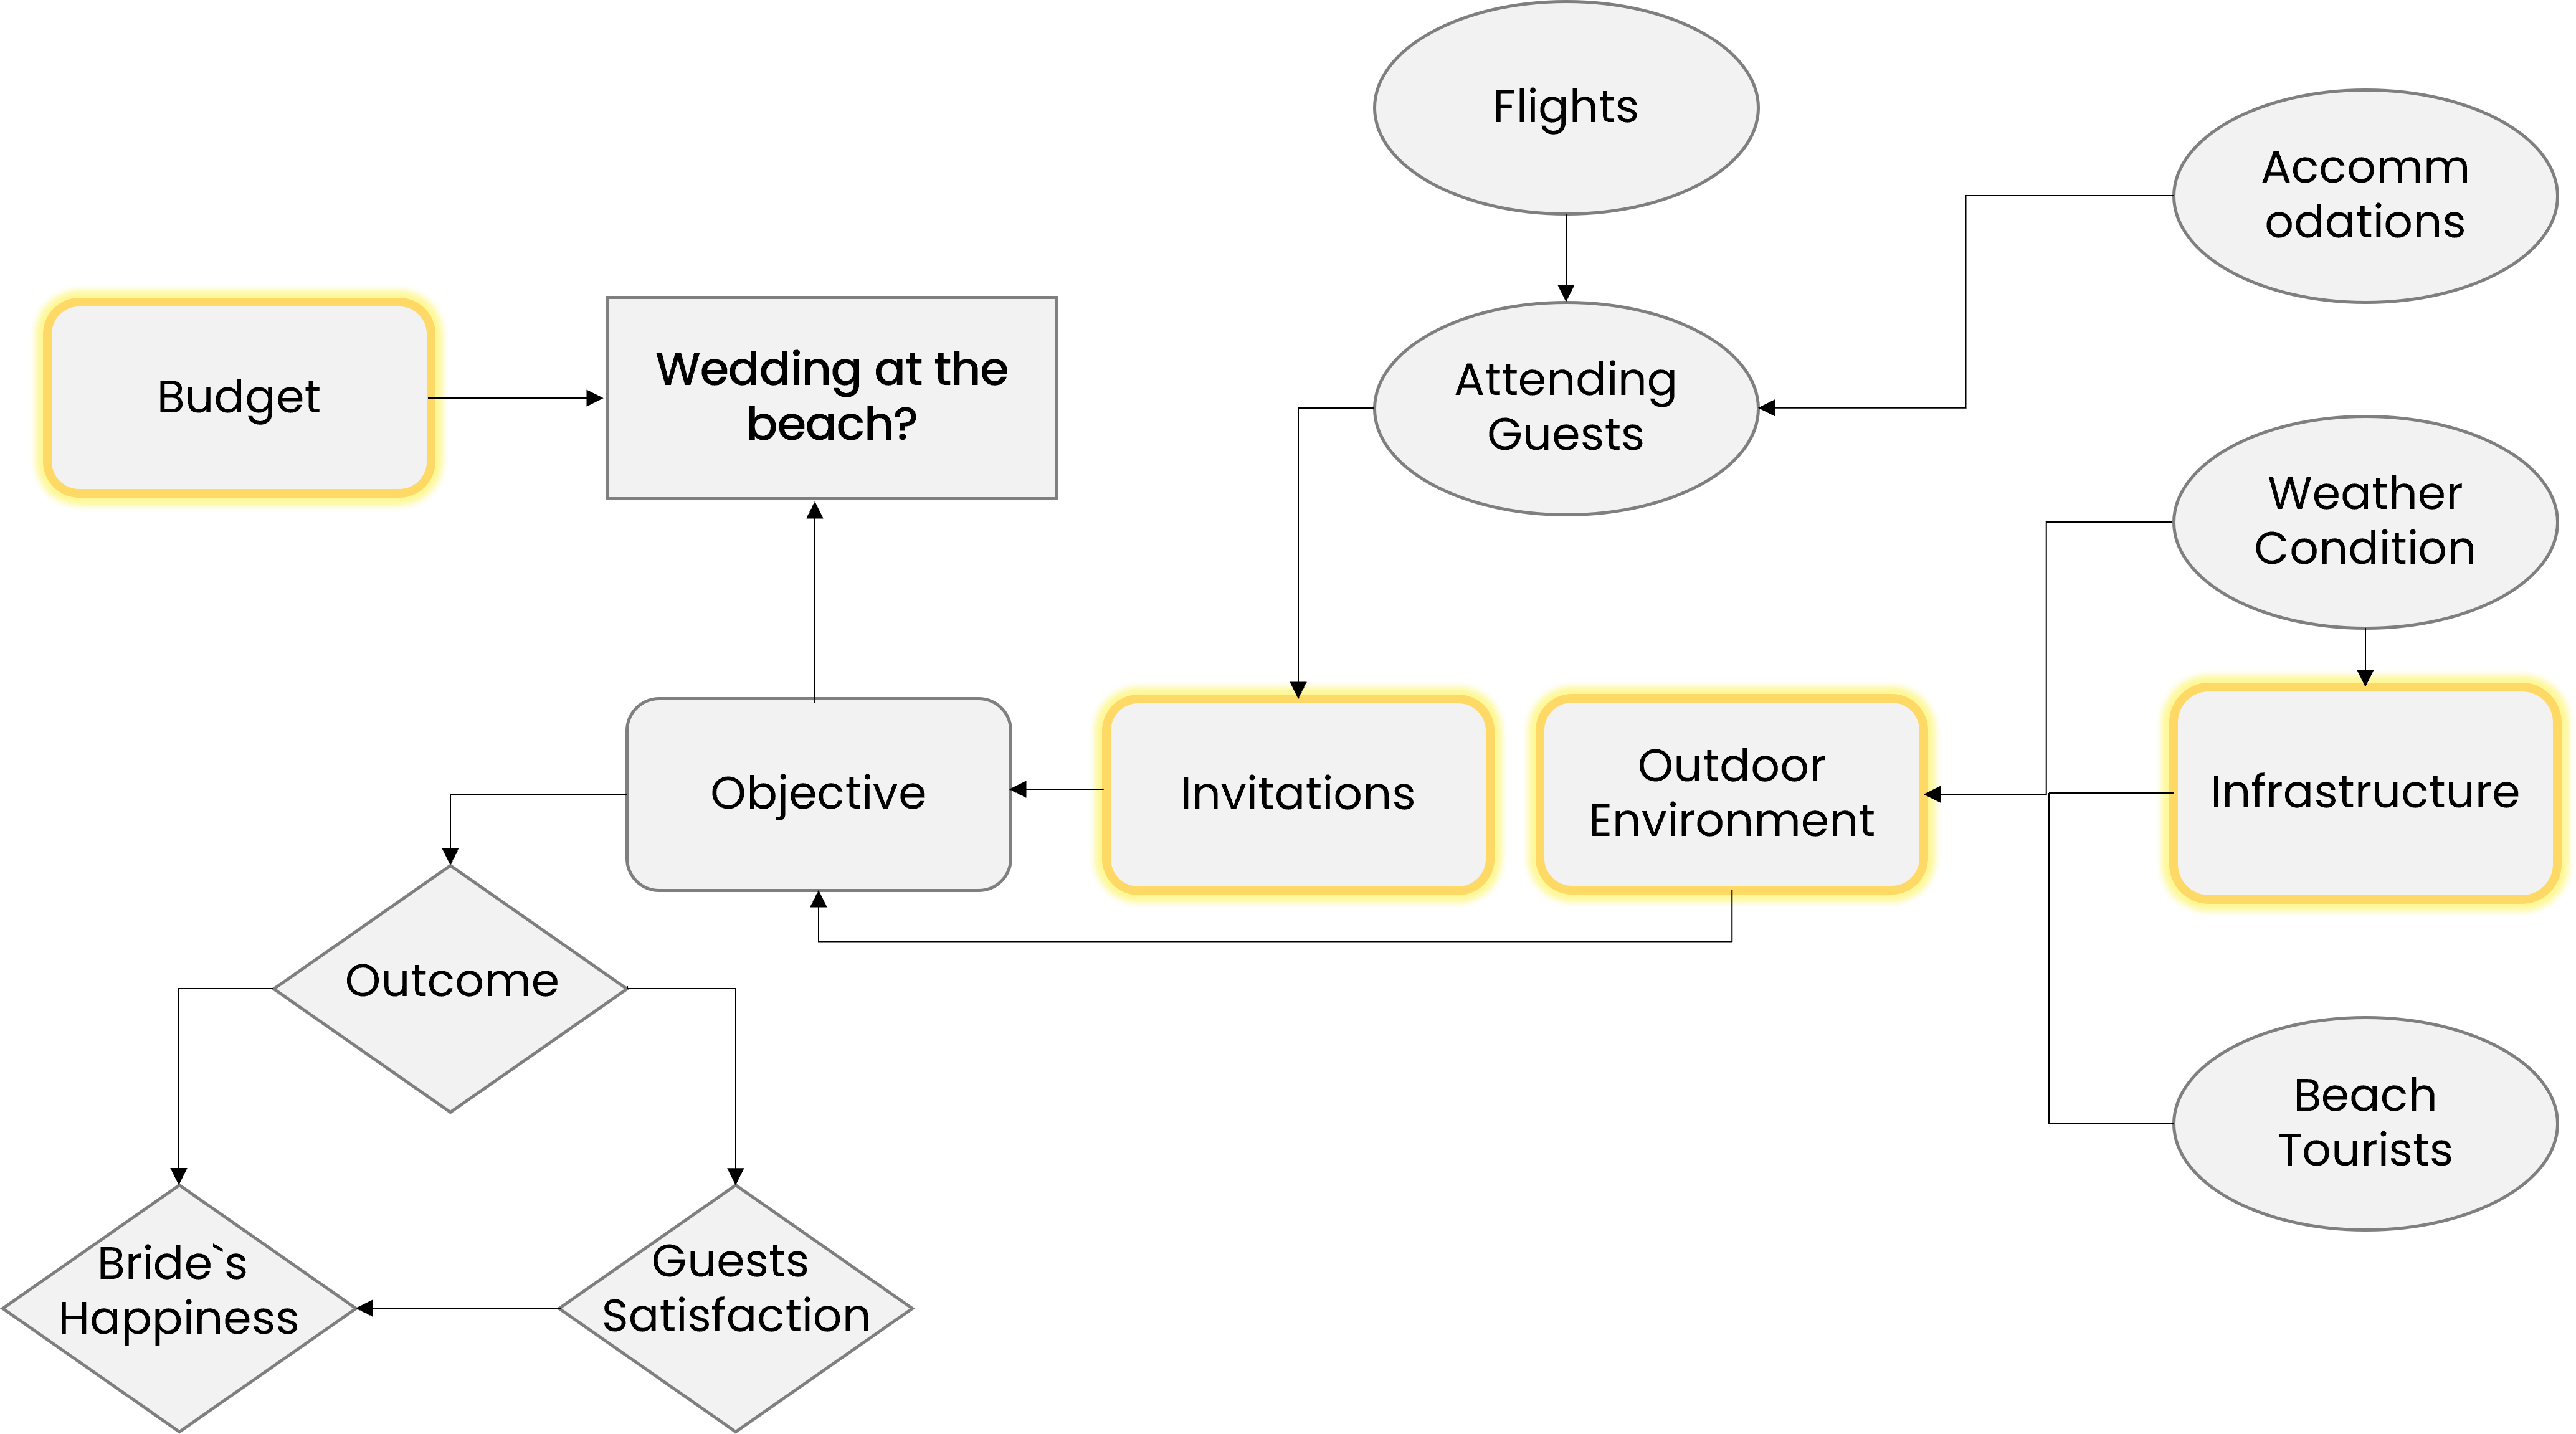
An influence diagram with the functions represented as a rounded rectangle highlighted in yellow

Decoding Decision Modeling

Applying an Influence Diagram

The Millers are finally getting married! They're considering a beach wedding at sunset. What variables can influence this decision?
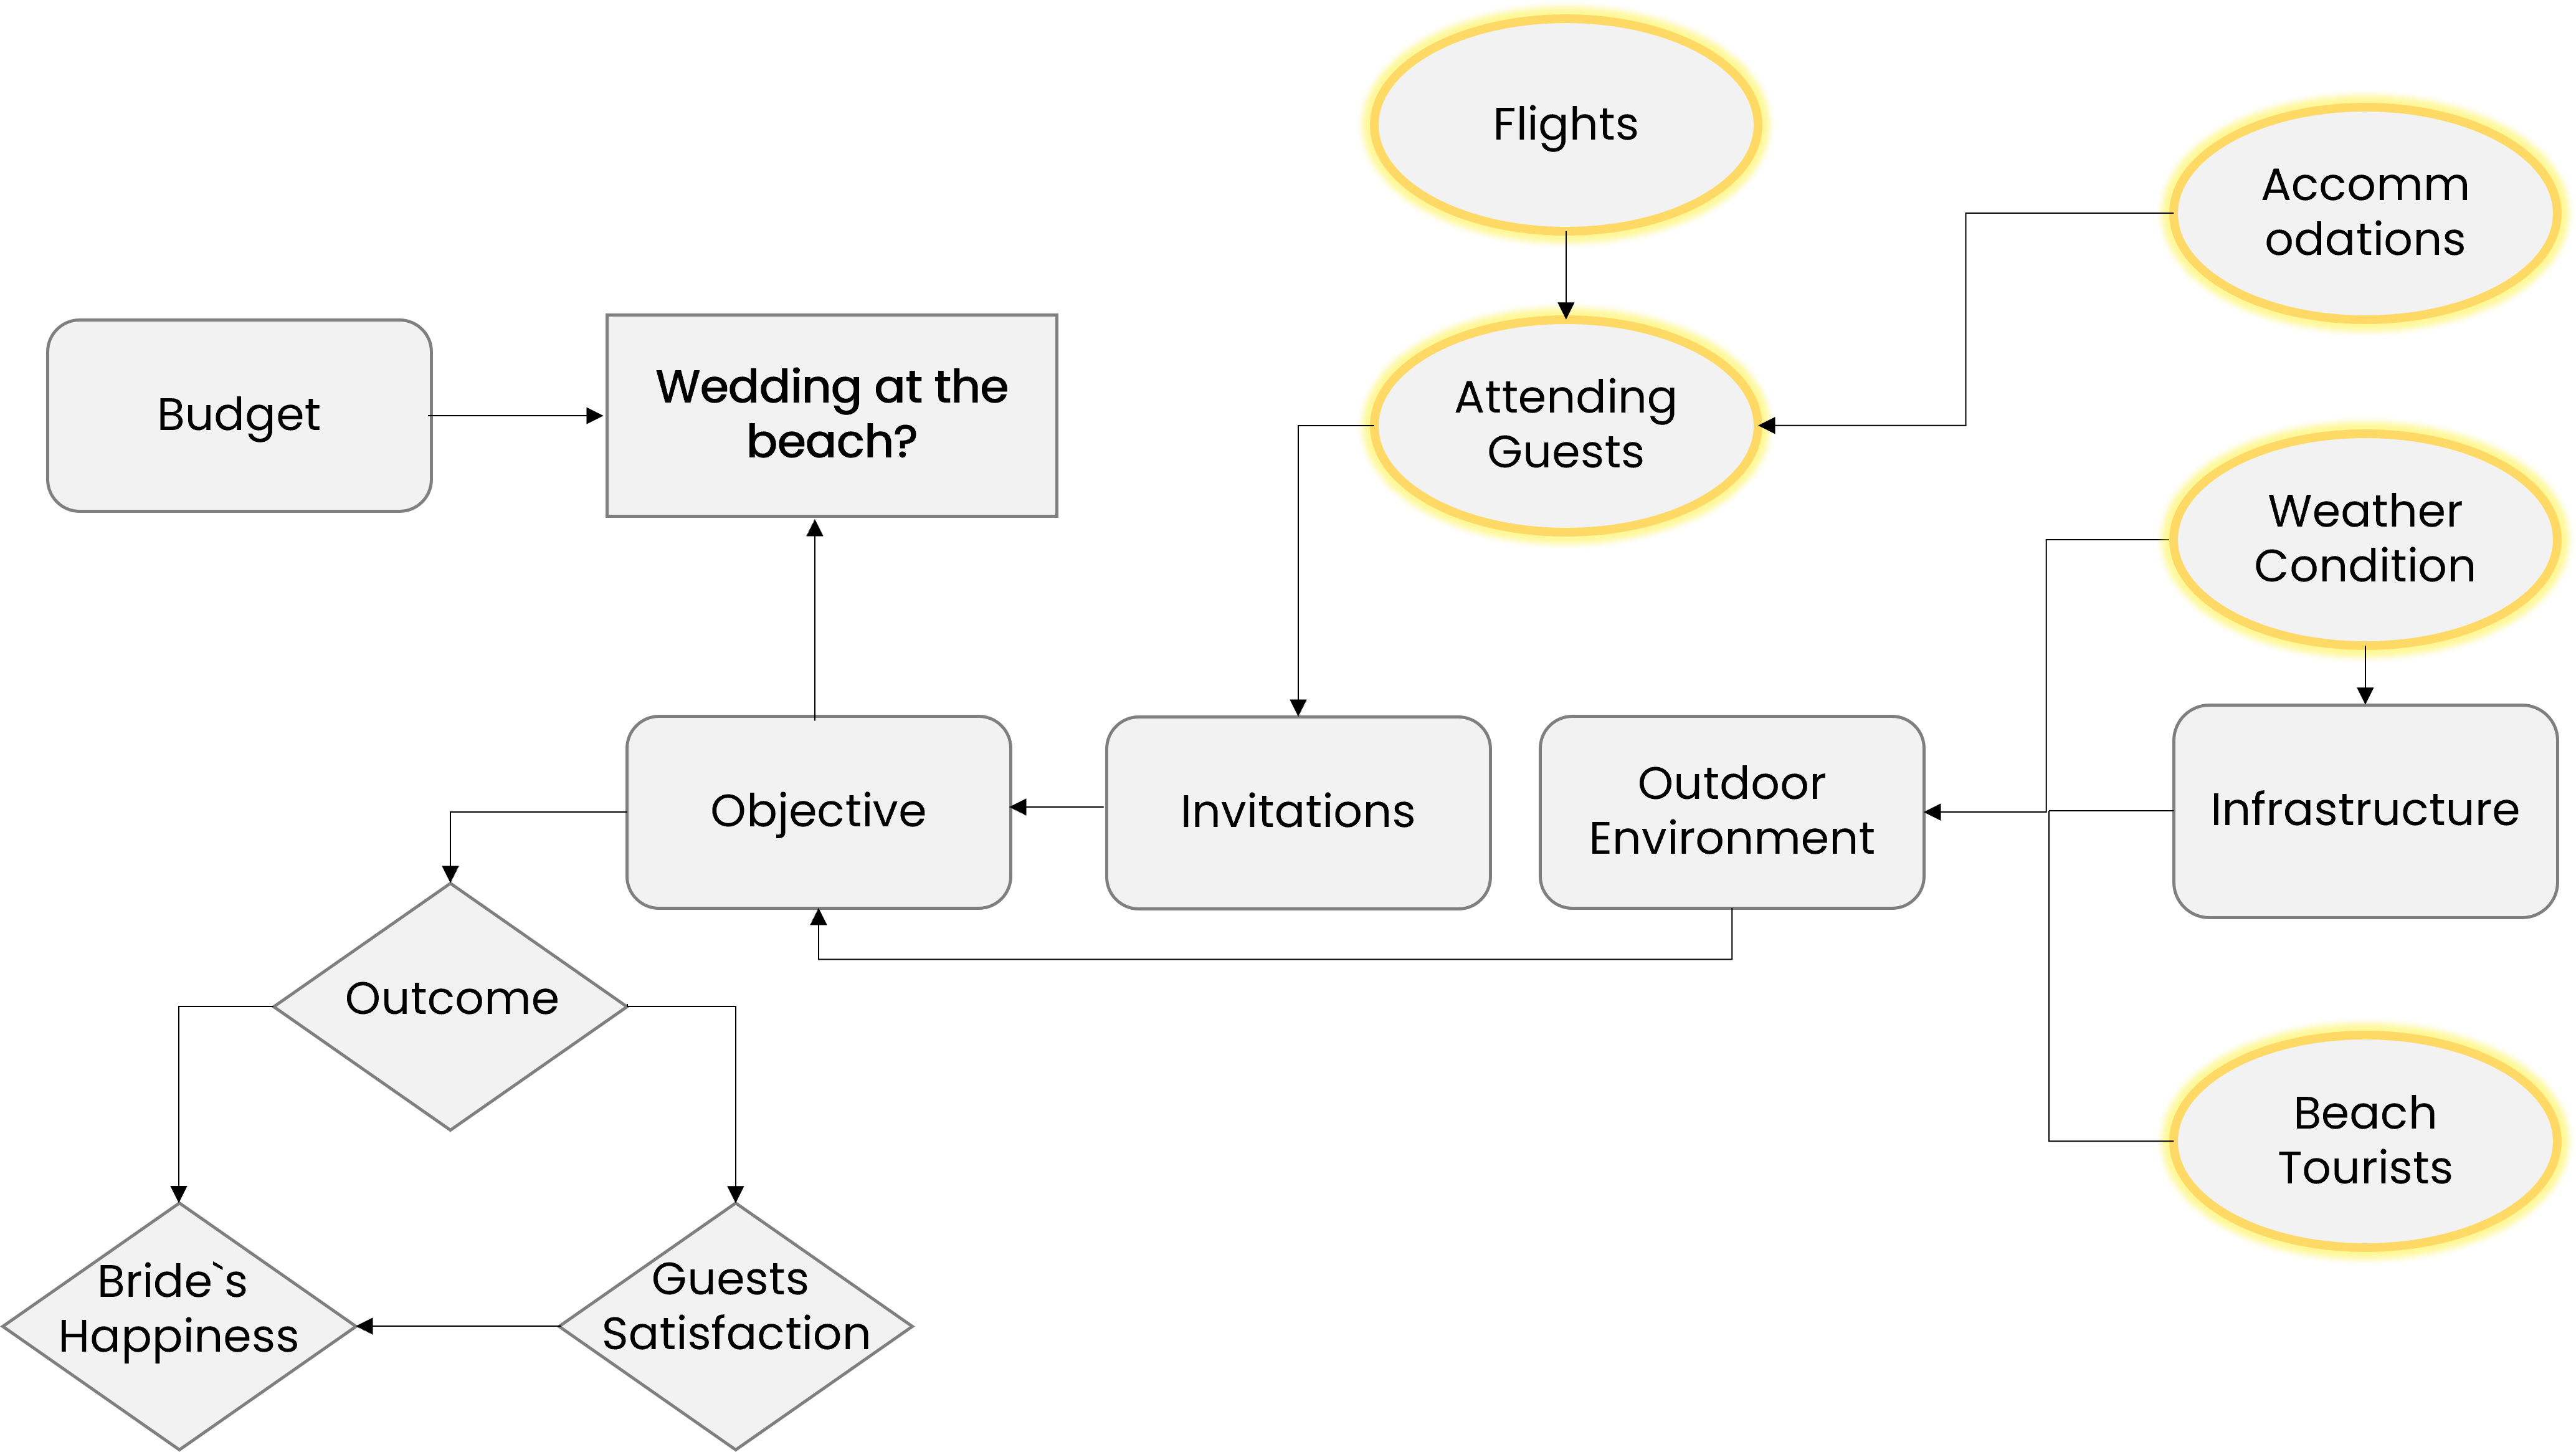
An influence diagram with the uncertainties represented as ovals highlighted in yellow

Decoding Decision Modeling

Let's practice!

Decoding Decision Modeling

Preparing Video For Download...