Sensitivity Analysis for Decision Models
Decoding Decision Modeling

Tiago Brasil
Lead Data Engineer
Sensitivity Analysis for Decision Models
 Sensitivity analysis is a technique in decision modeling to examine how changes in input variables impact the output or outcomes of the model.
This strategy enables:
- Variable examination
- Scenario testing
- Decision support

Exploring Sensitivity Analysis
Sensitivity Analysis helps identify which inputs have the most significant influence on the decision outputs and to what extent.
Exploring Sensitivity Analysis
Sensitivity Analysis helps identify which inputs have the most significant influence on the decision outputs and to what extent.
Exploring Sensitivity Analysis
Sensitivity Analysis helps identify which inputs have the most significant influence on the decision outputs and to what extent.
Exploring Sensitivity Analysis
Sensitivity Analysis helps identify which inputs have the most significant influence on the decision outputs and to what extent.
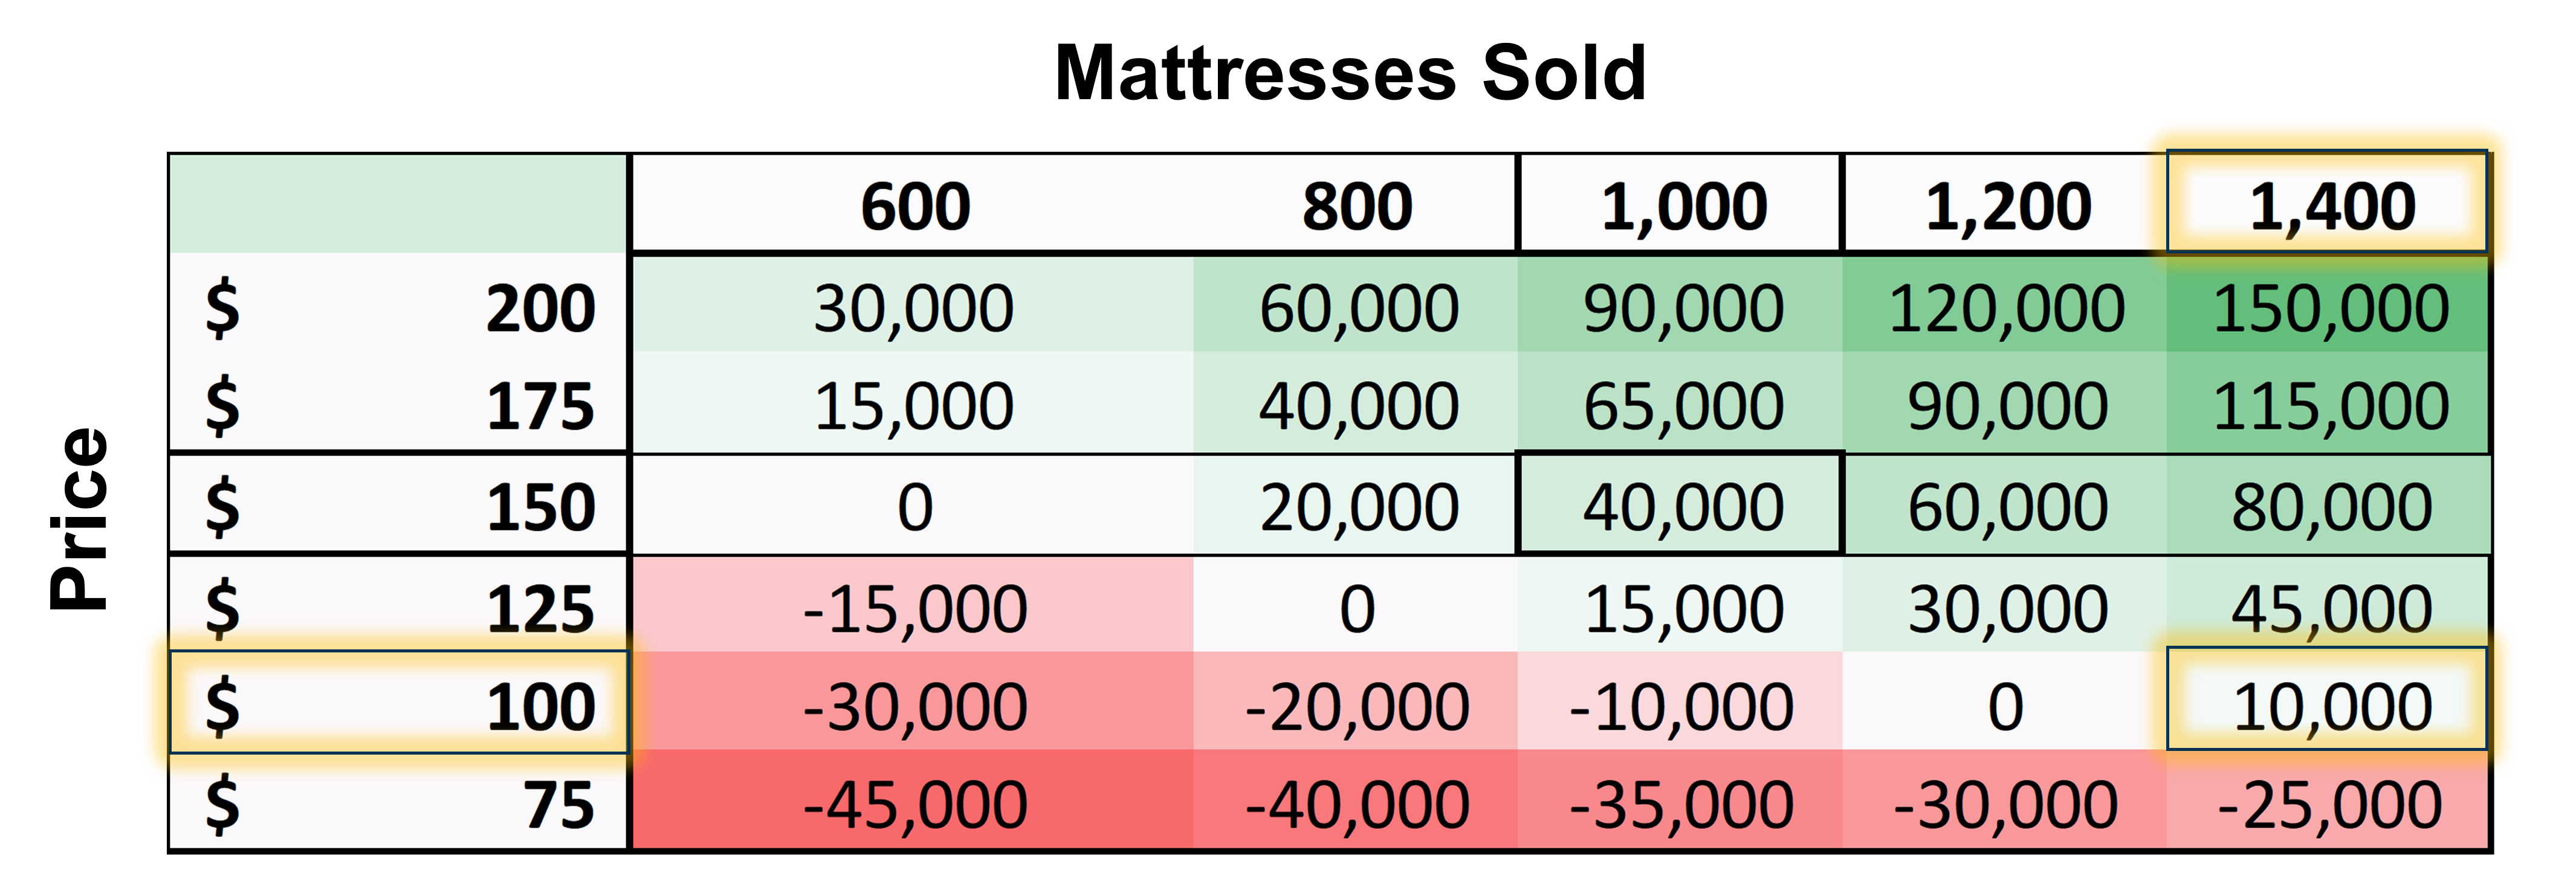
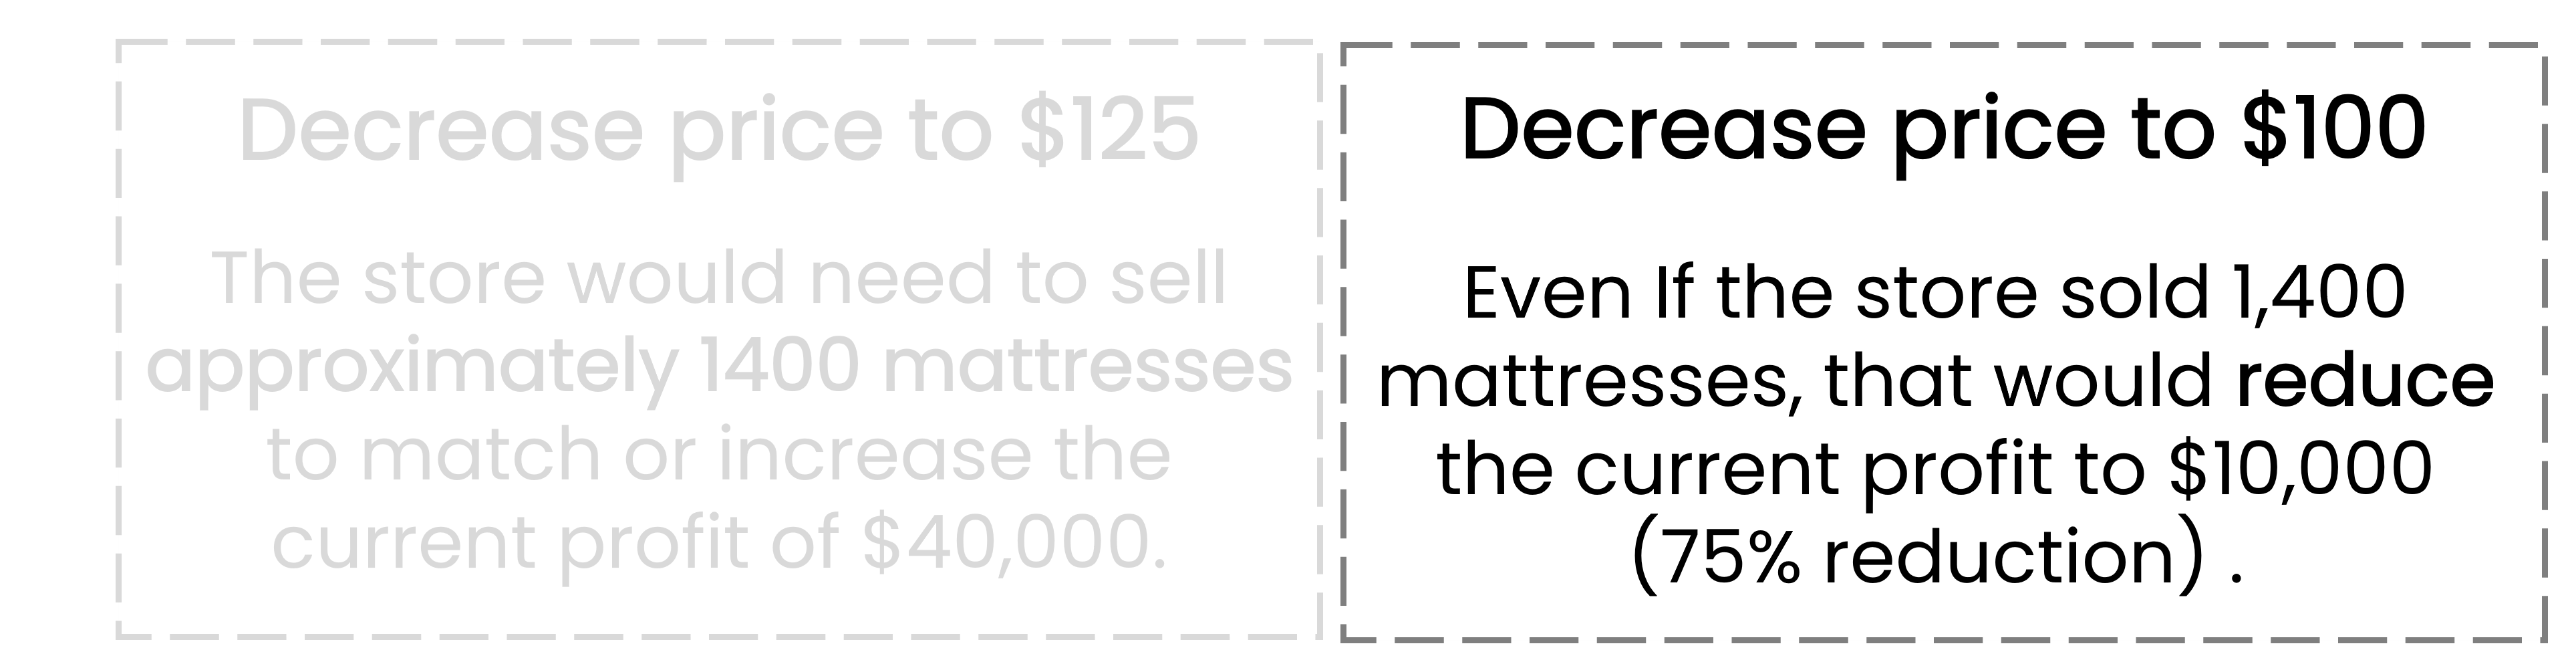
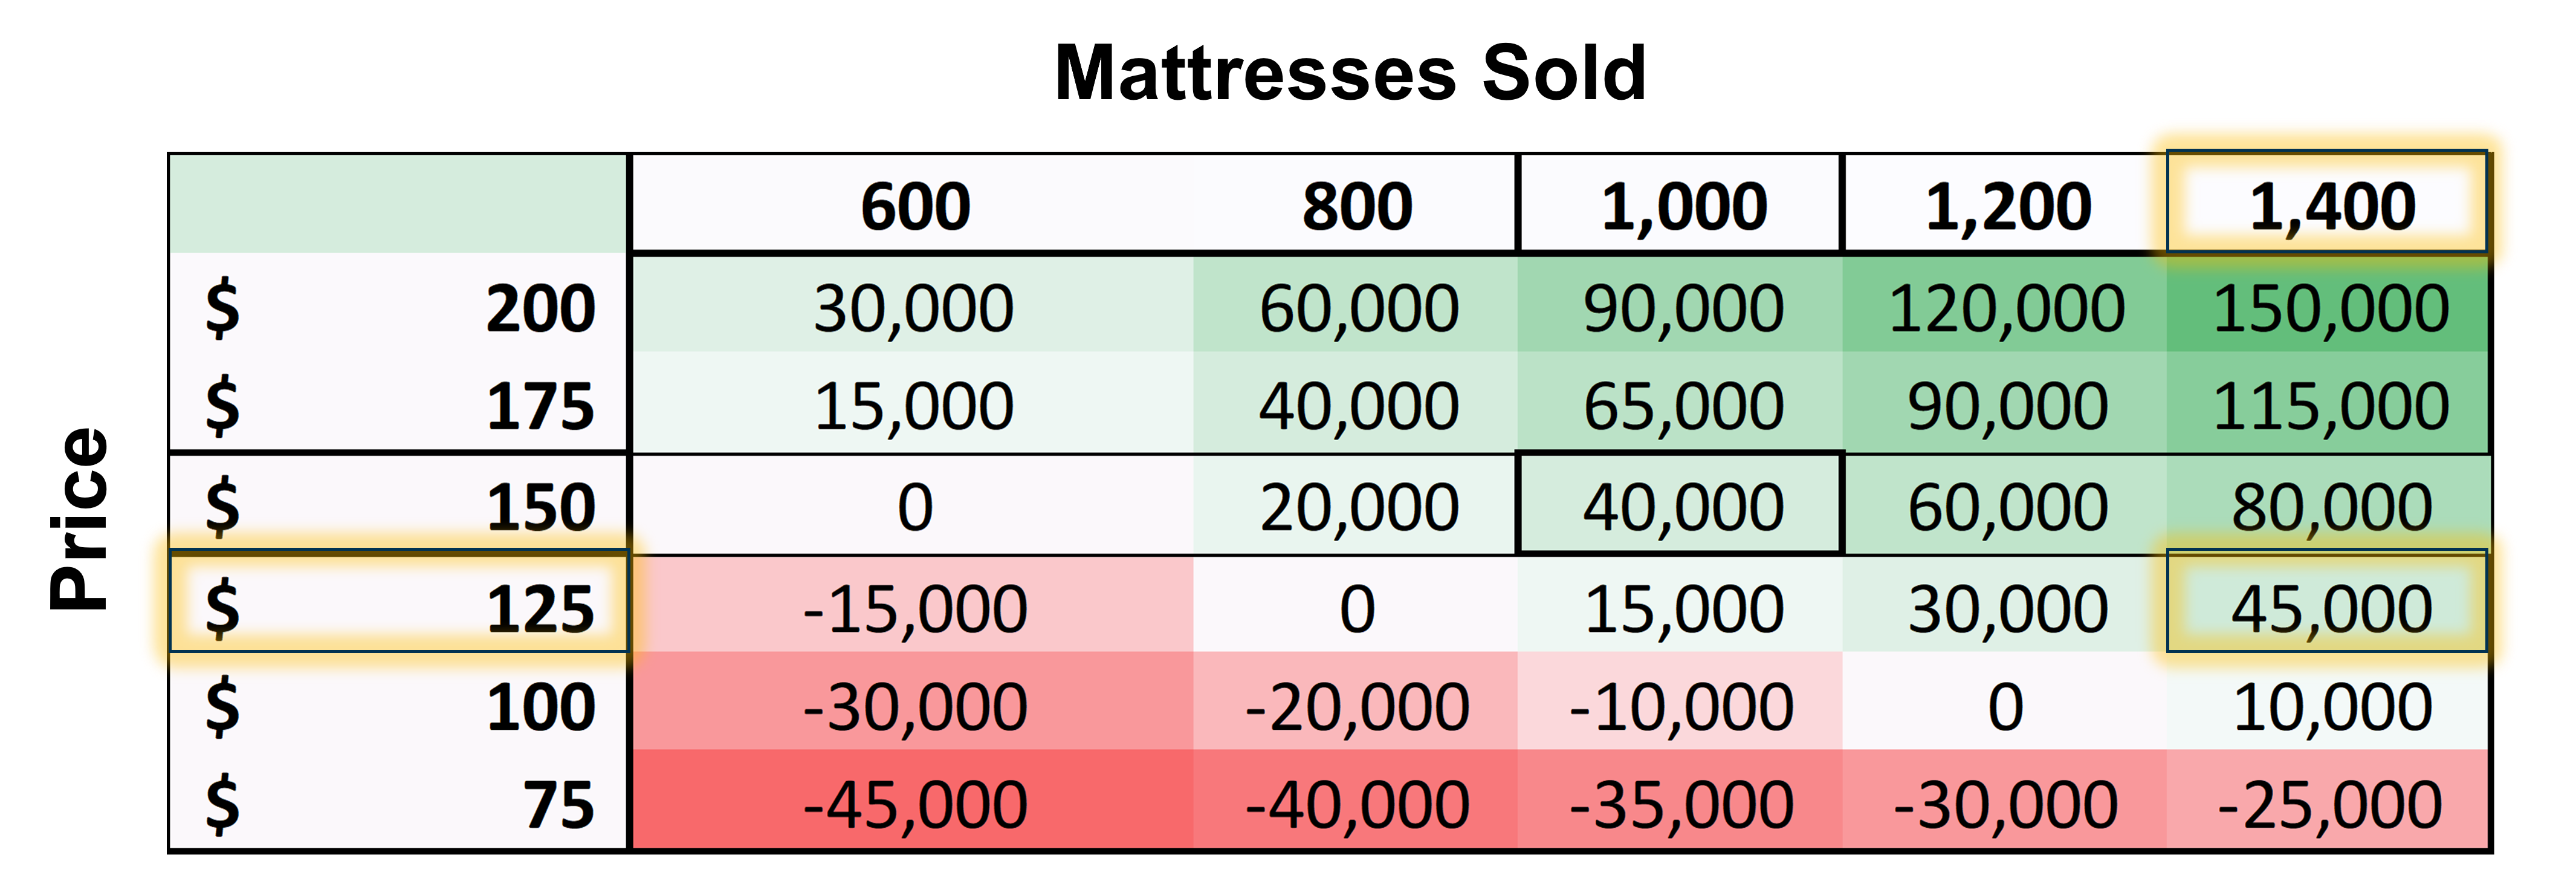
Applying Sensitivity Analysis
Two executives at the Mattress King are text messaging about the sales strategy:

Applying Sensitivity Analysis
Two executives at the Mattress King are text messaging about the sales strategy:

Applying Sensitivity Analysis
Two executives at the Mattress King are text messaging about the sales strategy:

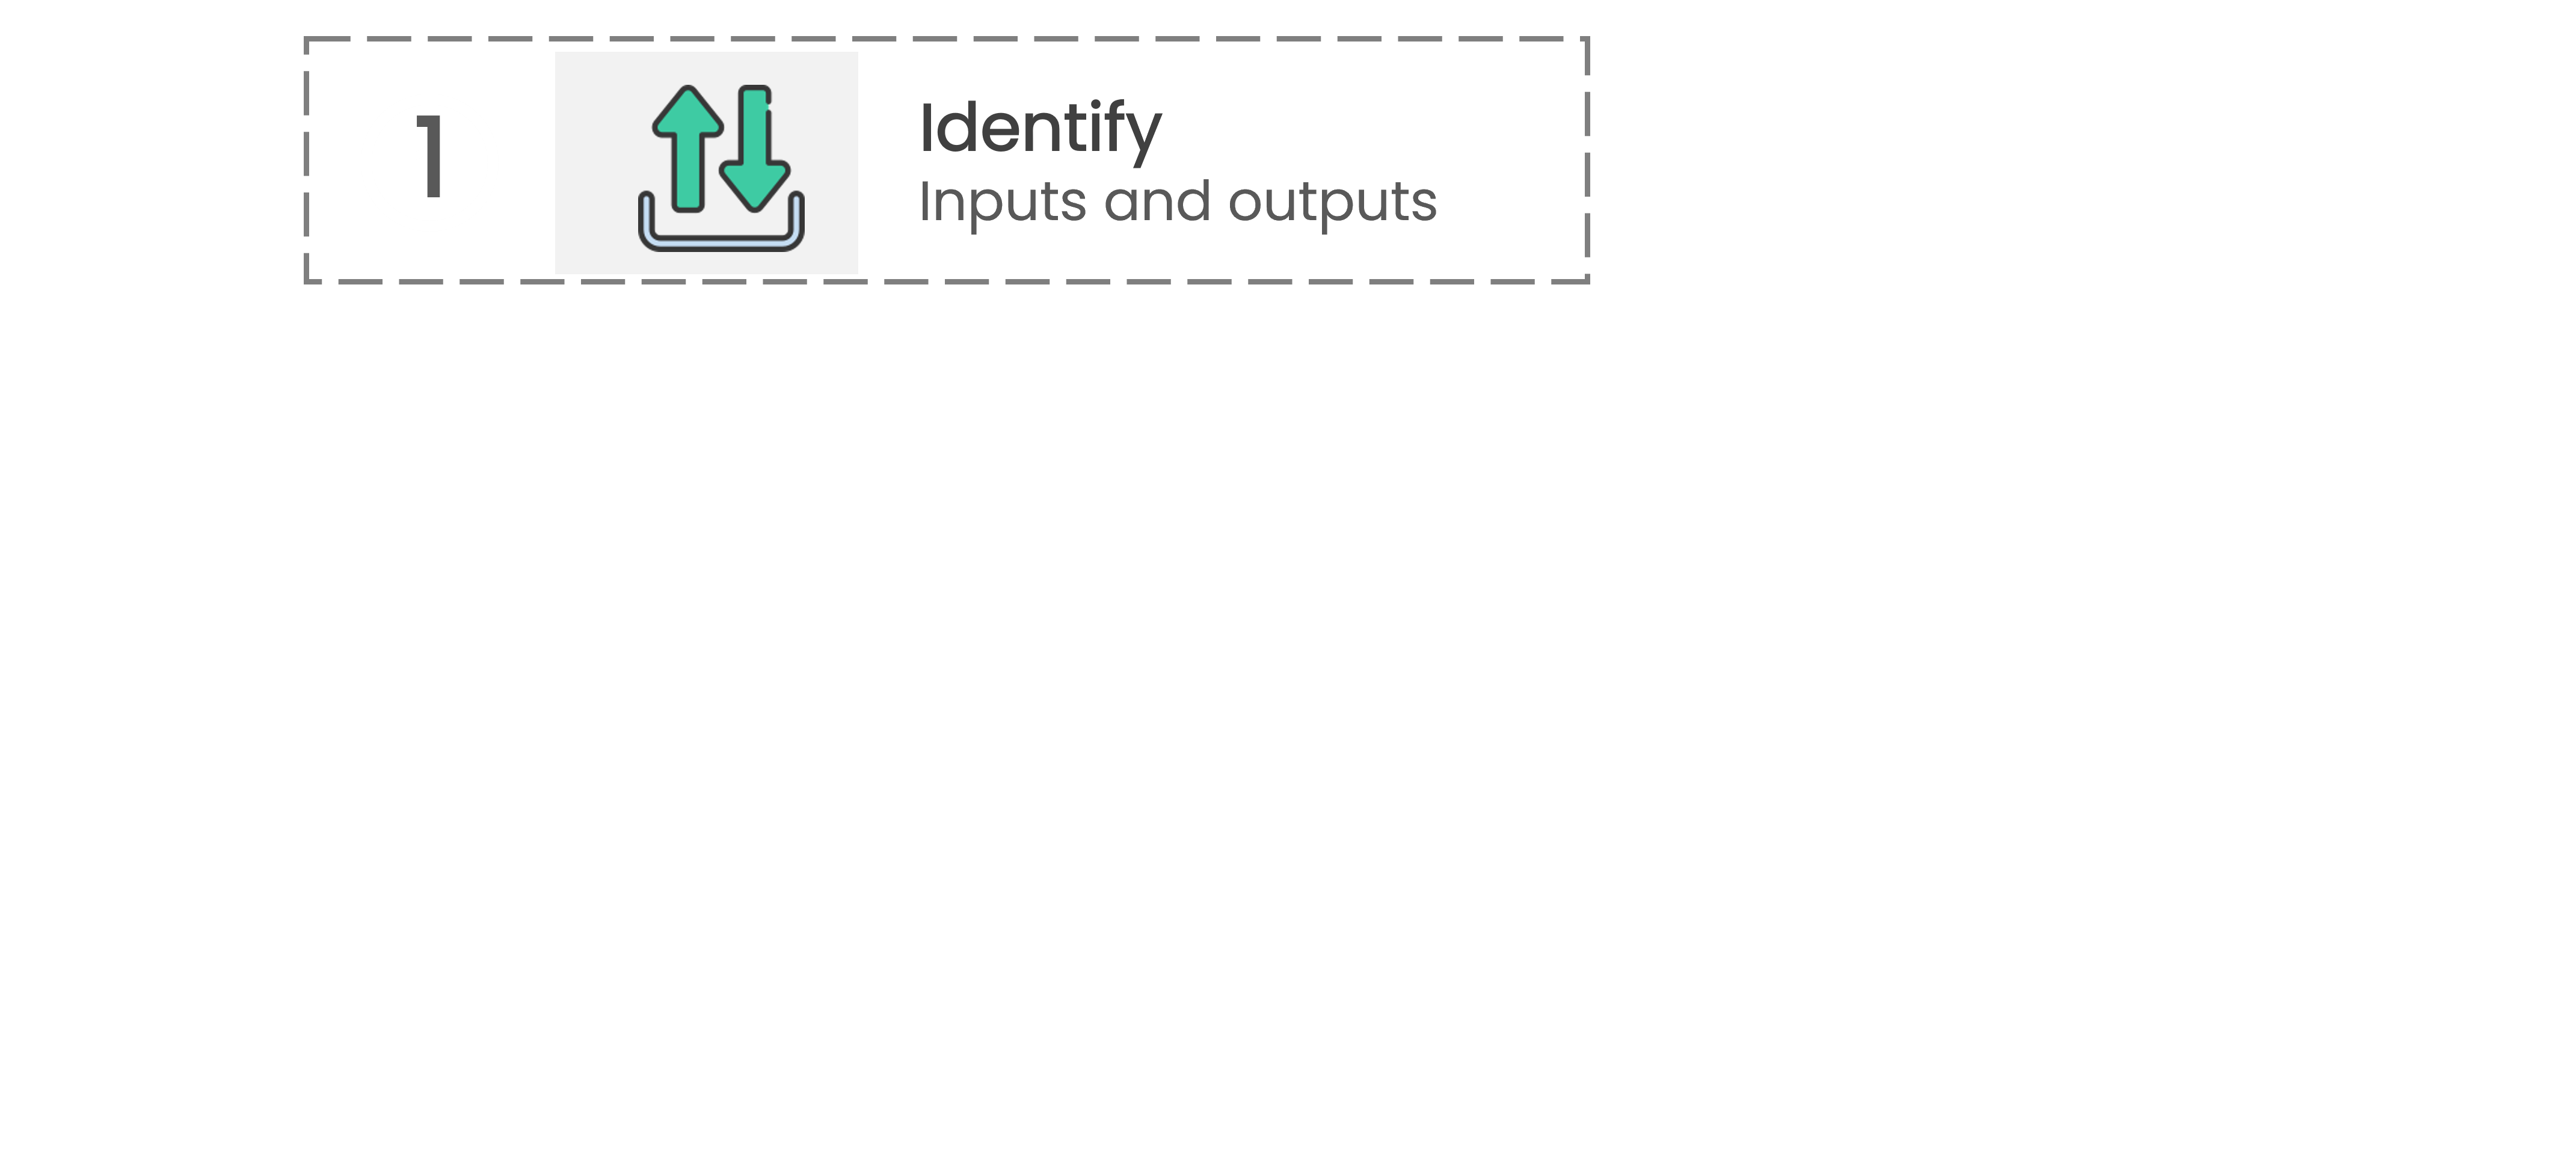
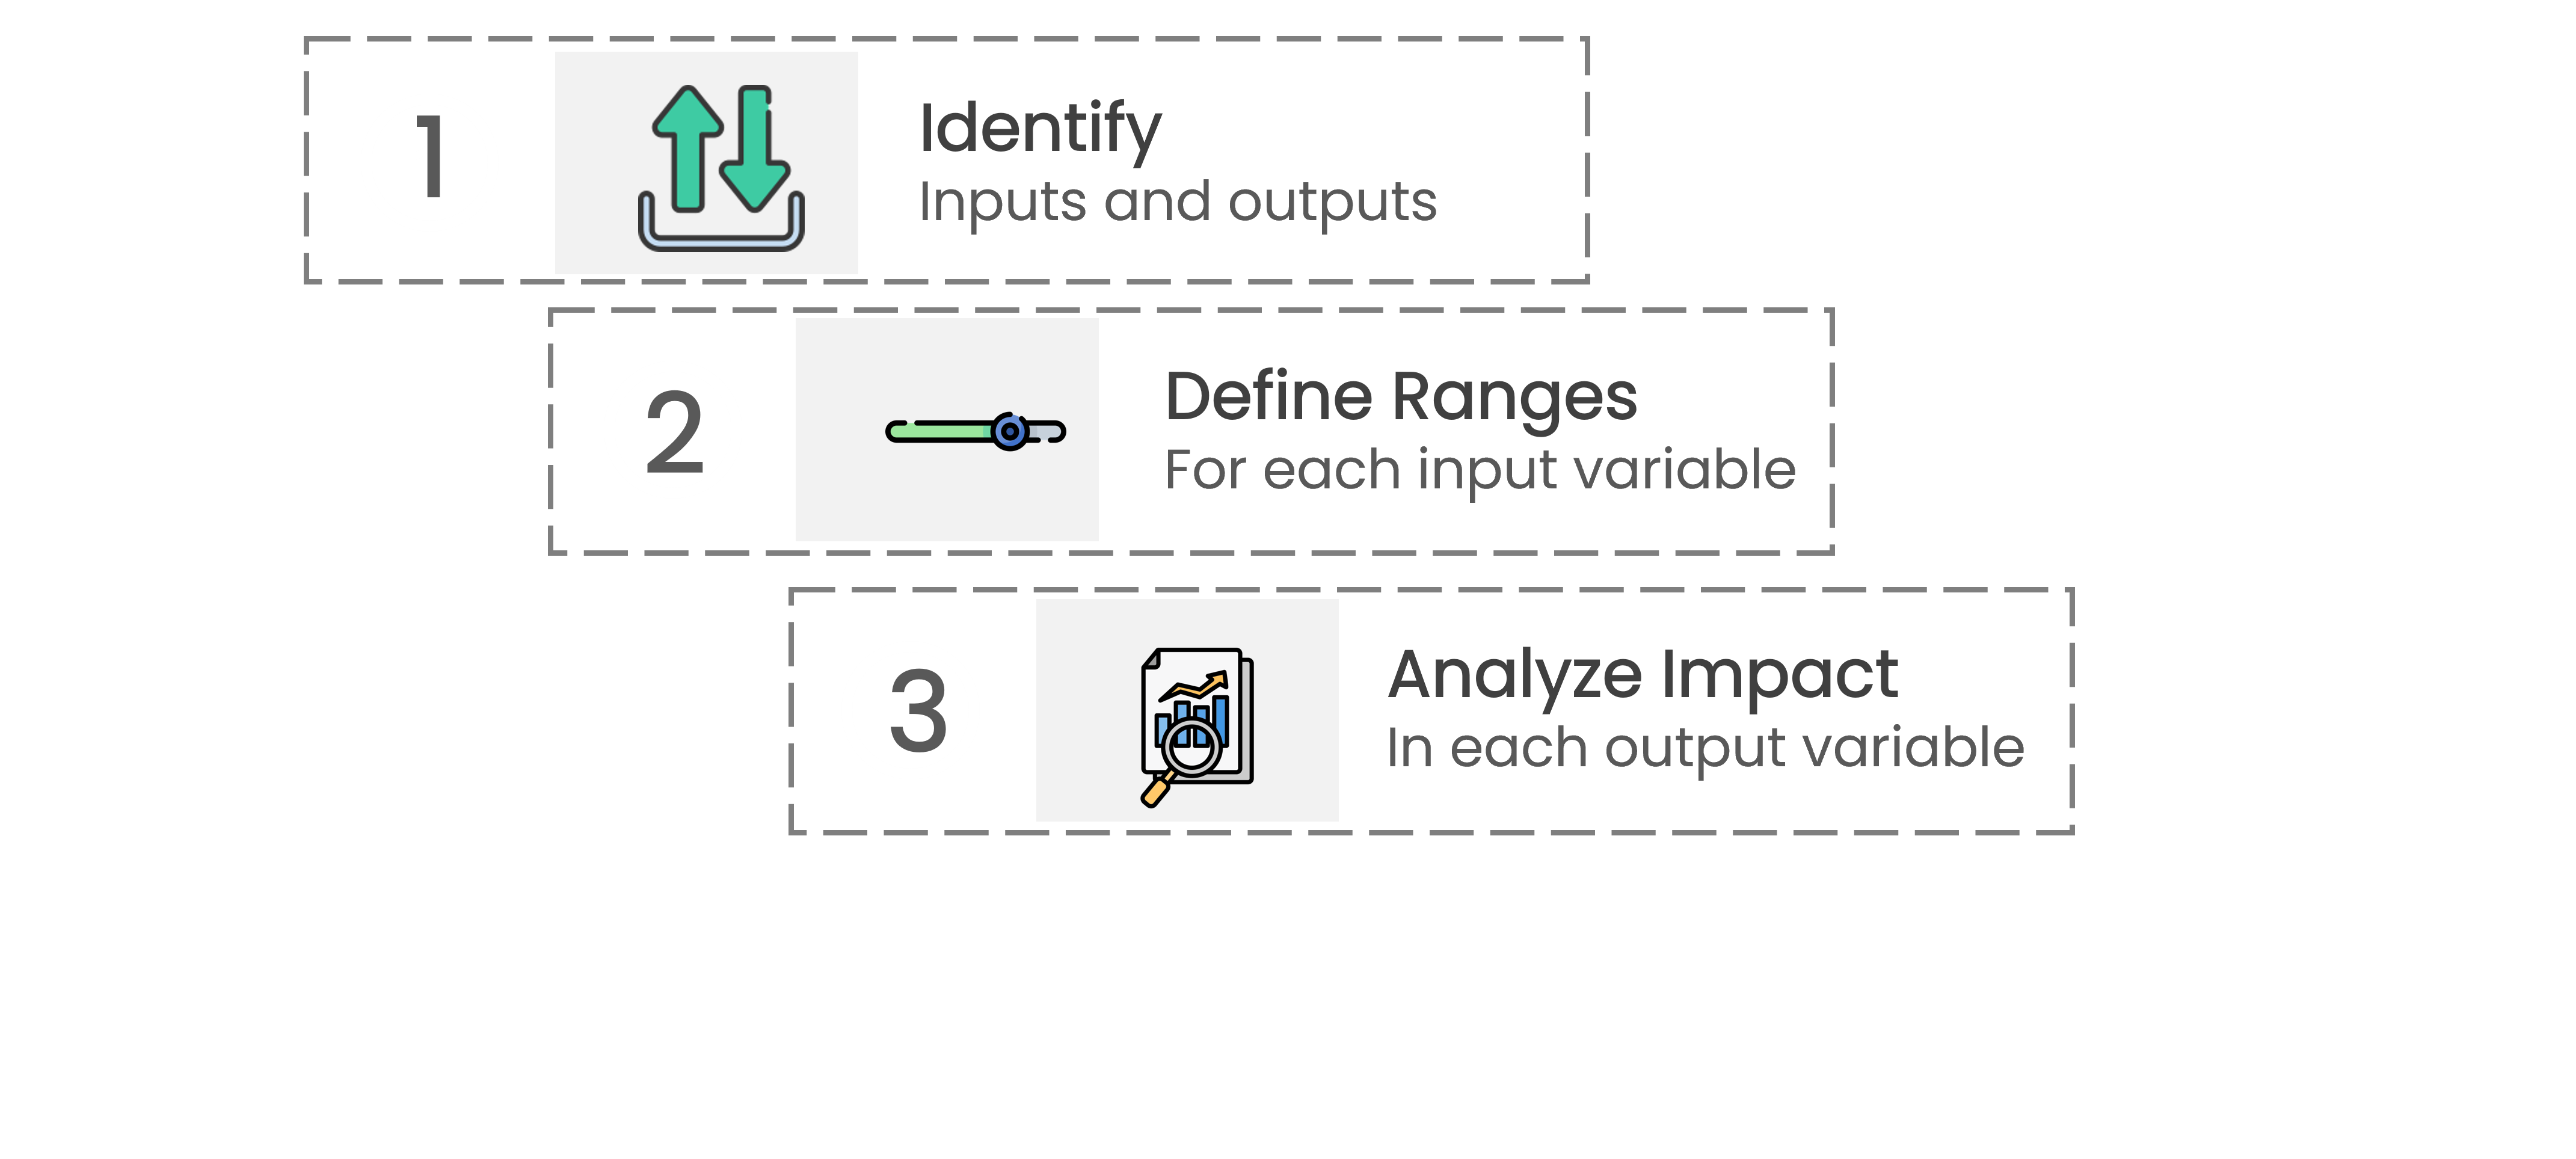
Identifying inputs and outputs

Identifying inputs and outputs
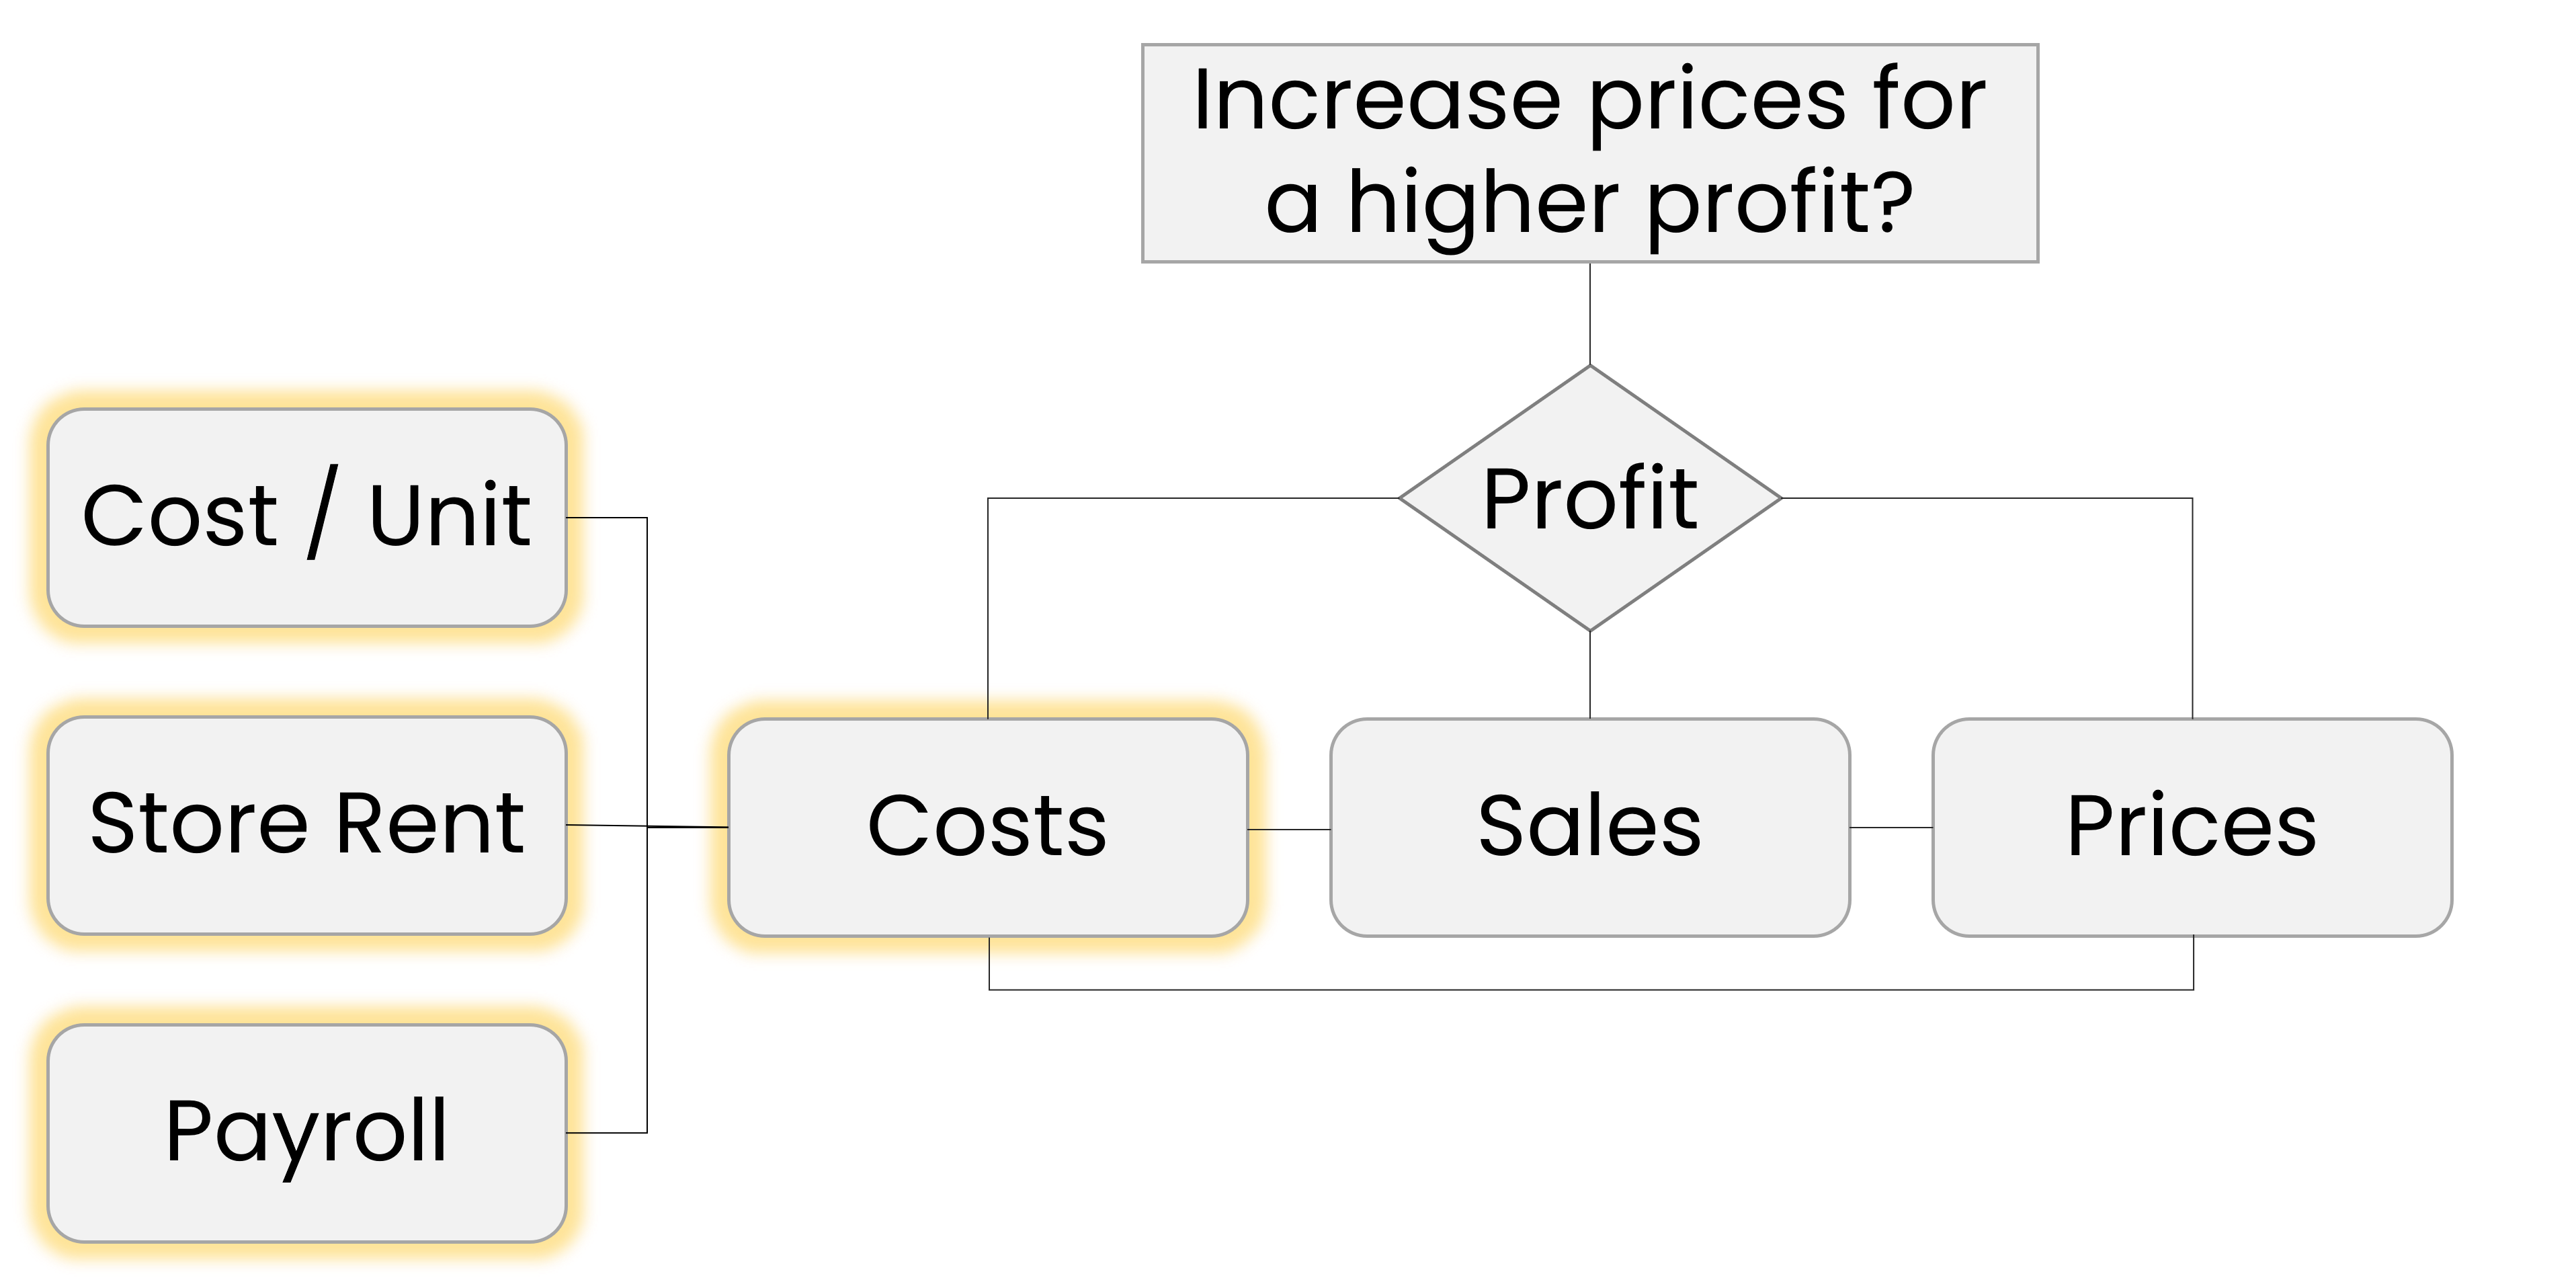
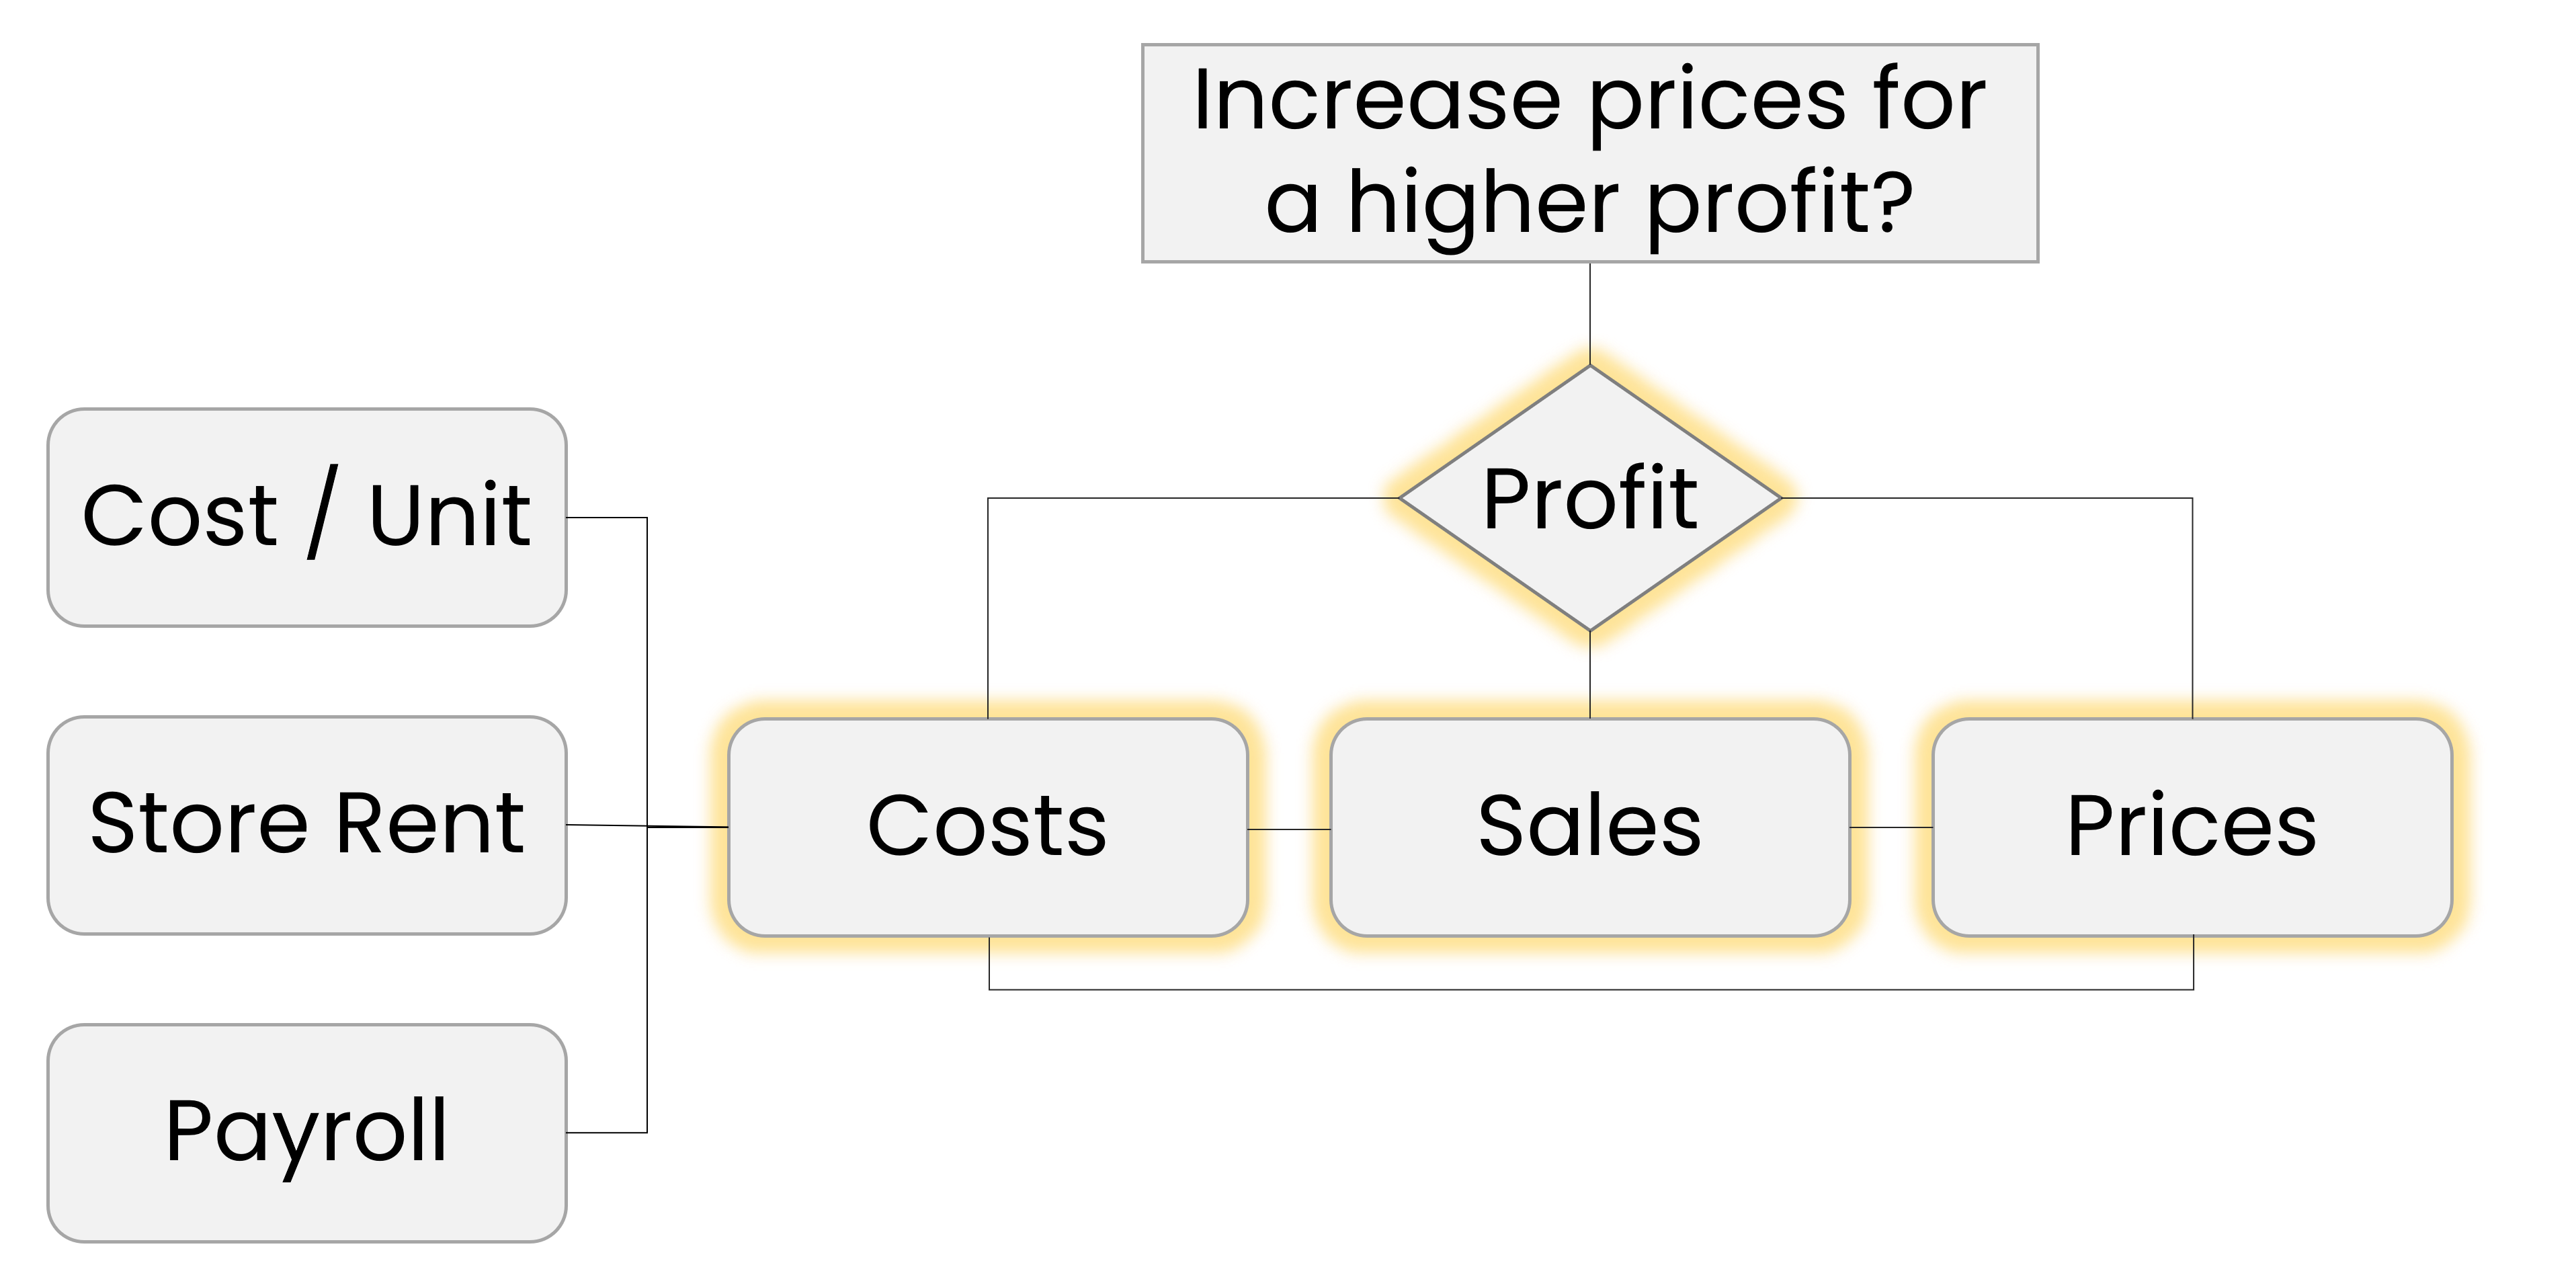
Classifying variables

Classifying variables
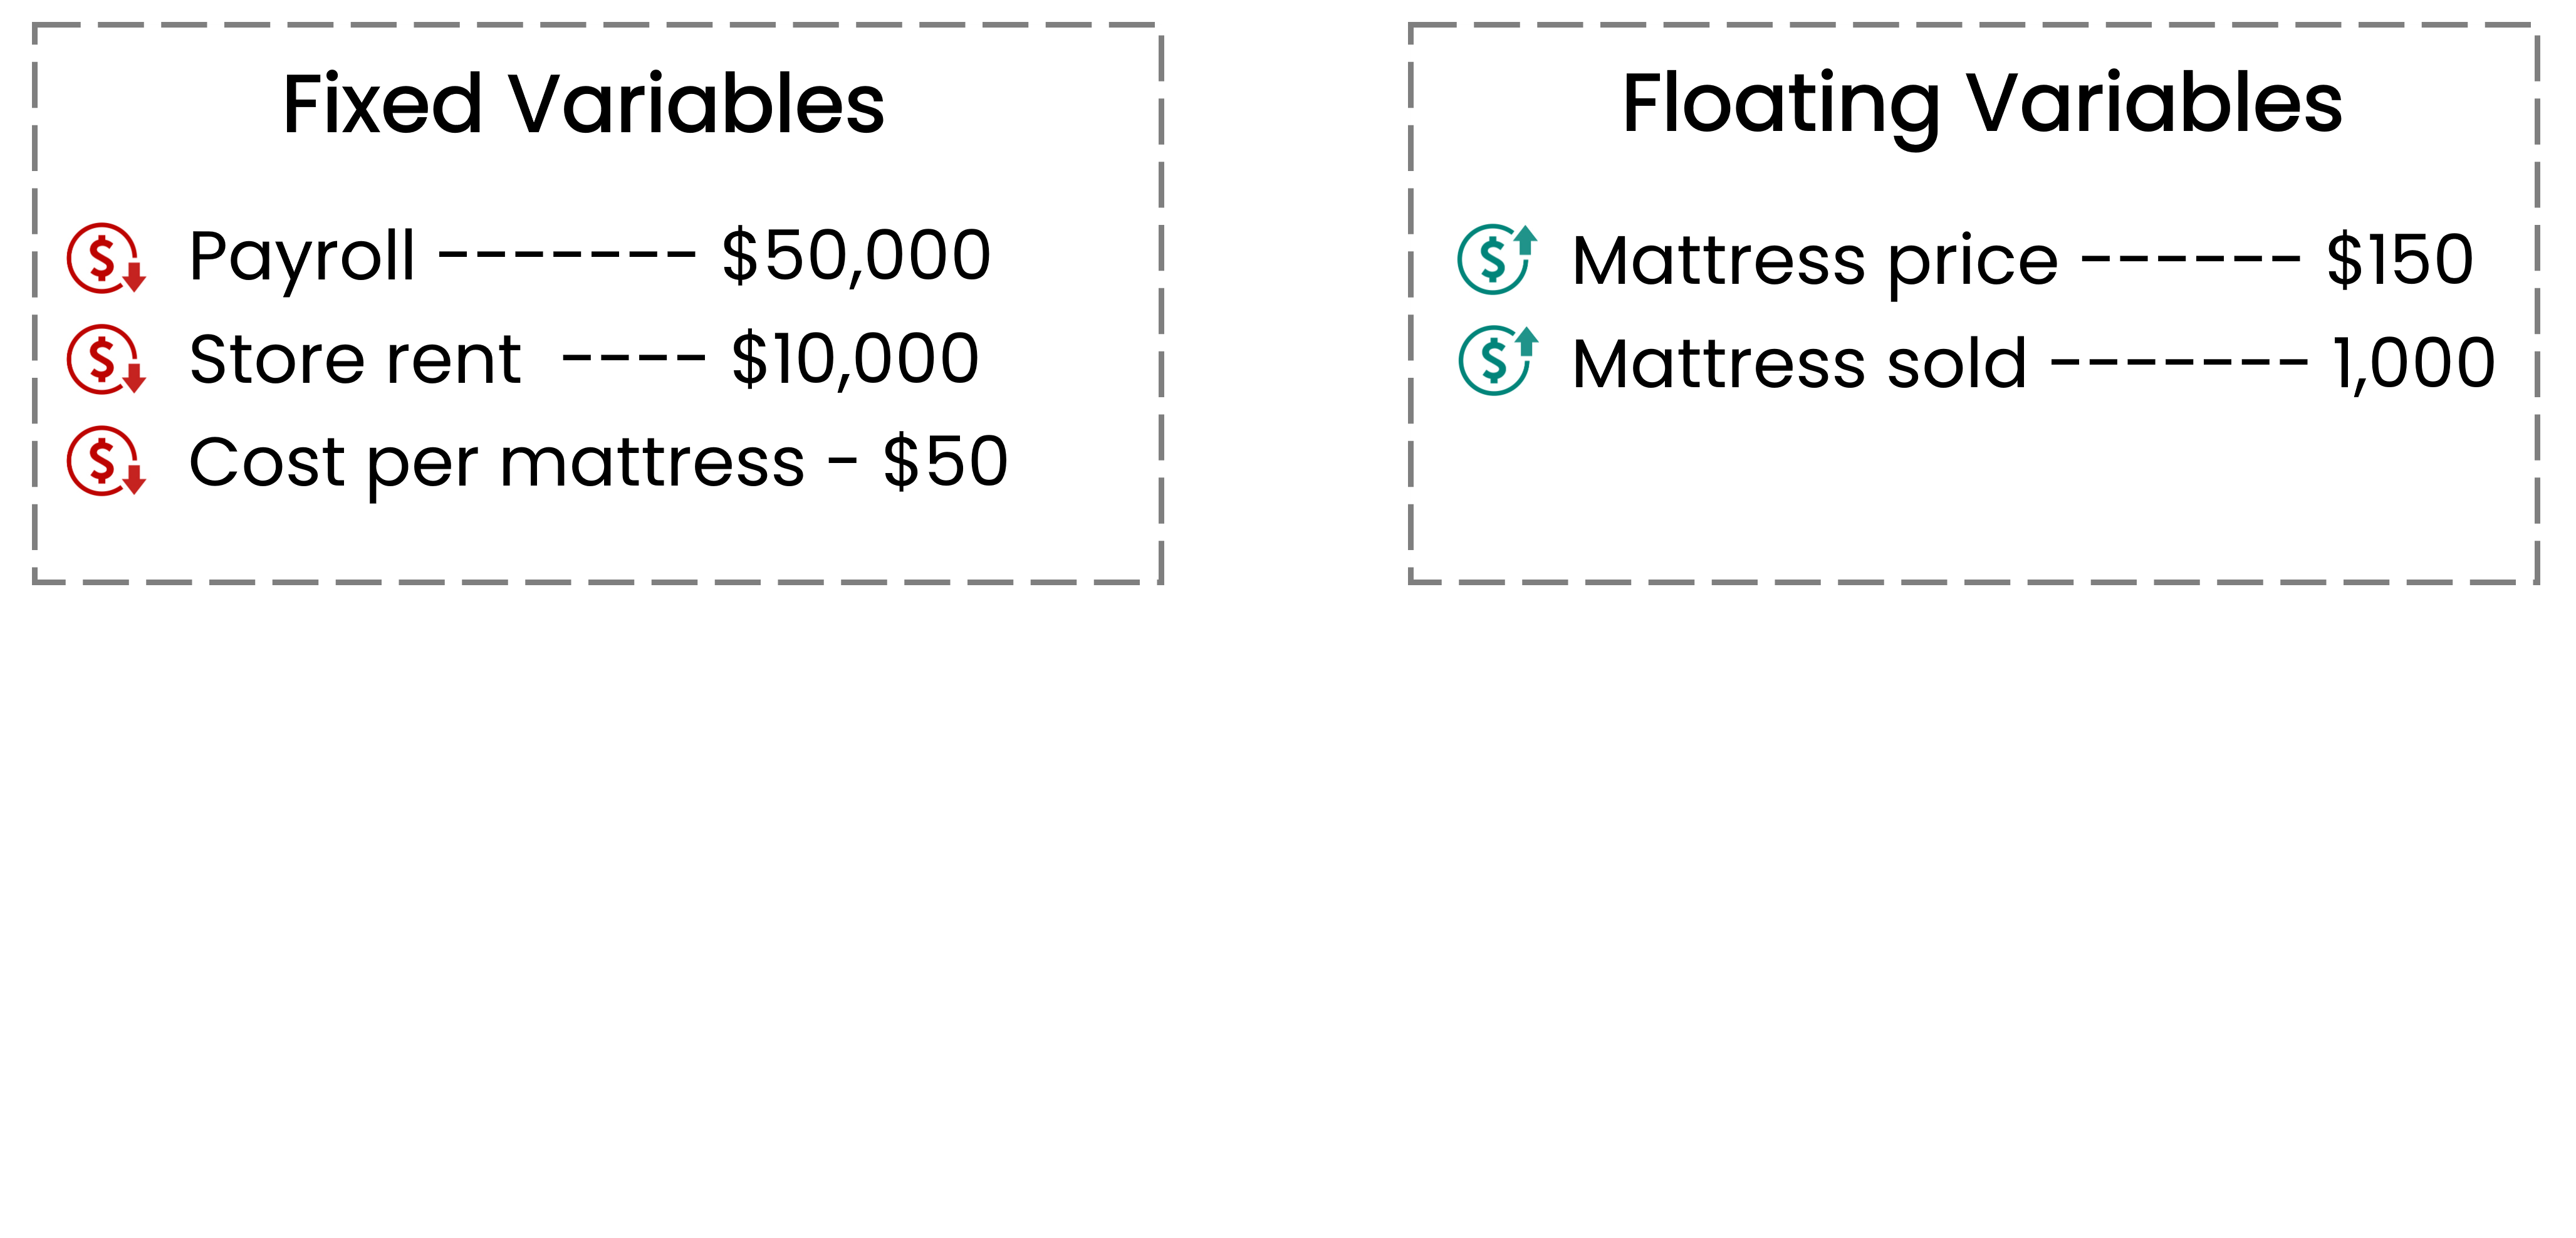
Classifying variables
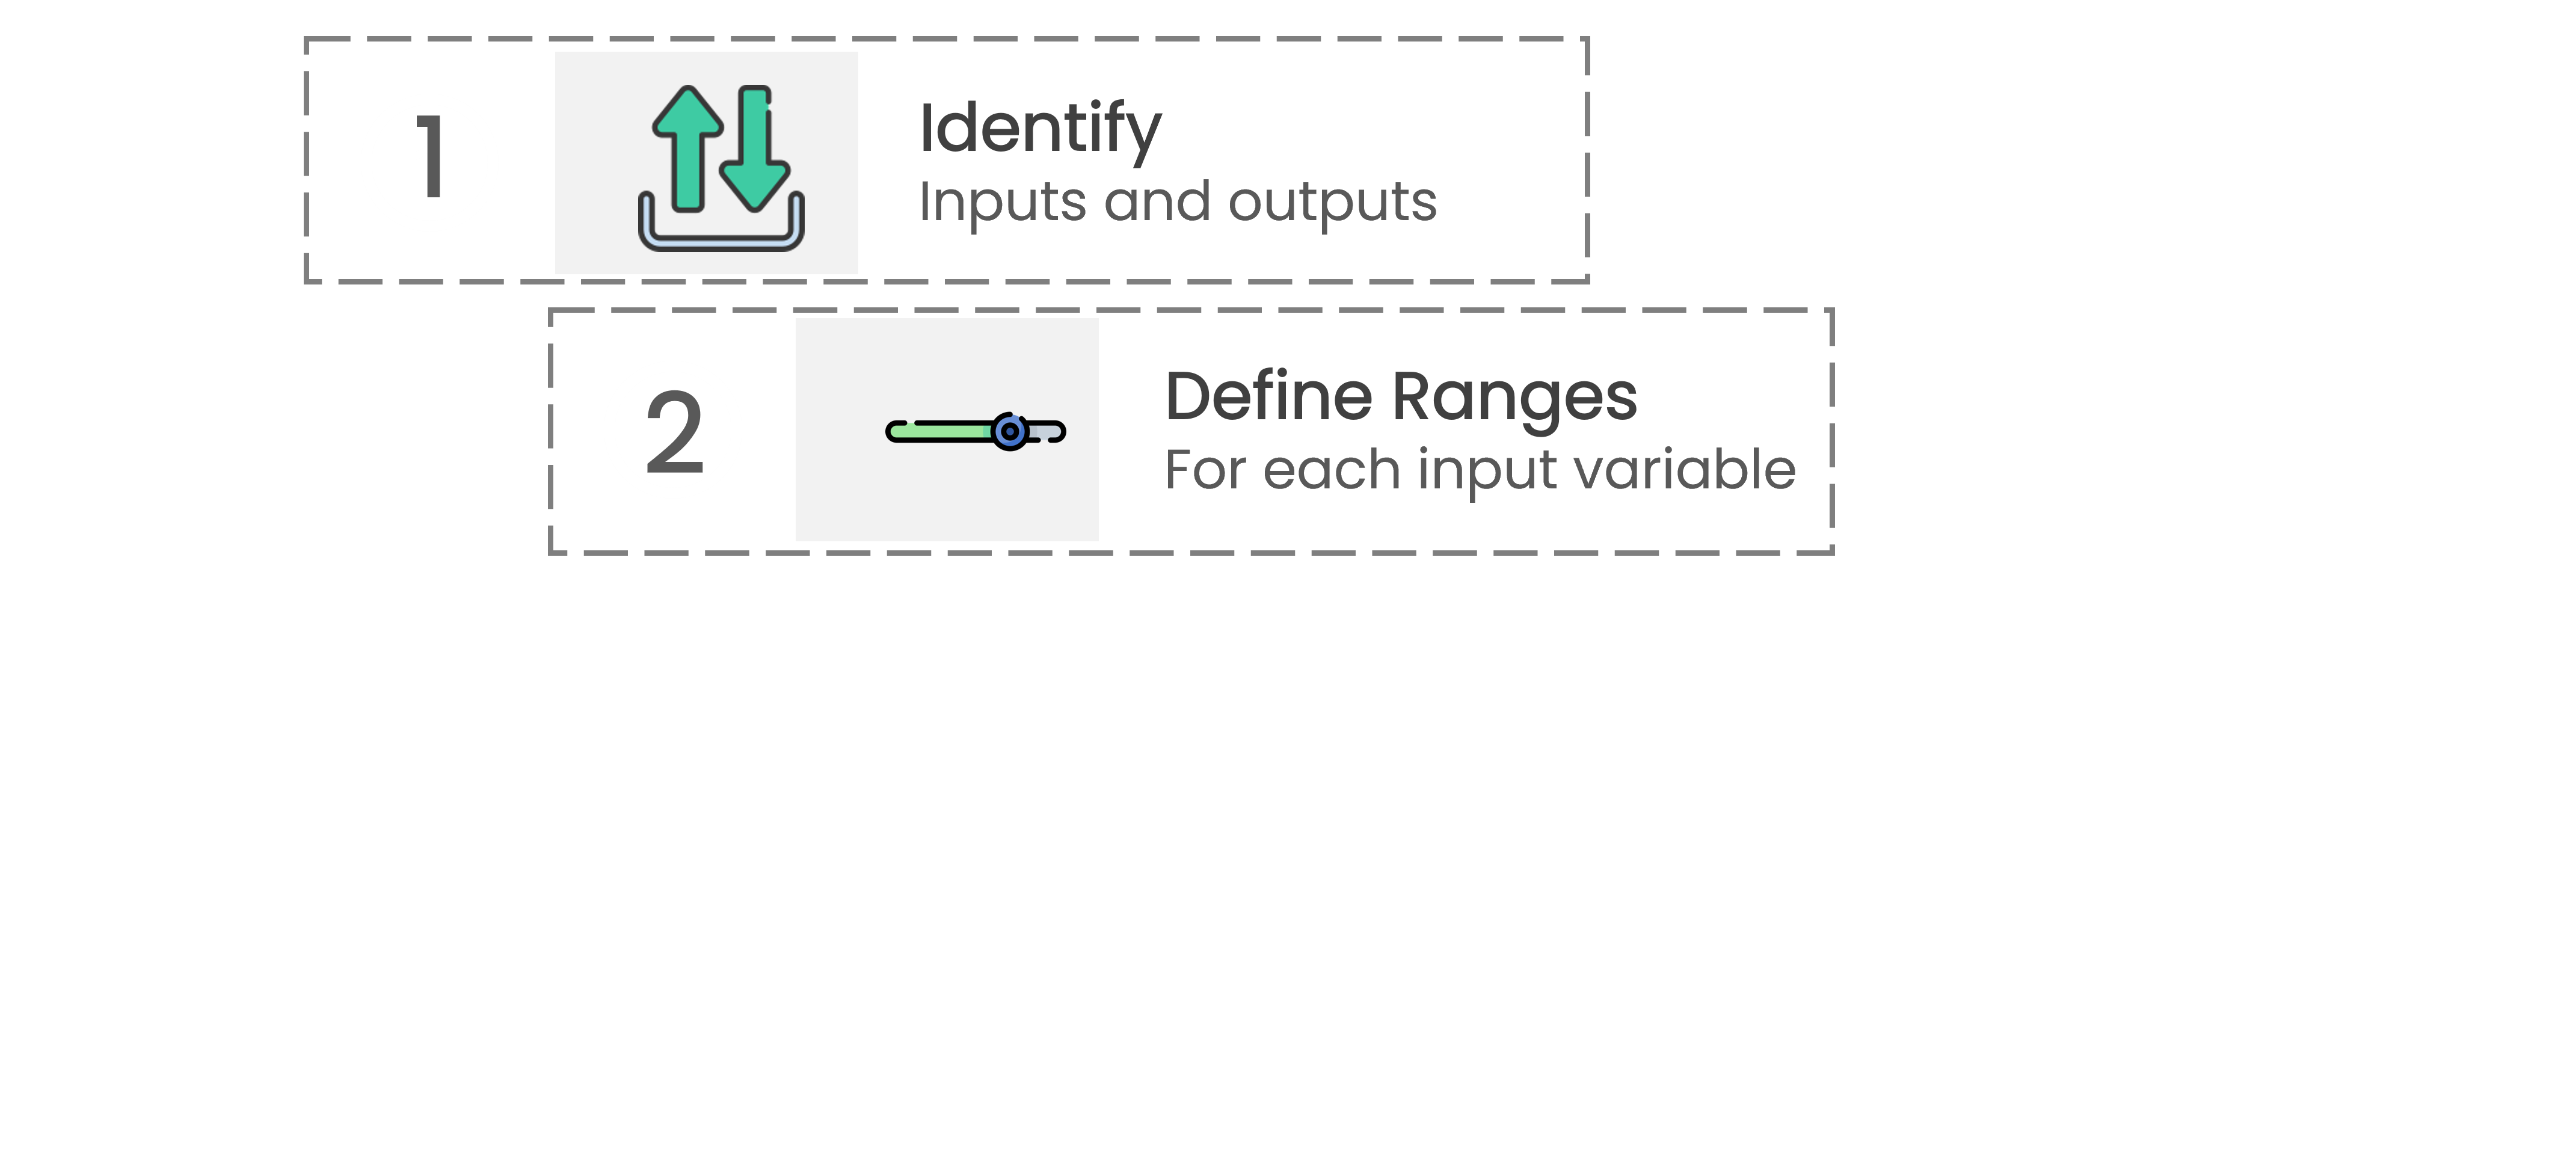
Defining ranges of variables

Defining ranges of variables
Defining ranges of variables
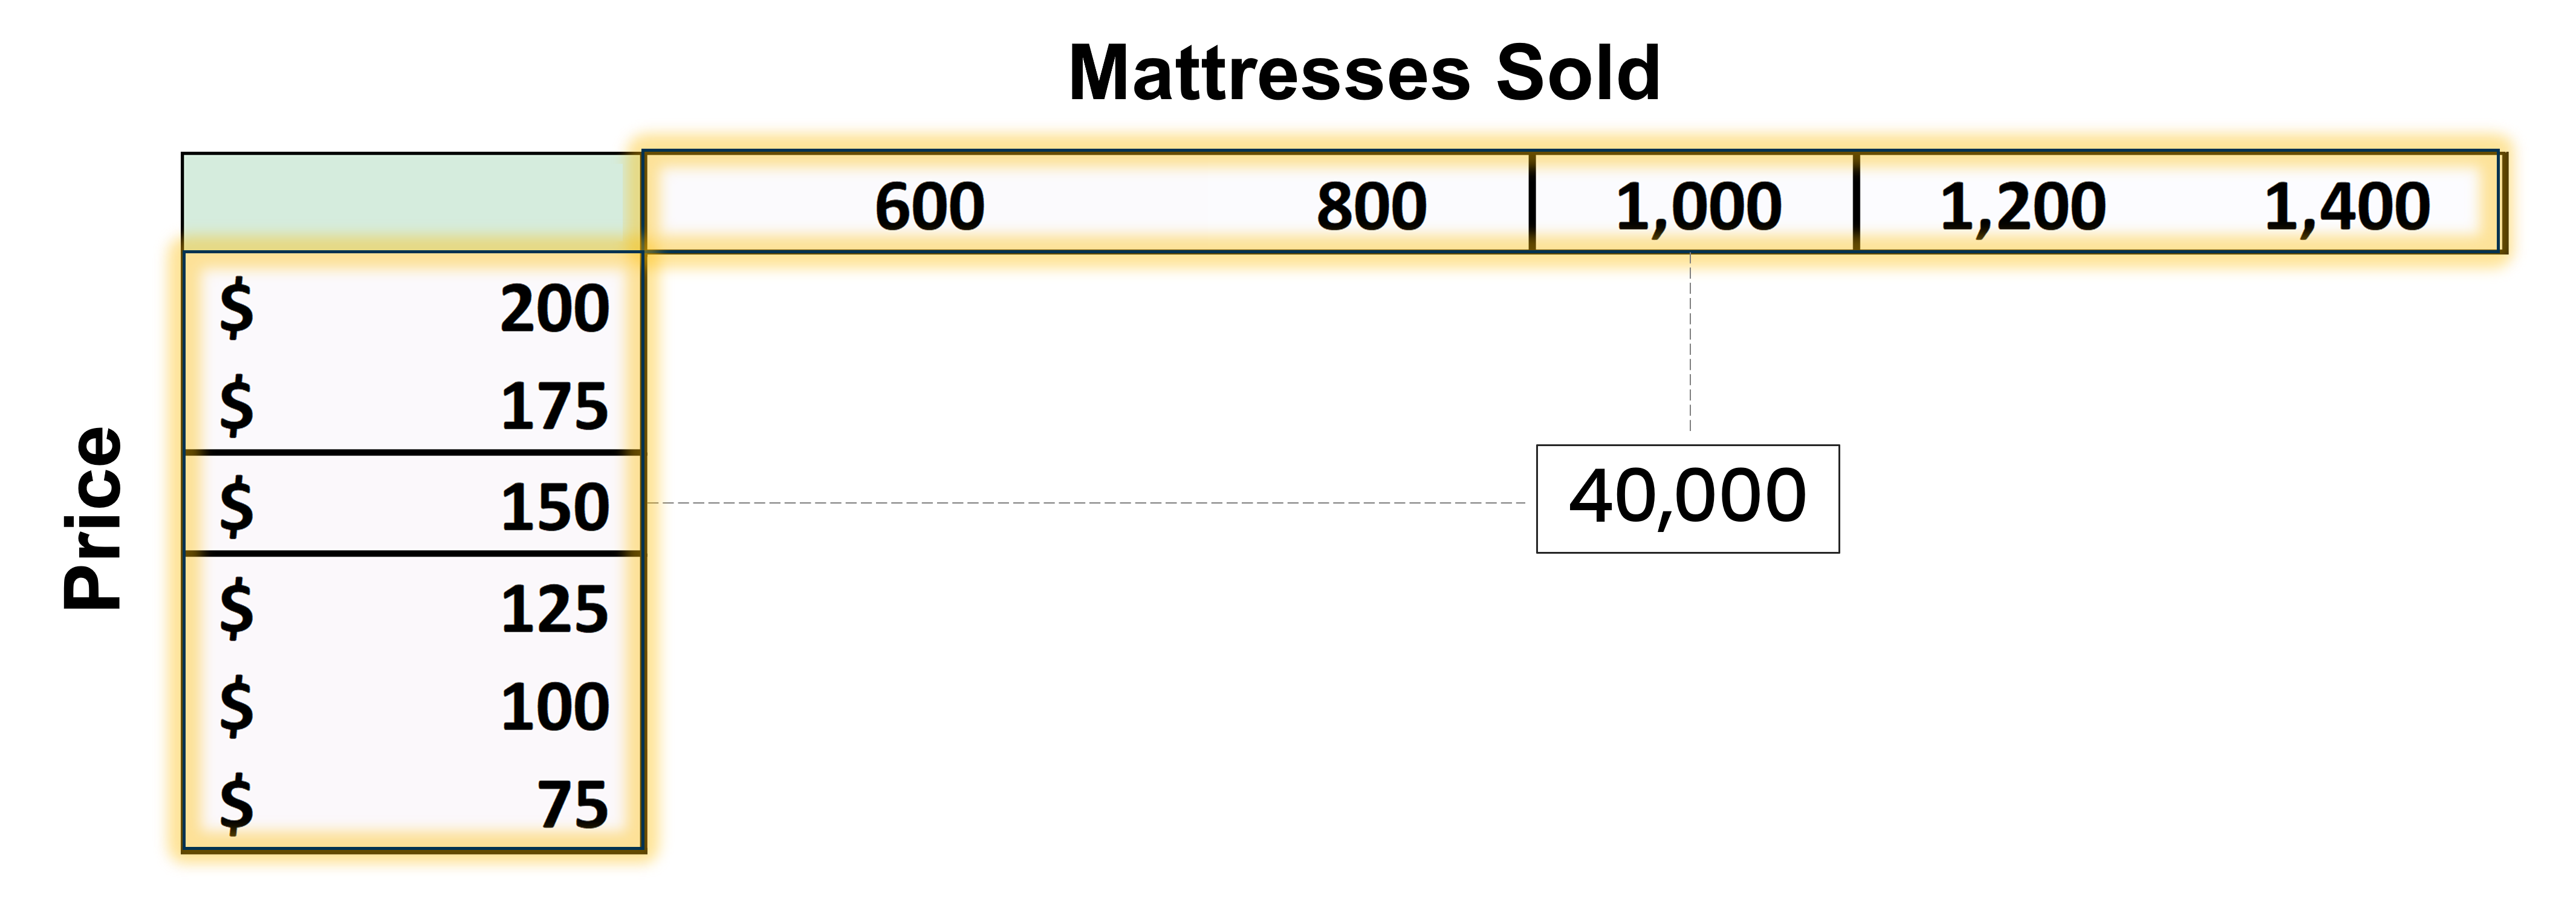
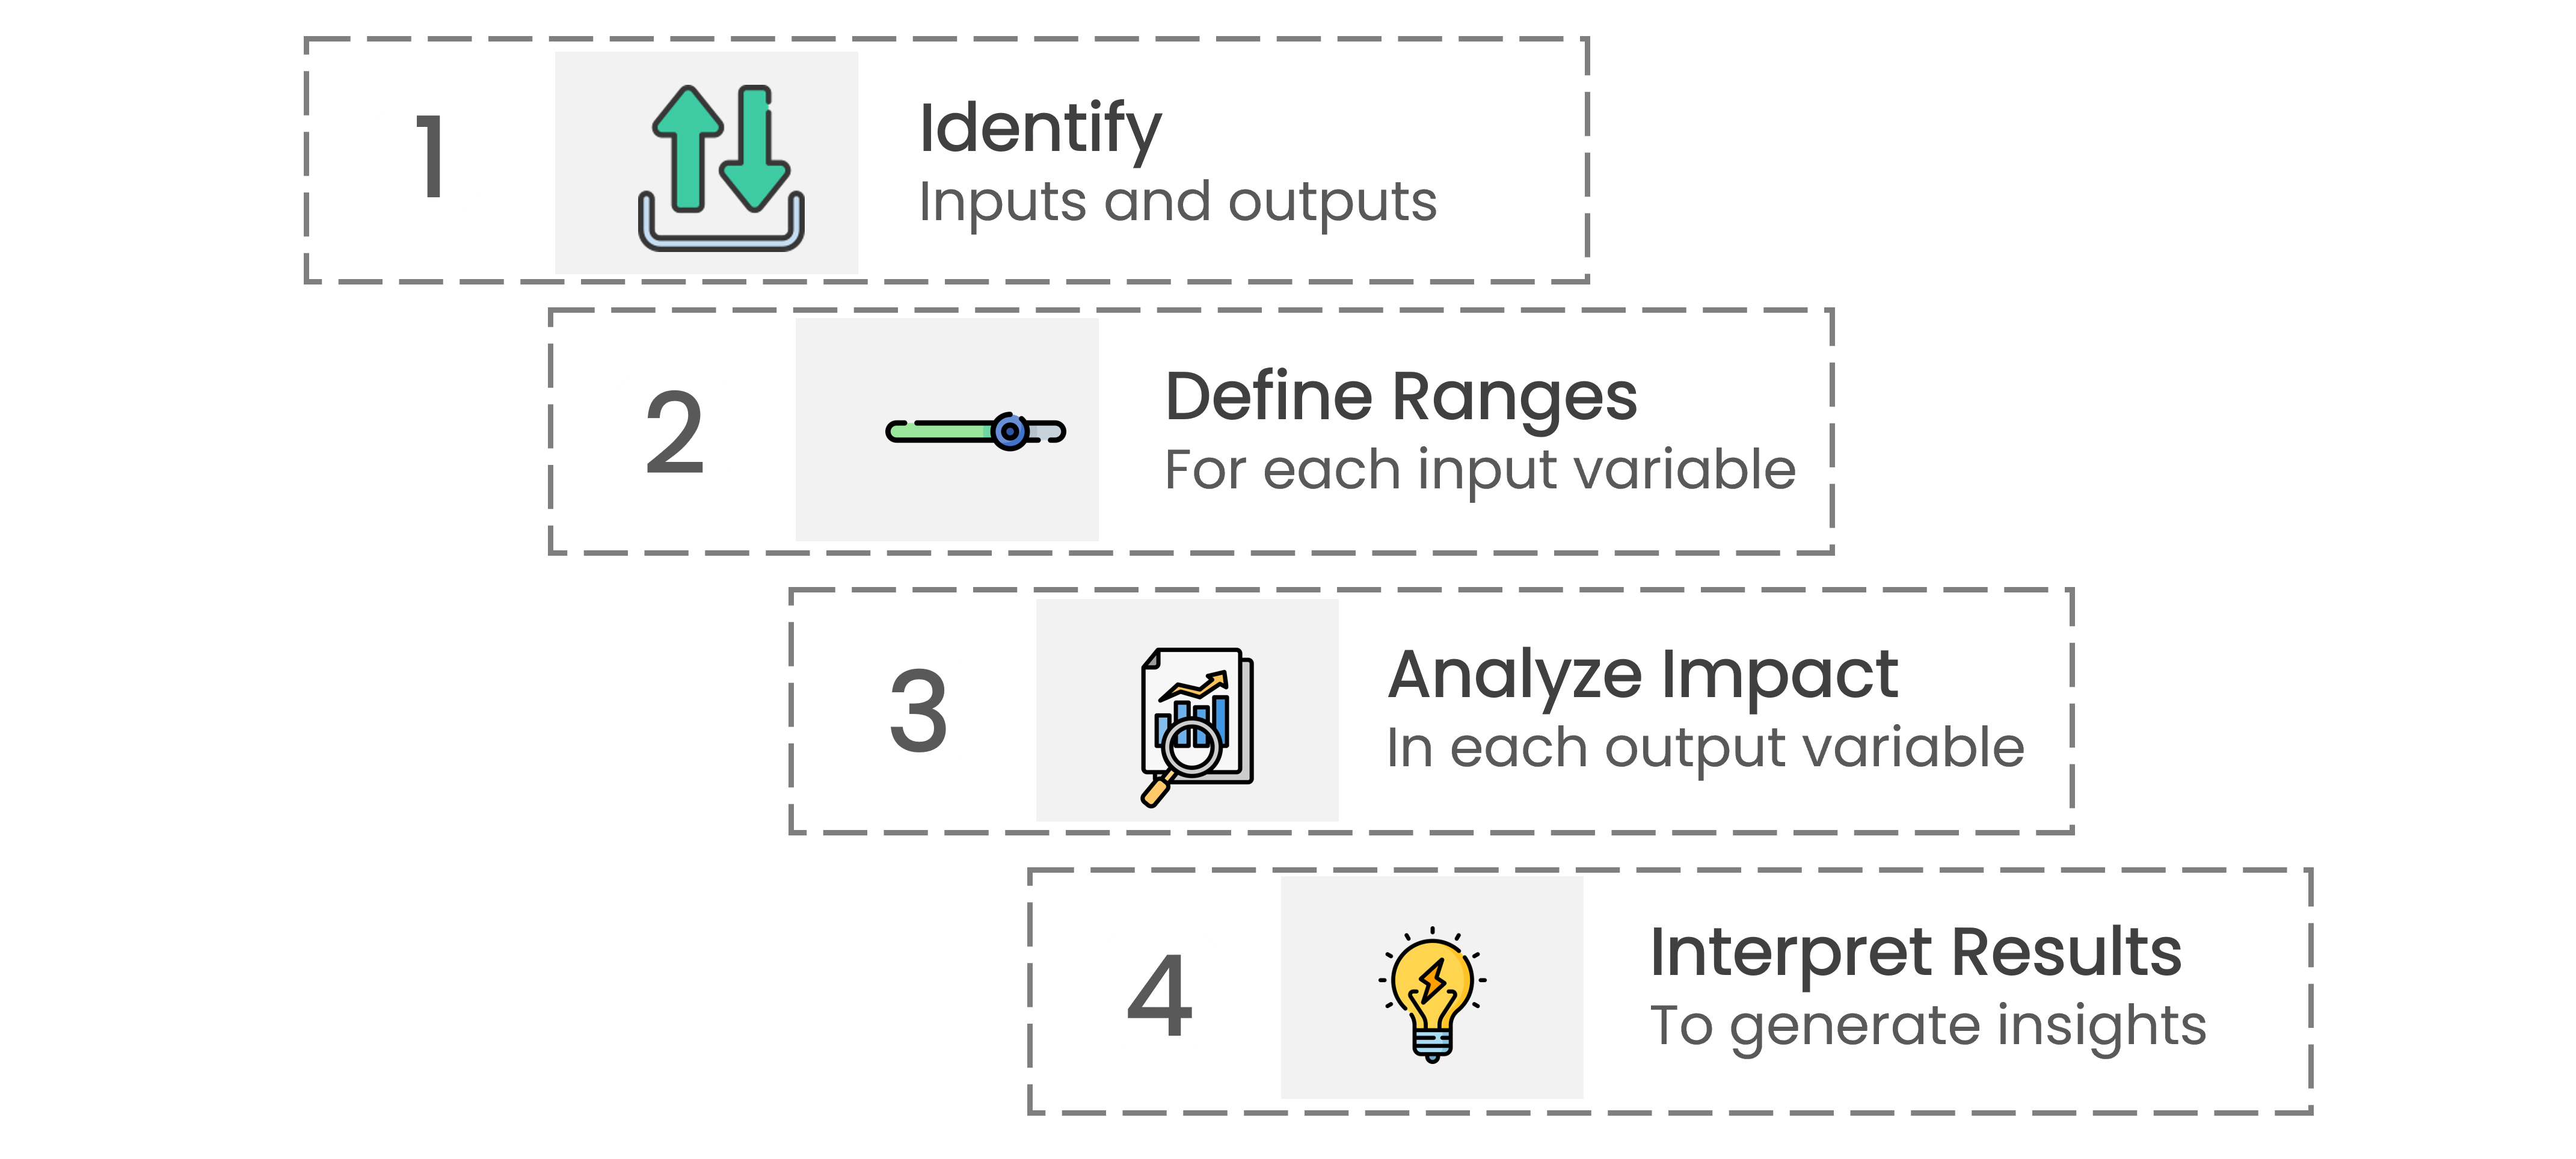
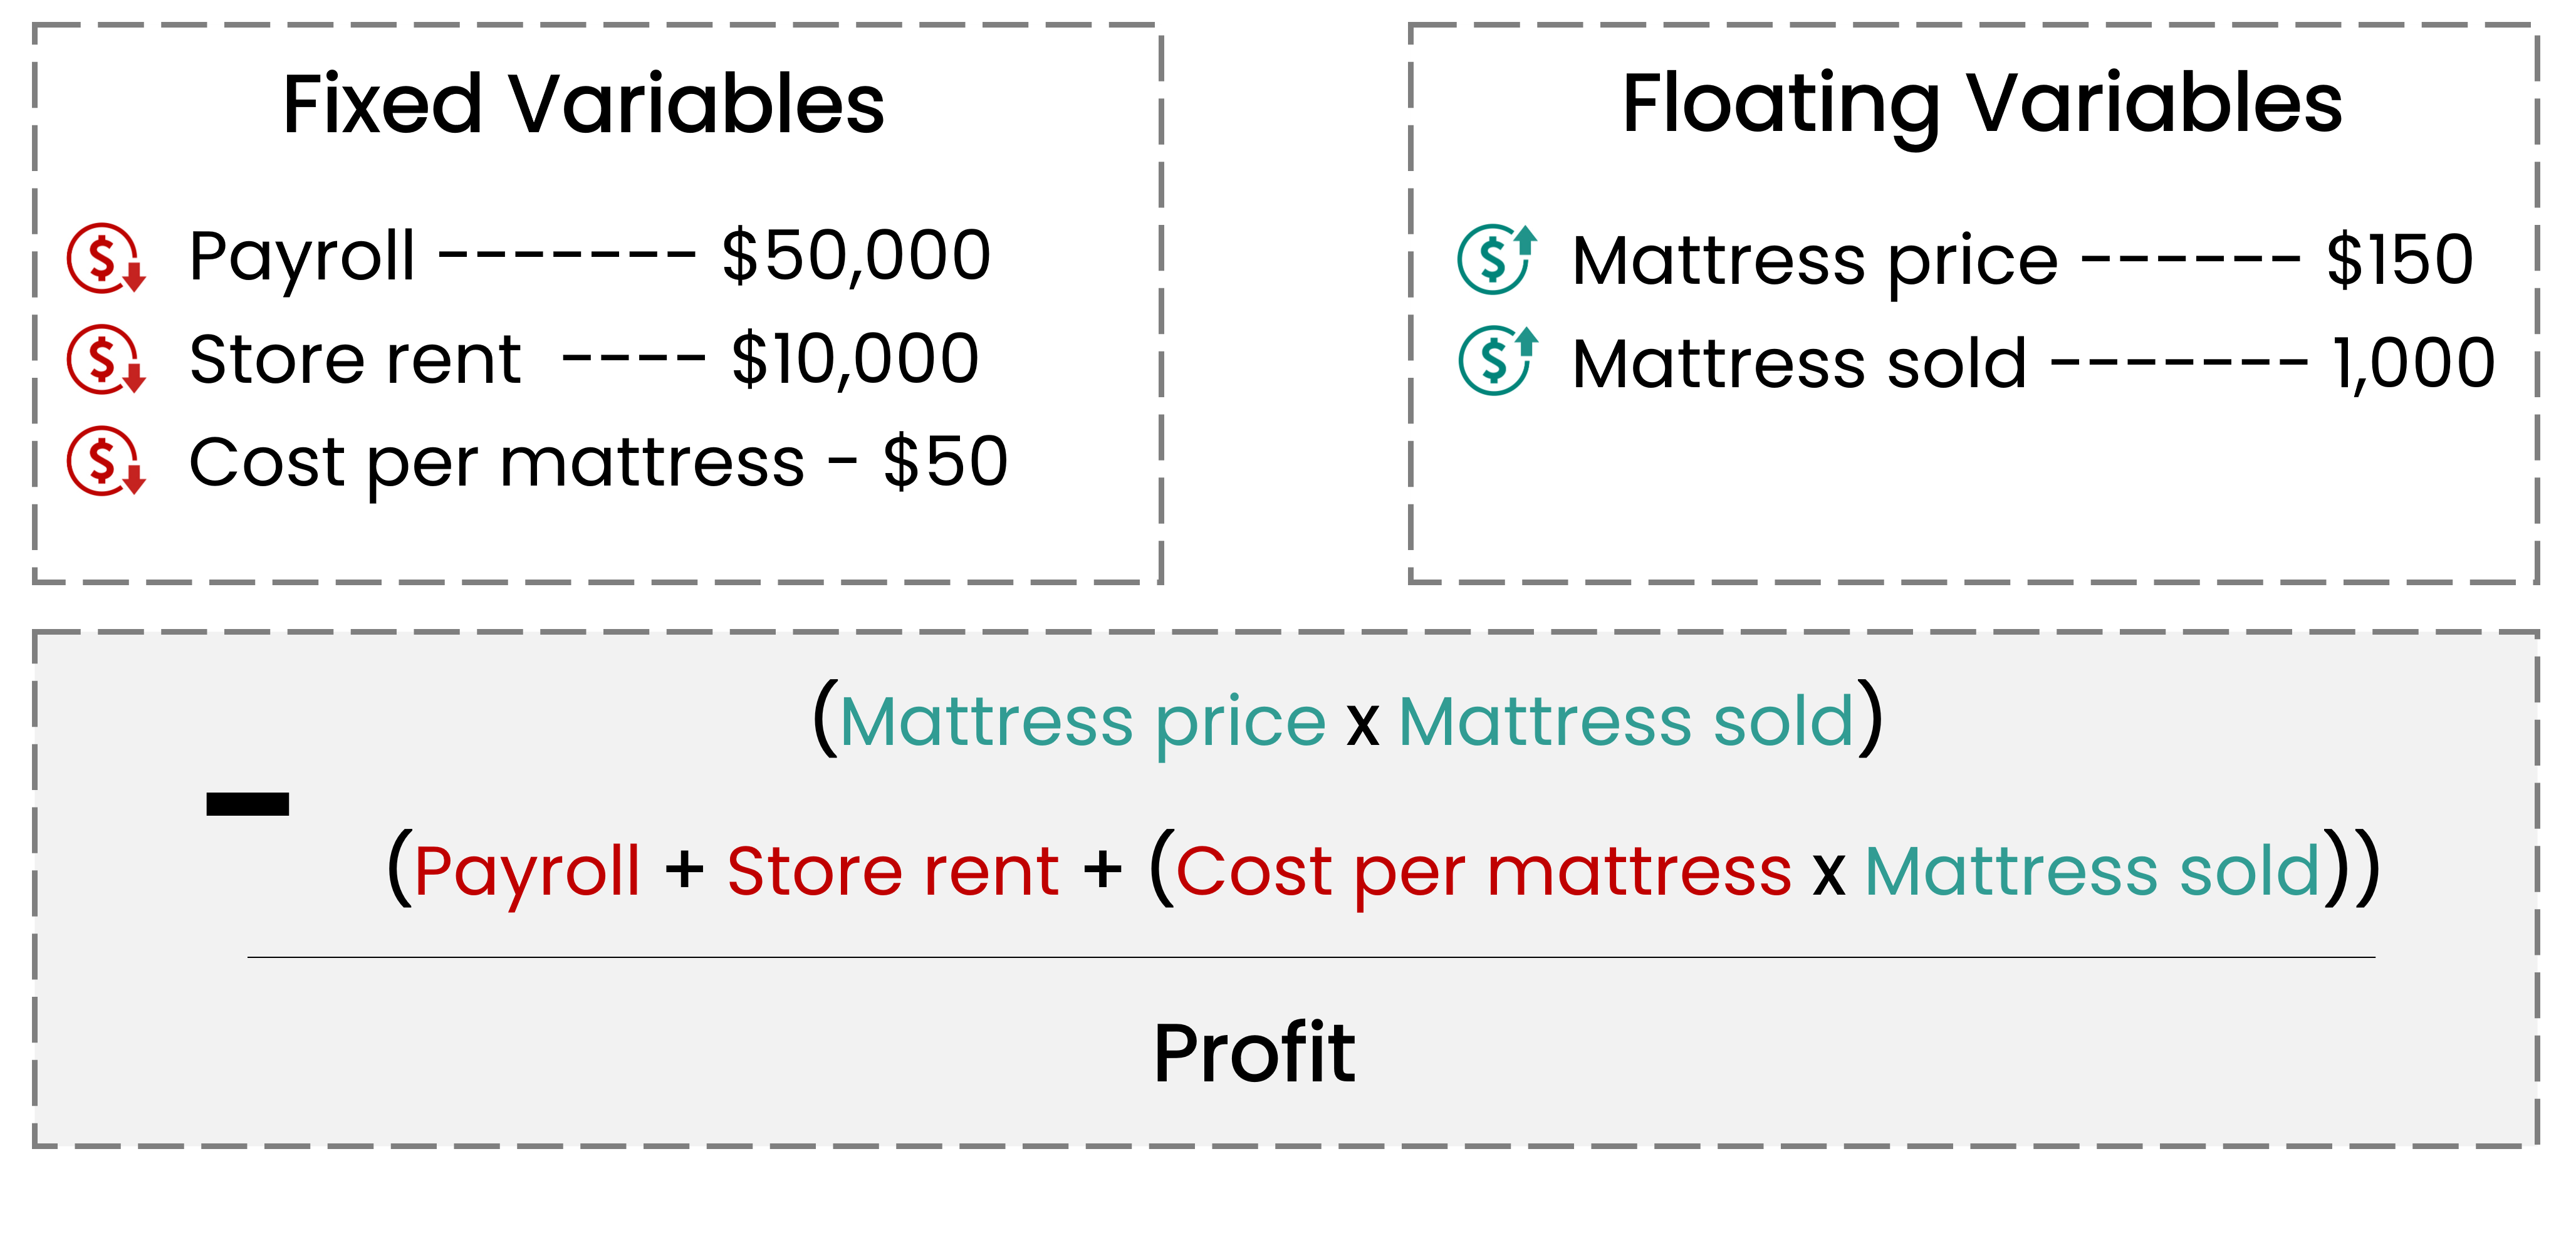
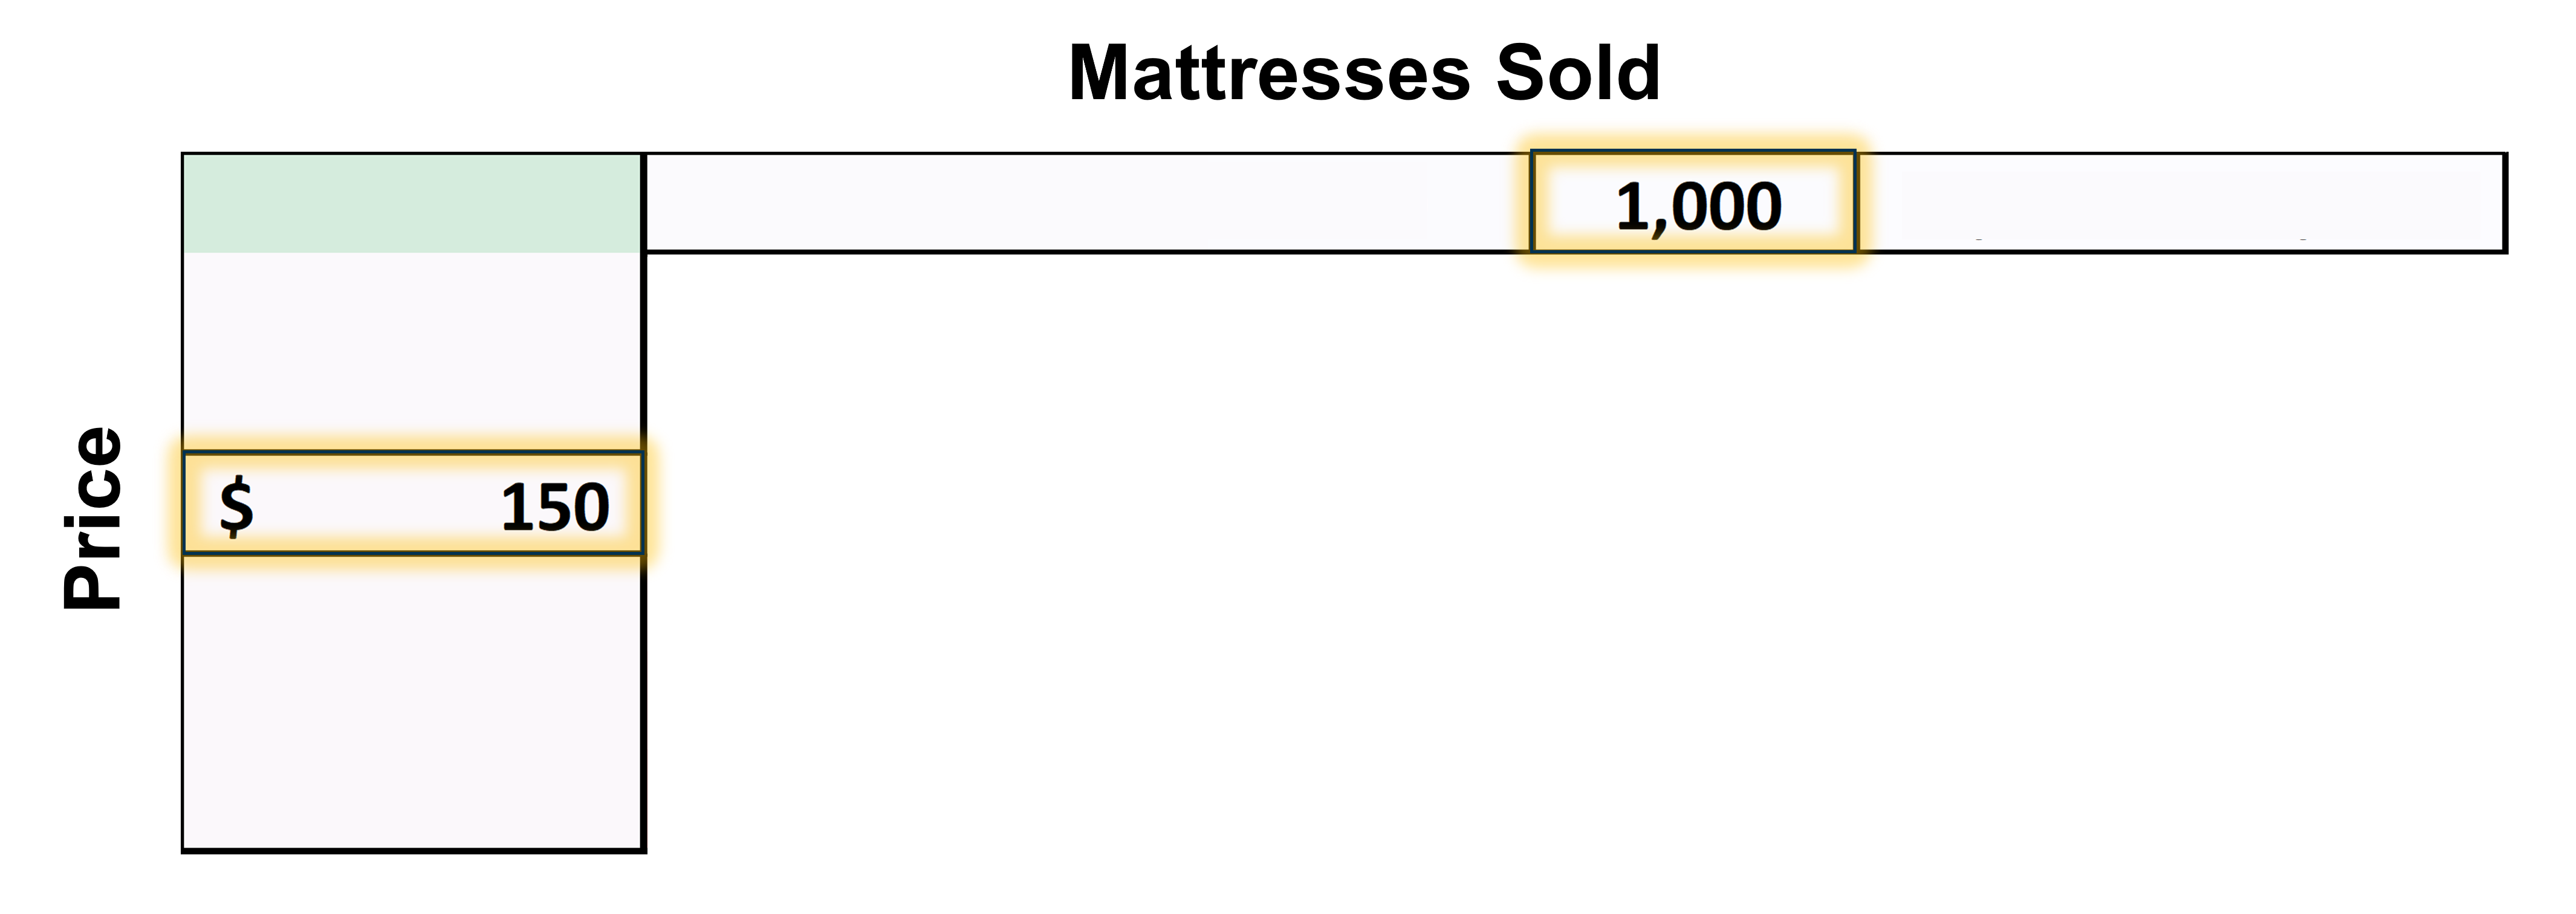
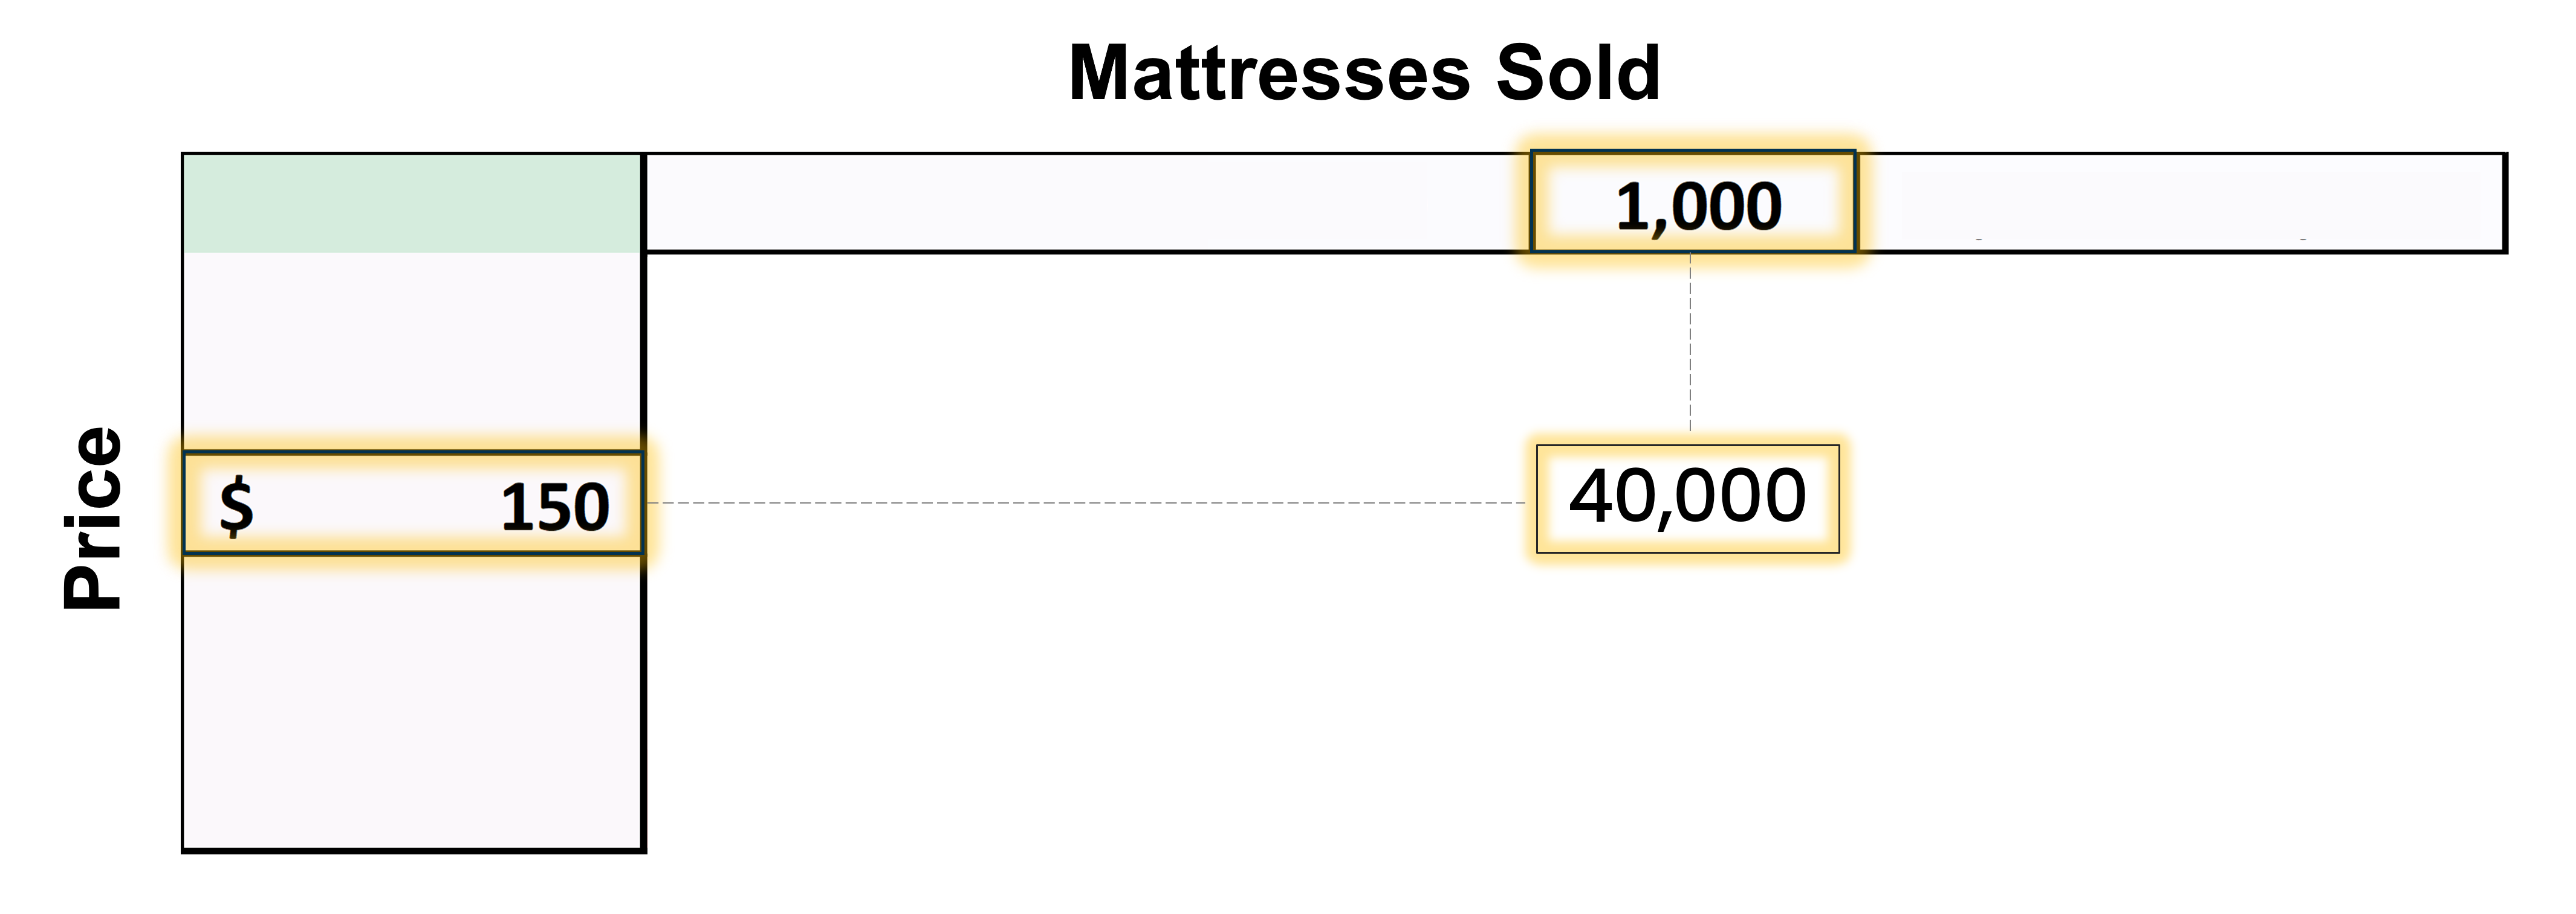
Calculating the impact of variables
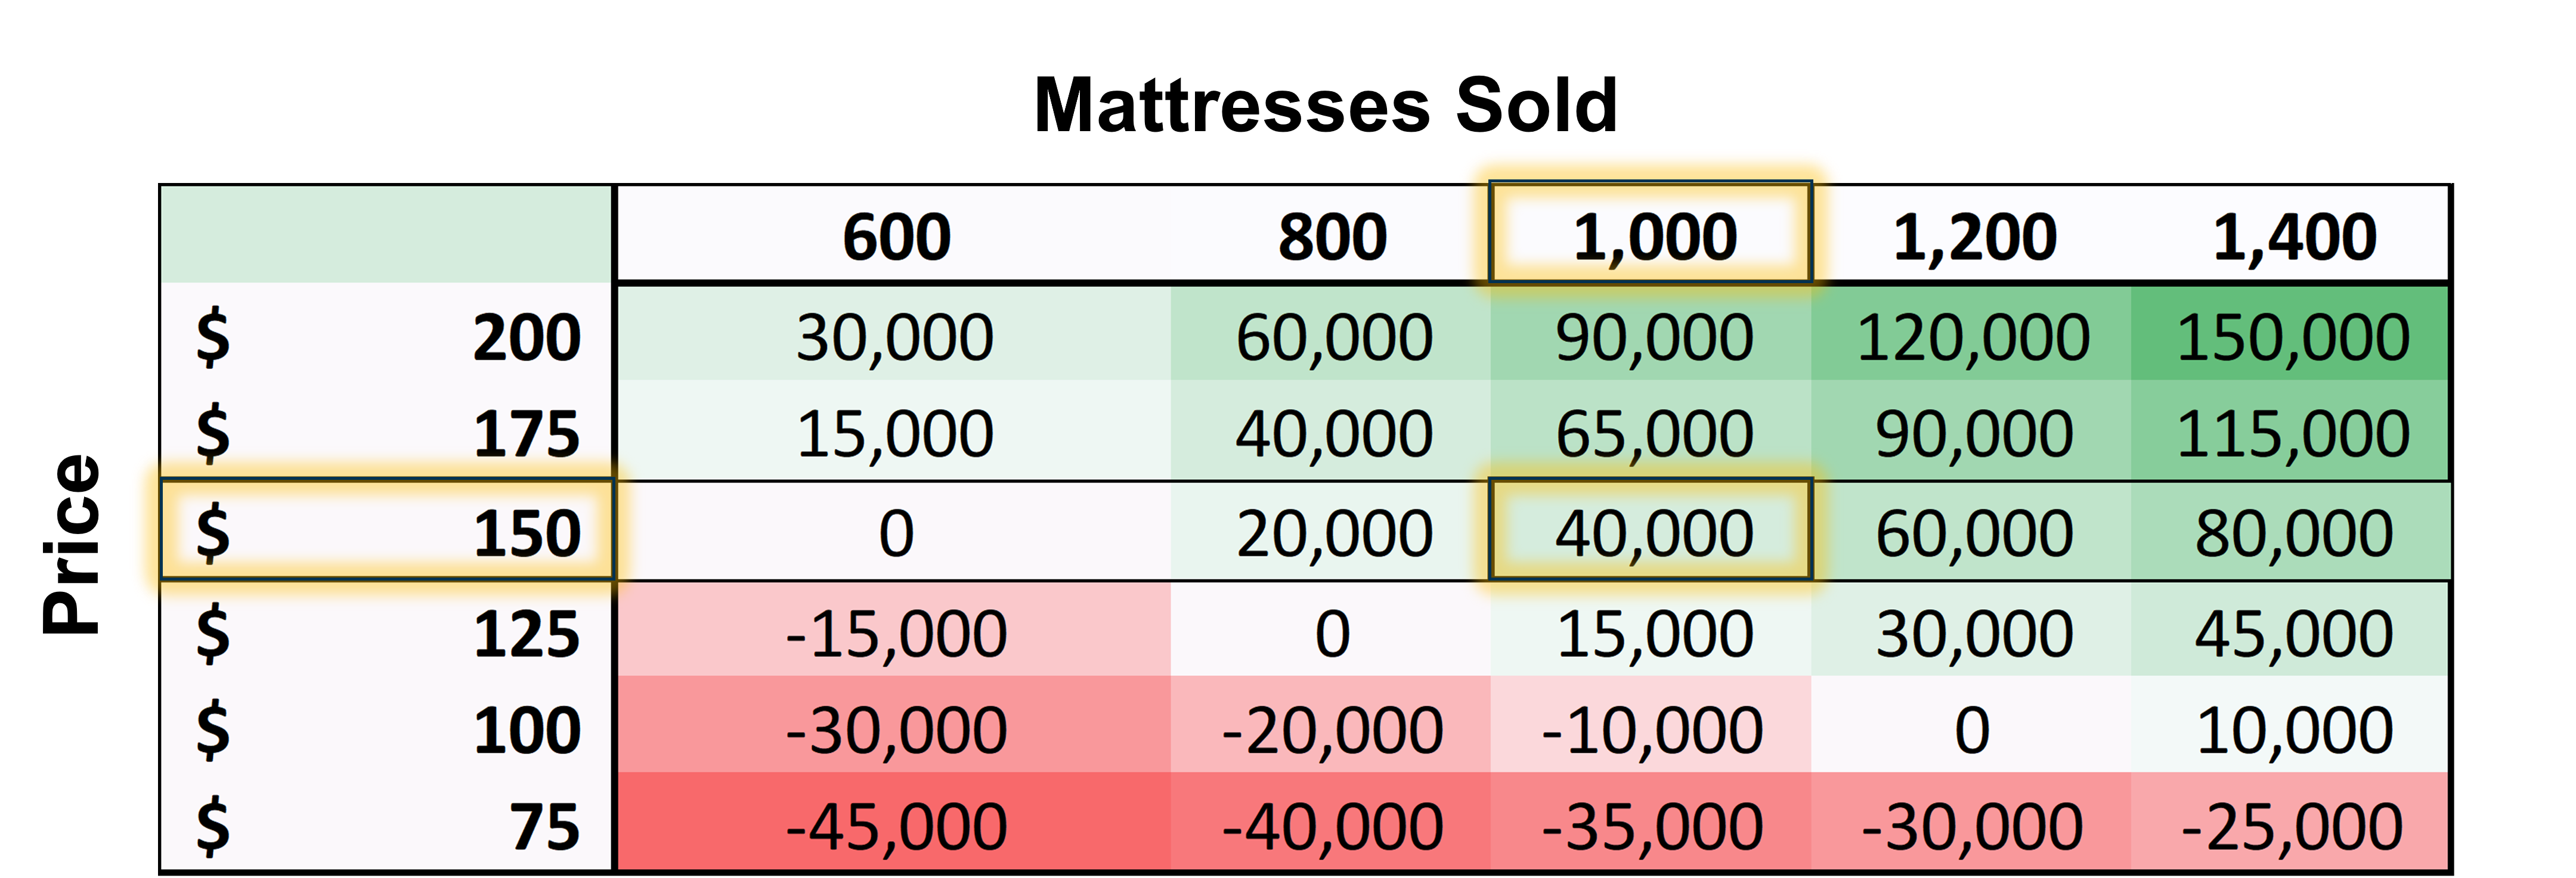
Generating conclusions and insights
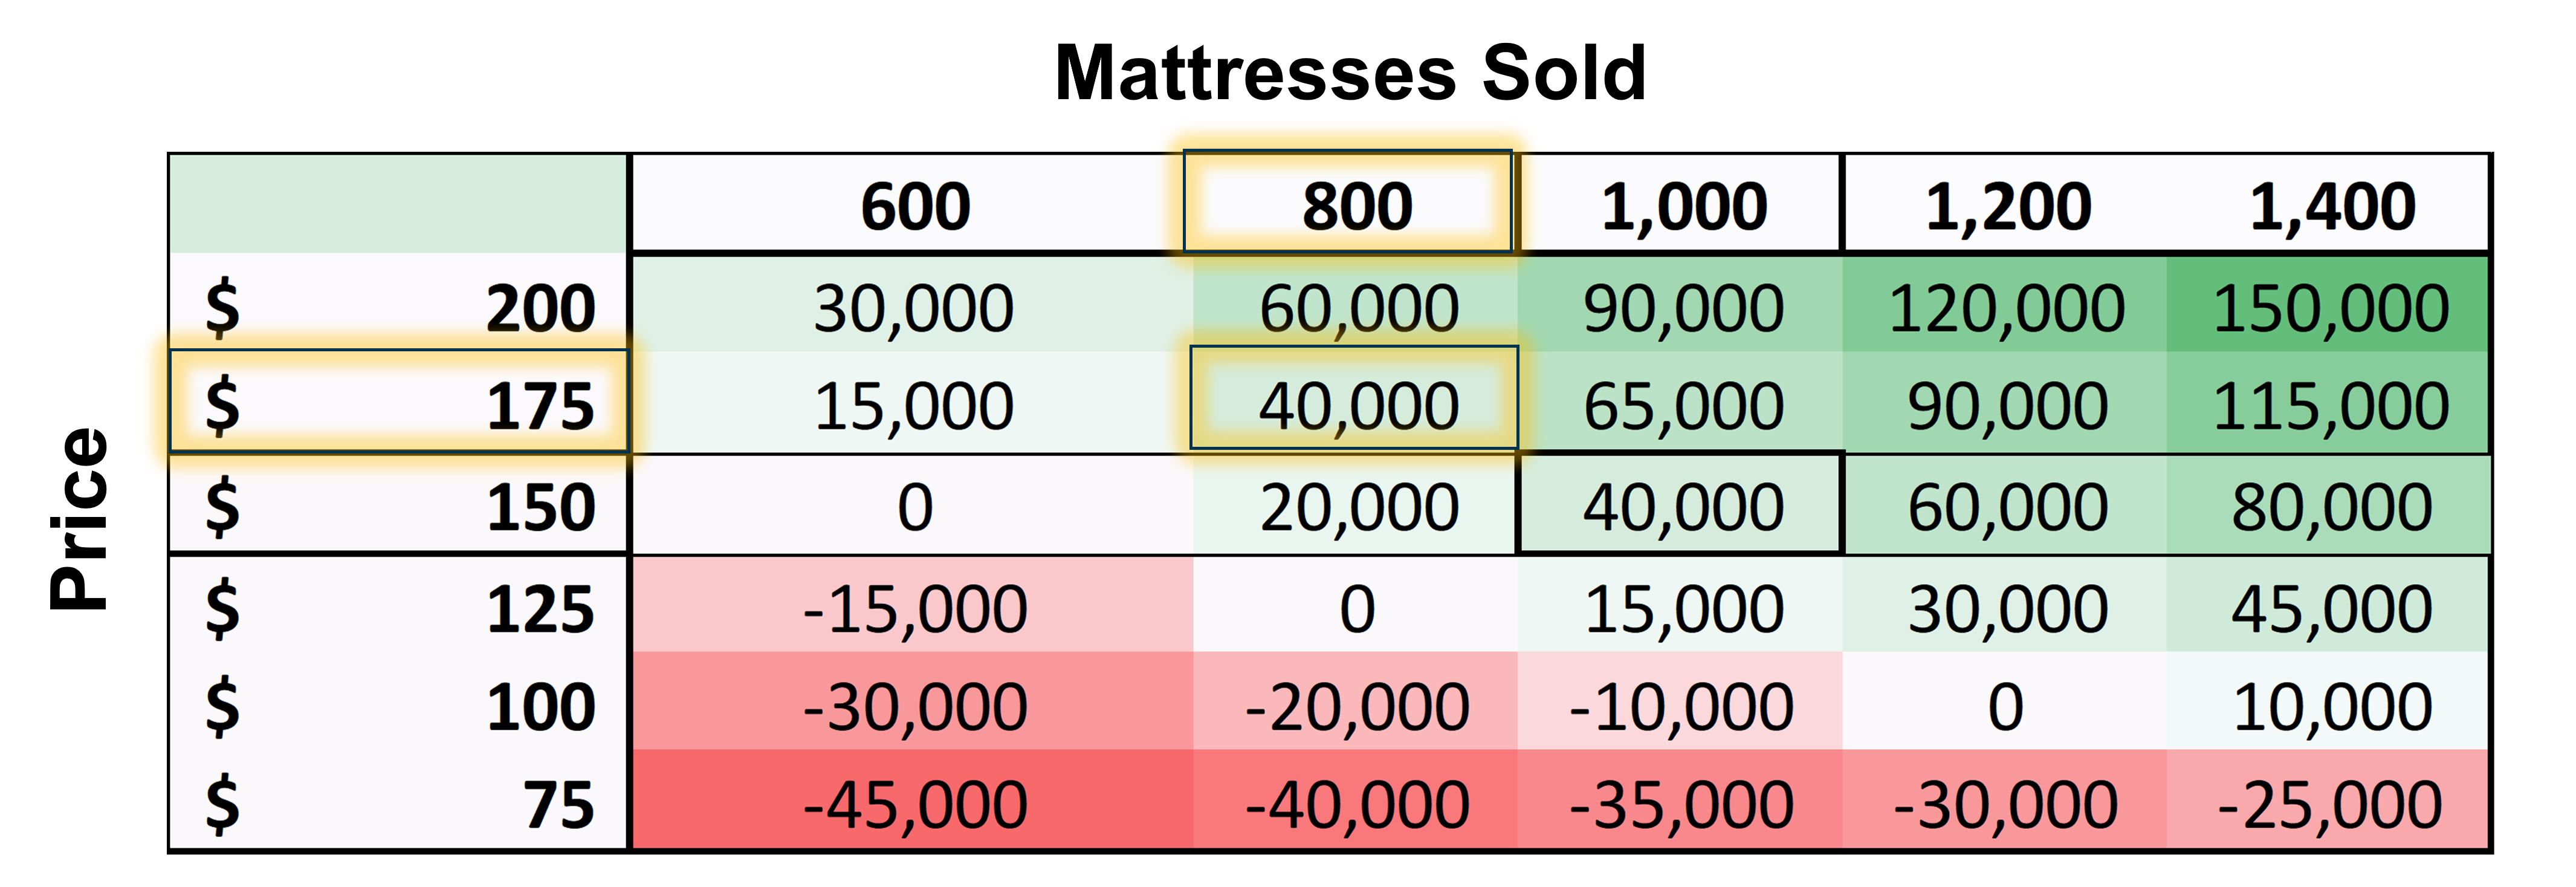

Generating conclusions and insights
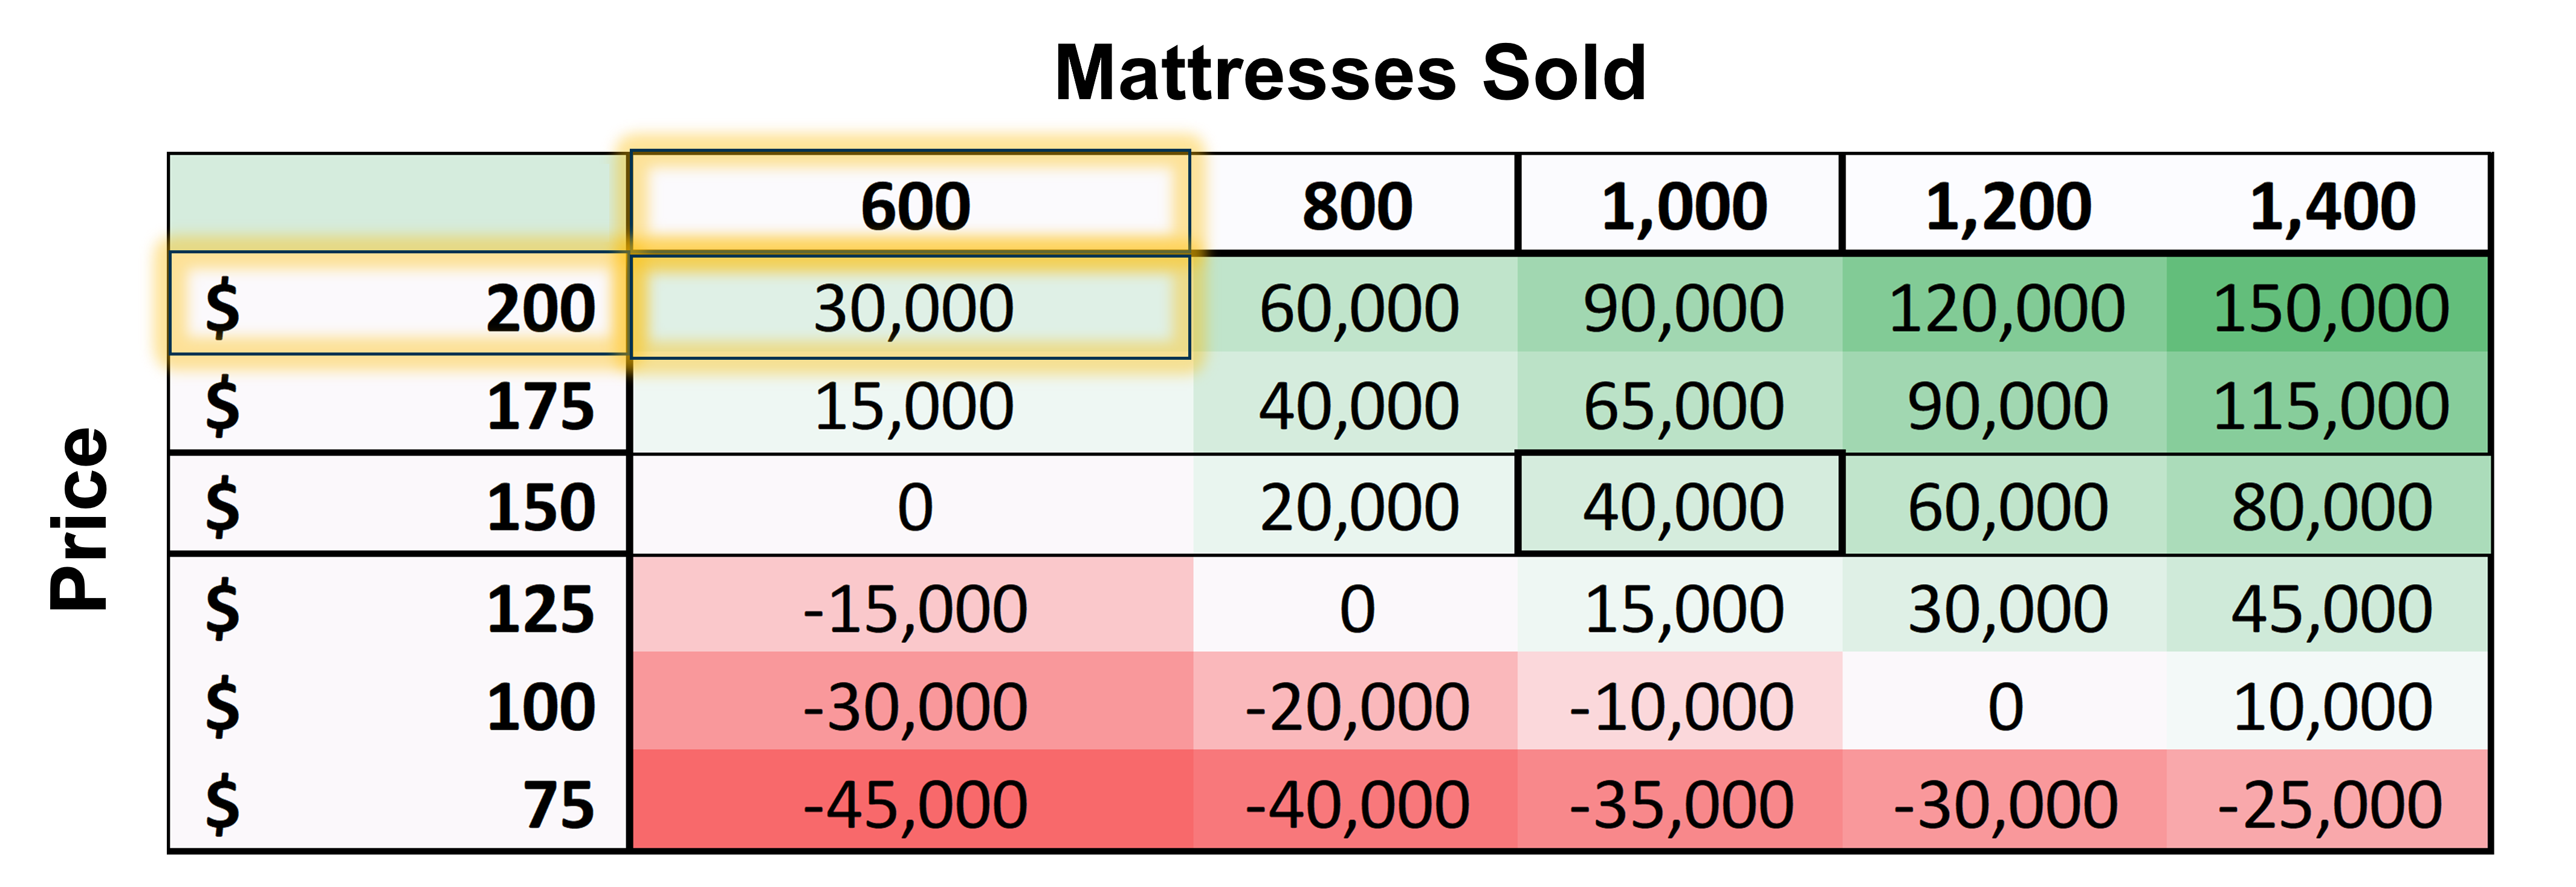

Generating conclusions and insights

Generating conclusions and insights