Probabilities in Decision Models
Decoding Decision Modeling

Tiago Brasil
Lead Data Engineer
Probabilistic Models
 Probabilistic Models support decision-making by providing a structured approach to handle uncertainties.
By applying probabilities in decision models we can:
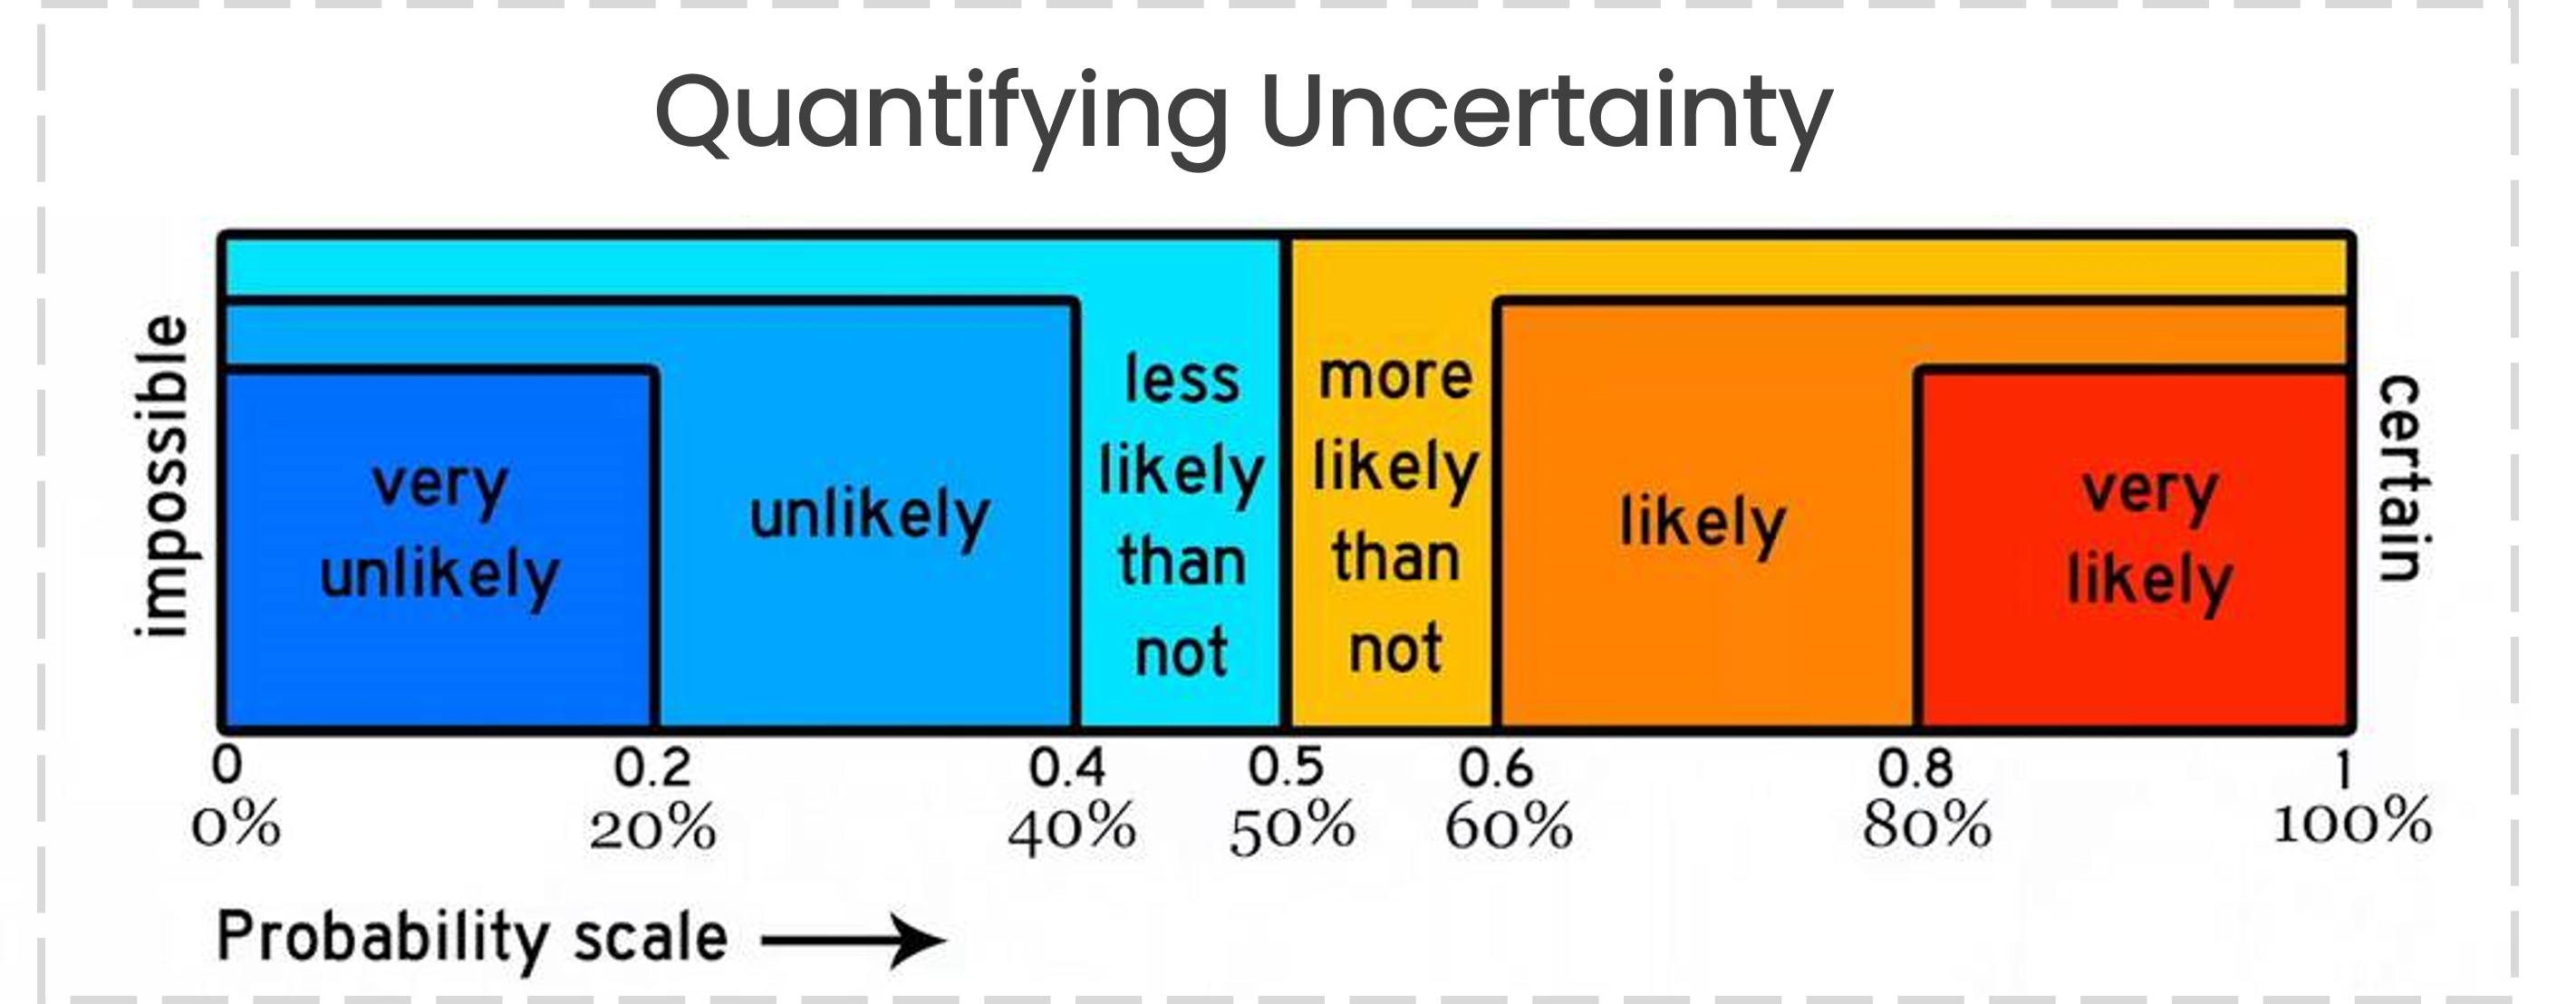
- Quantify uncertainties by assigning values between 0 and 1 to express the likelihood of outcomes

Probabilities and uncertainties
Probabilities allow decision-makers to quantify uncertainties by assigning numerical values to the likelihood of different outcomes occurring.

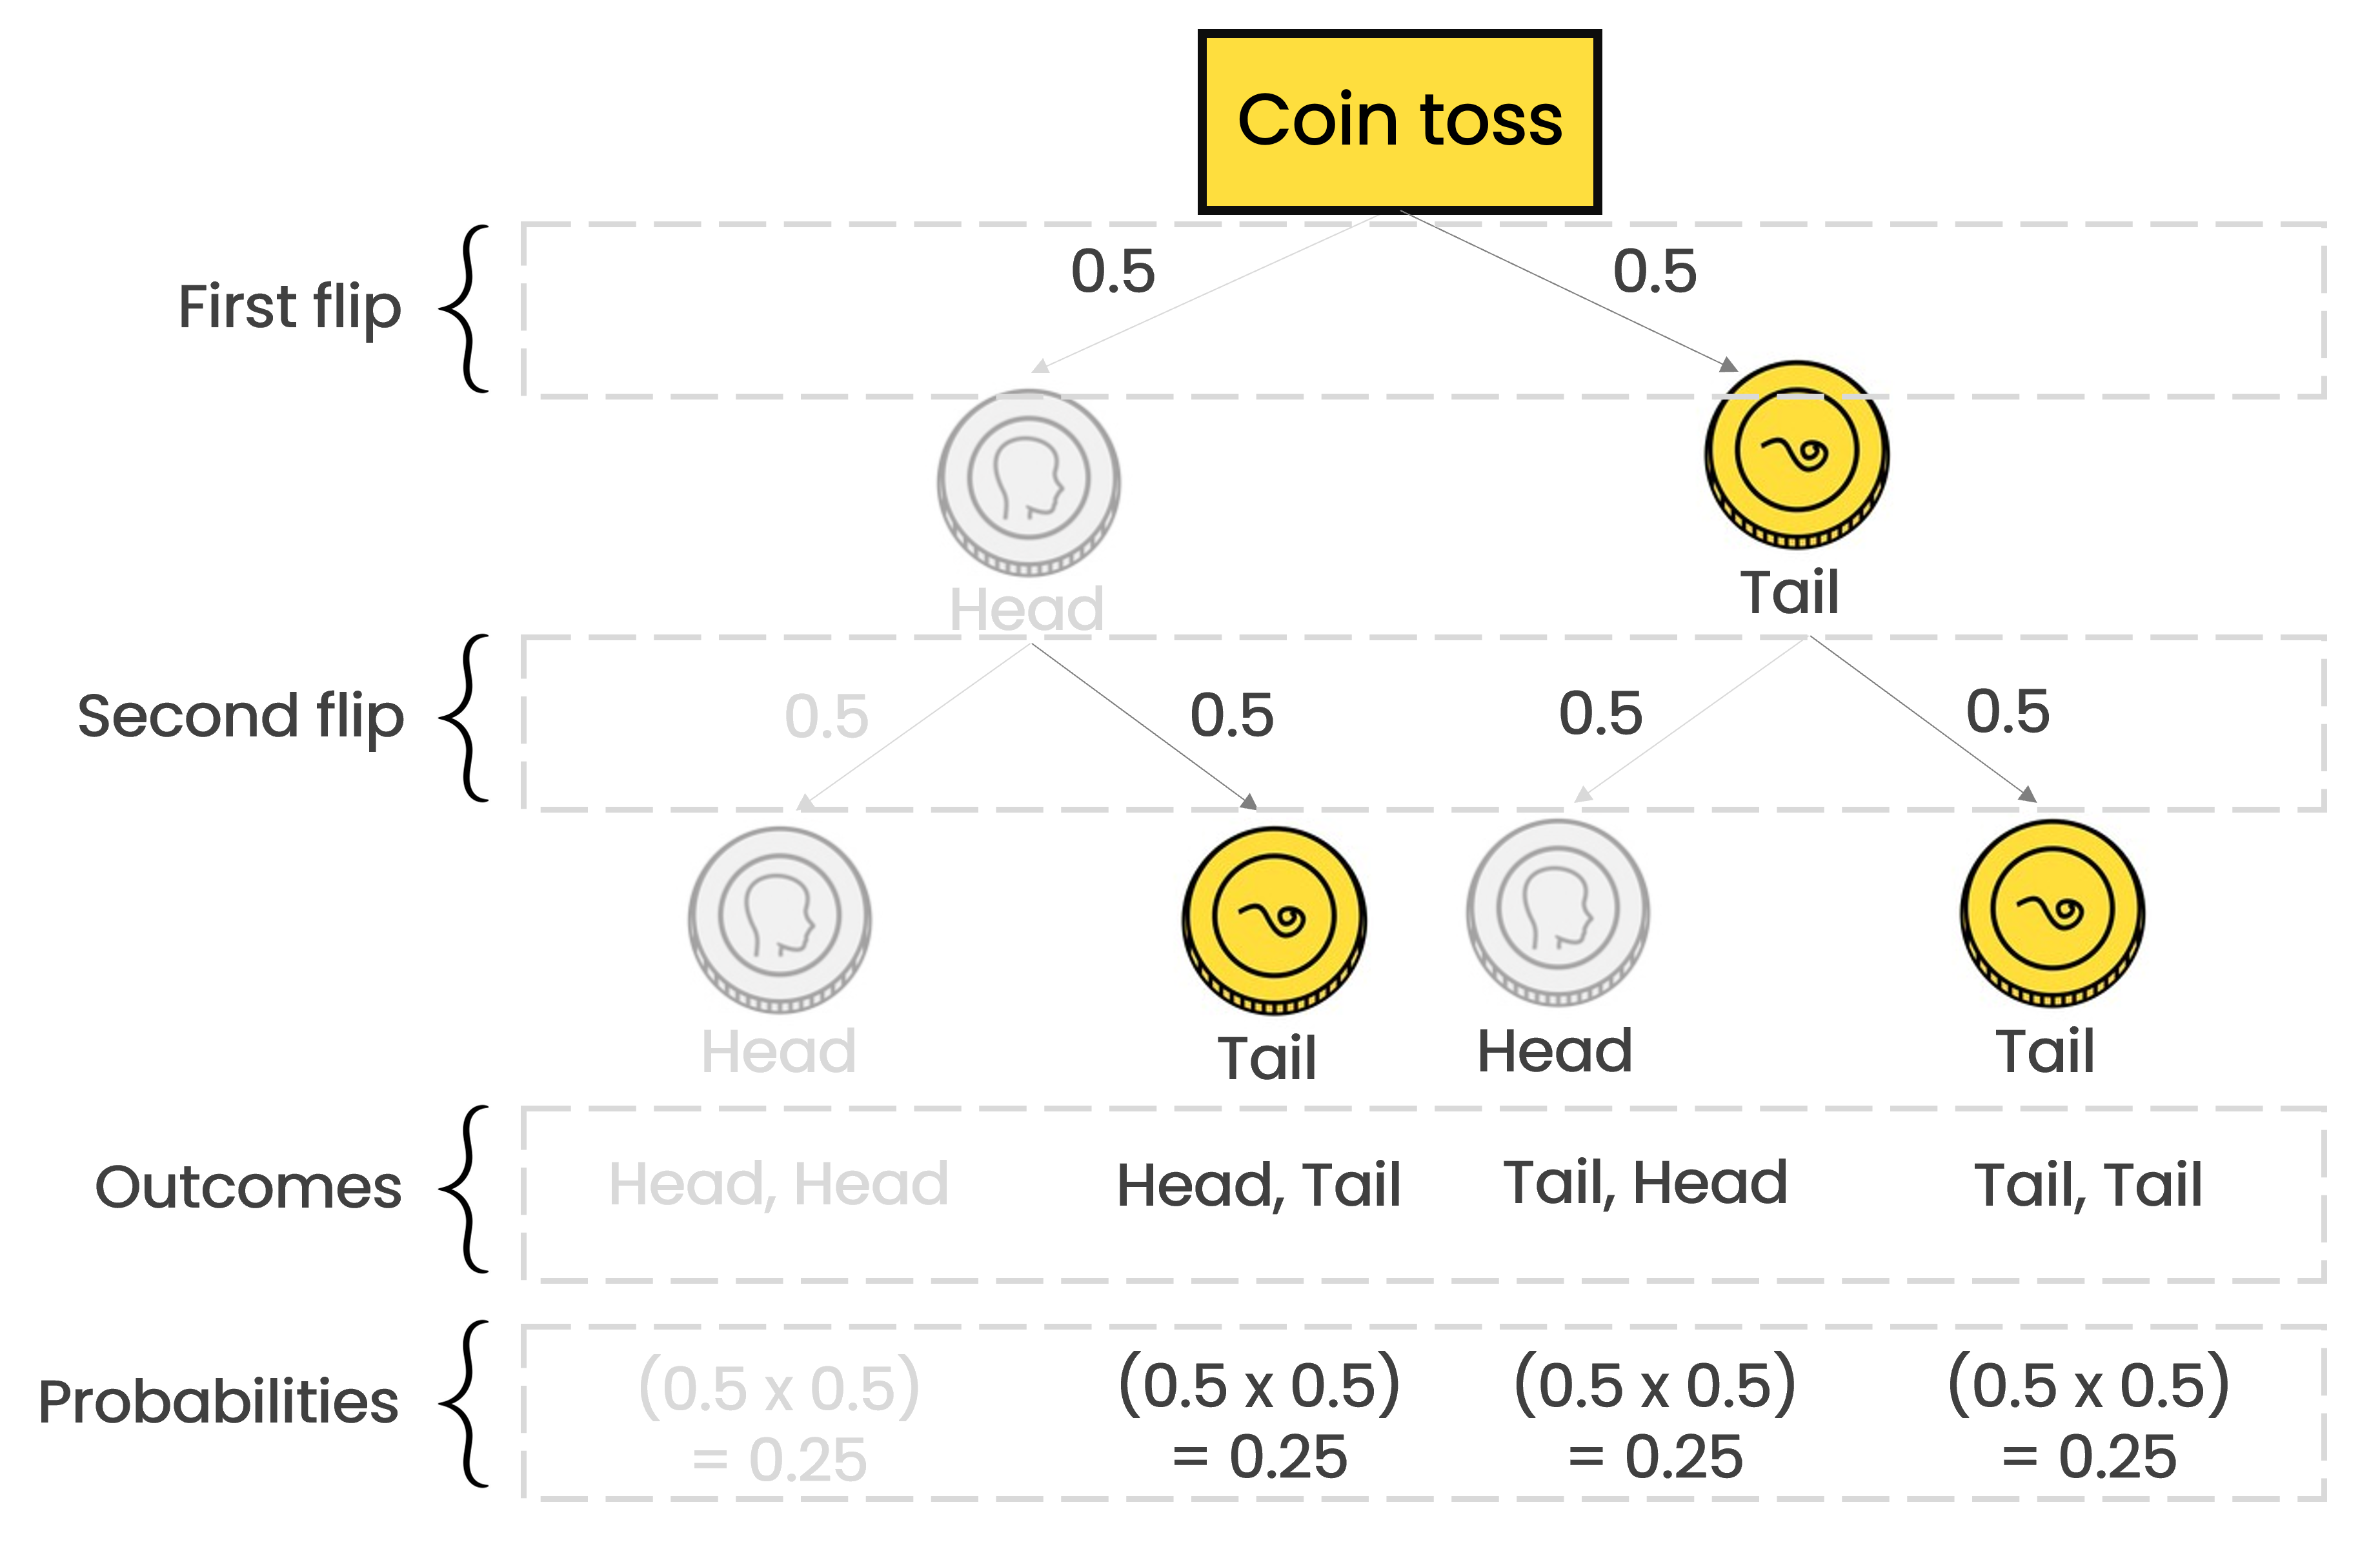
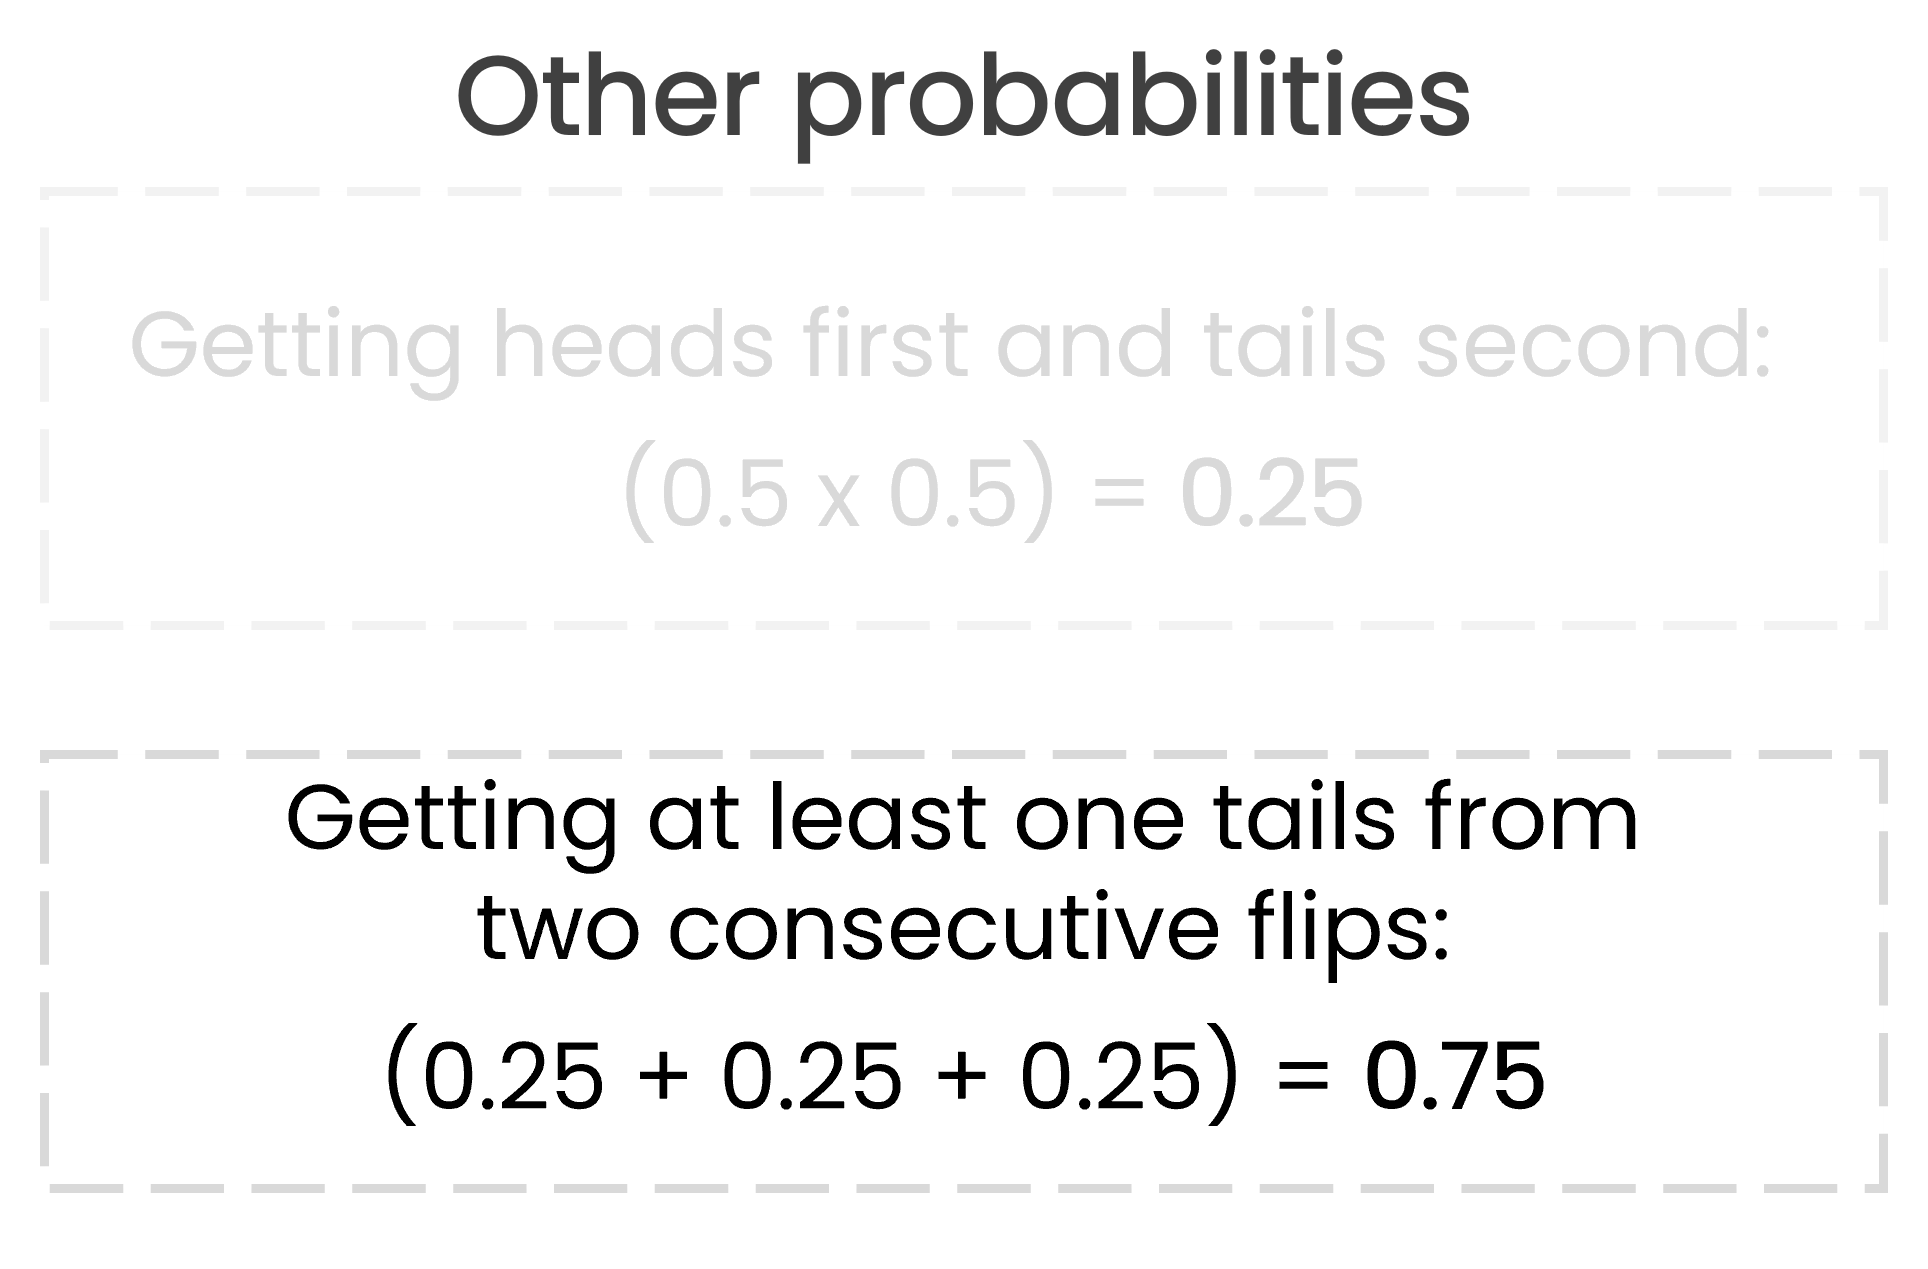
Probabilities in a coin toss
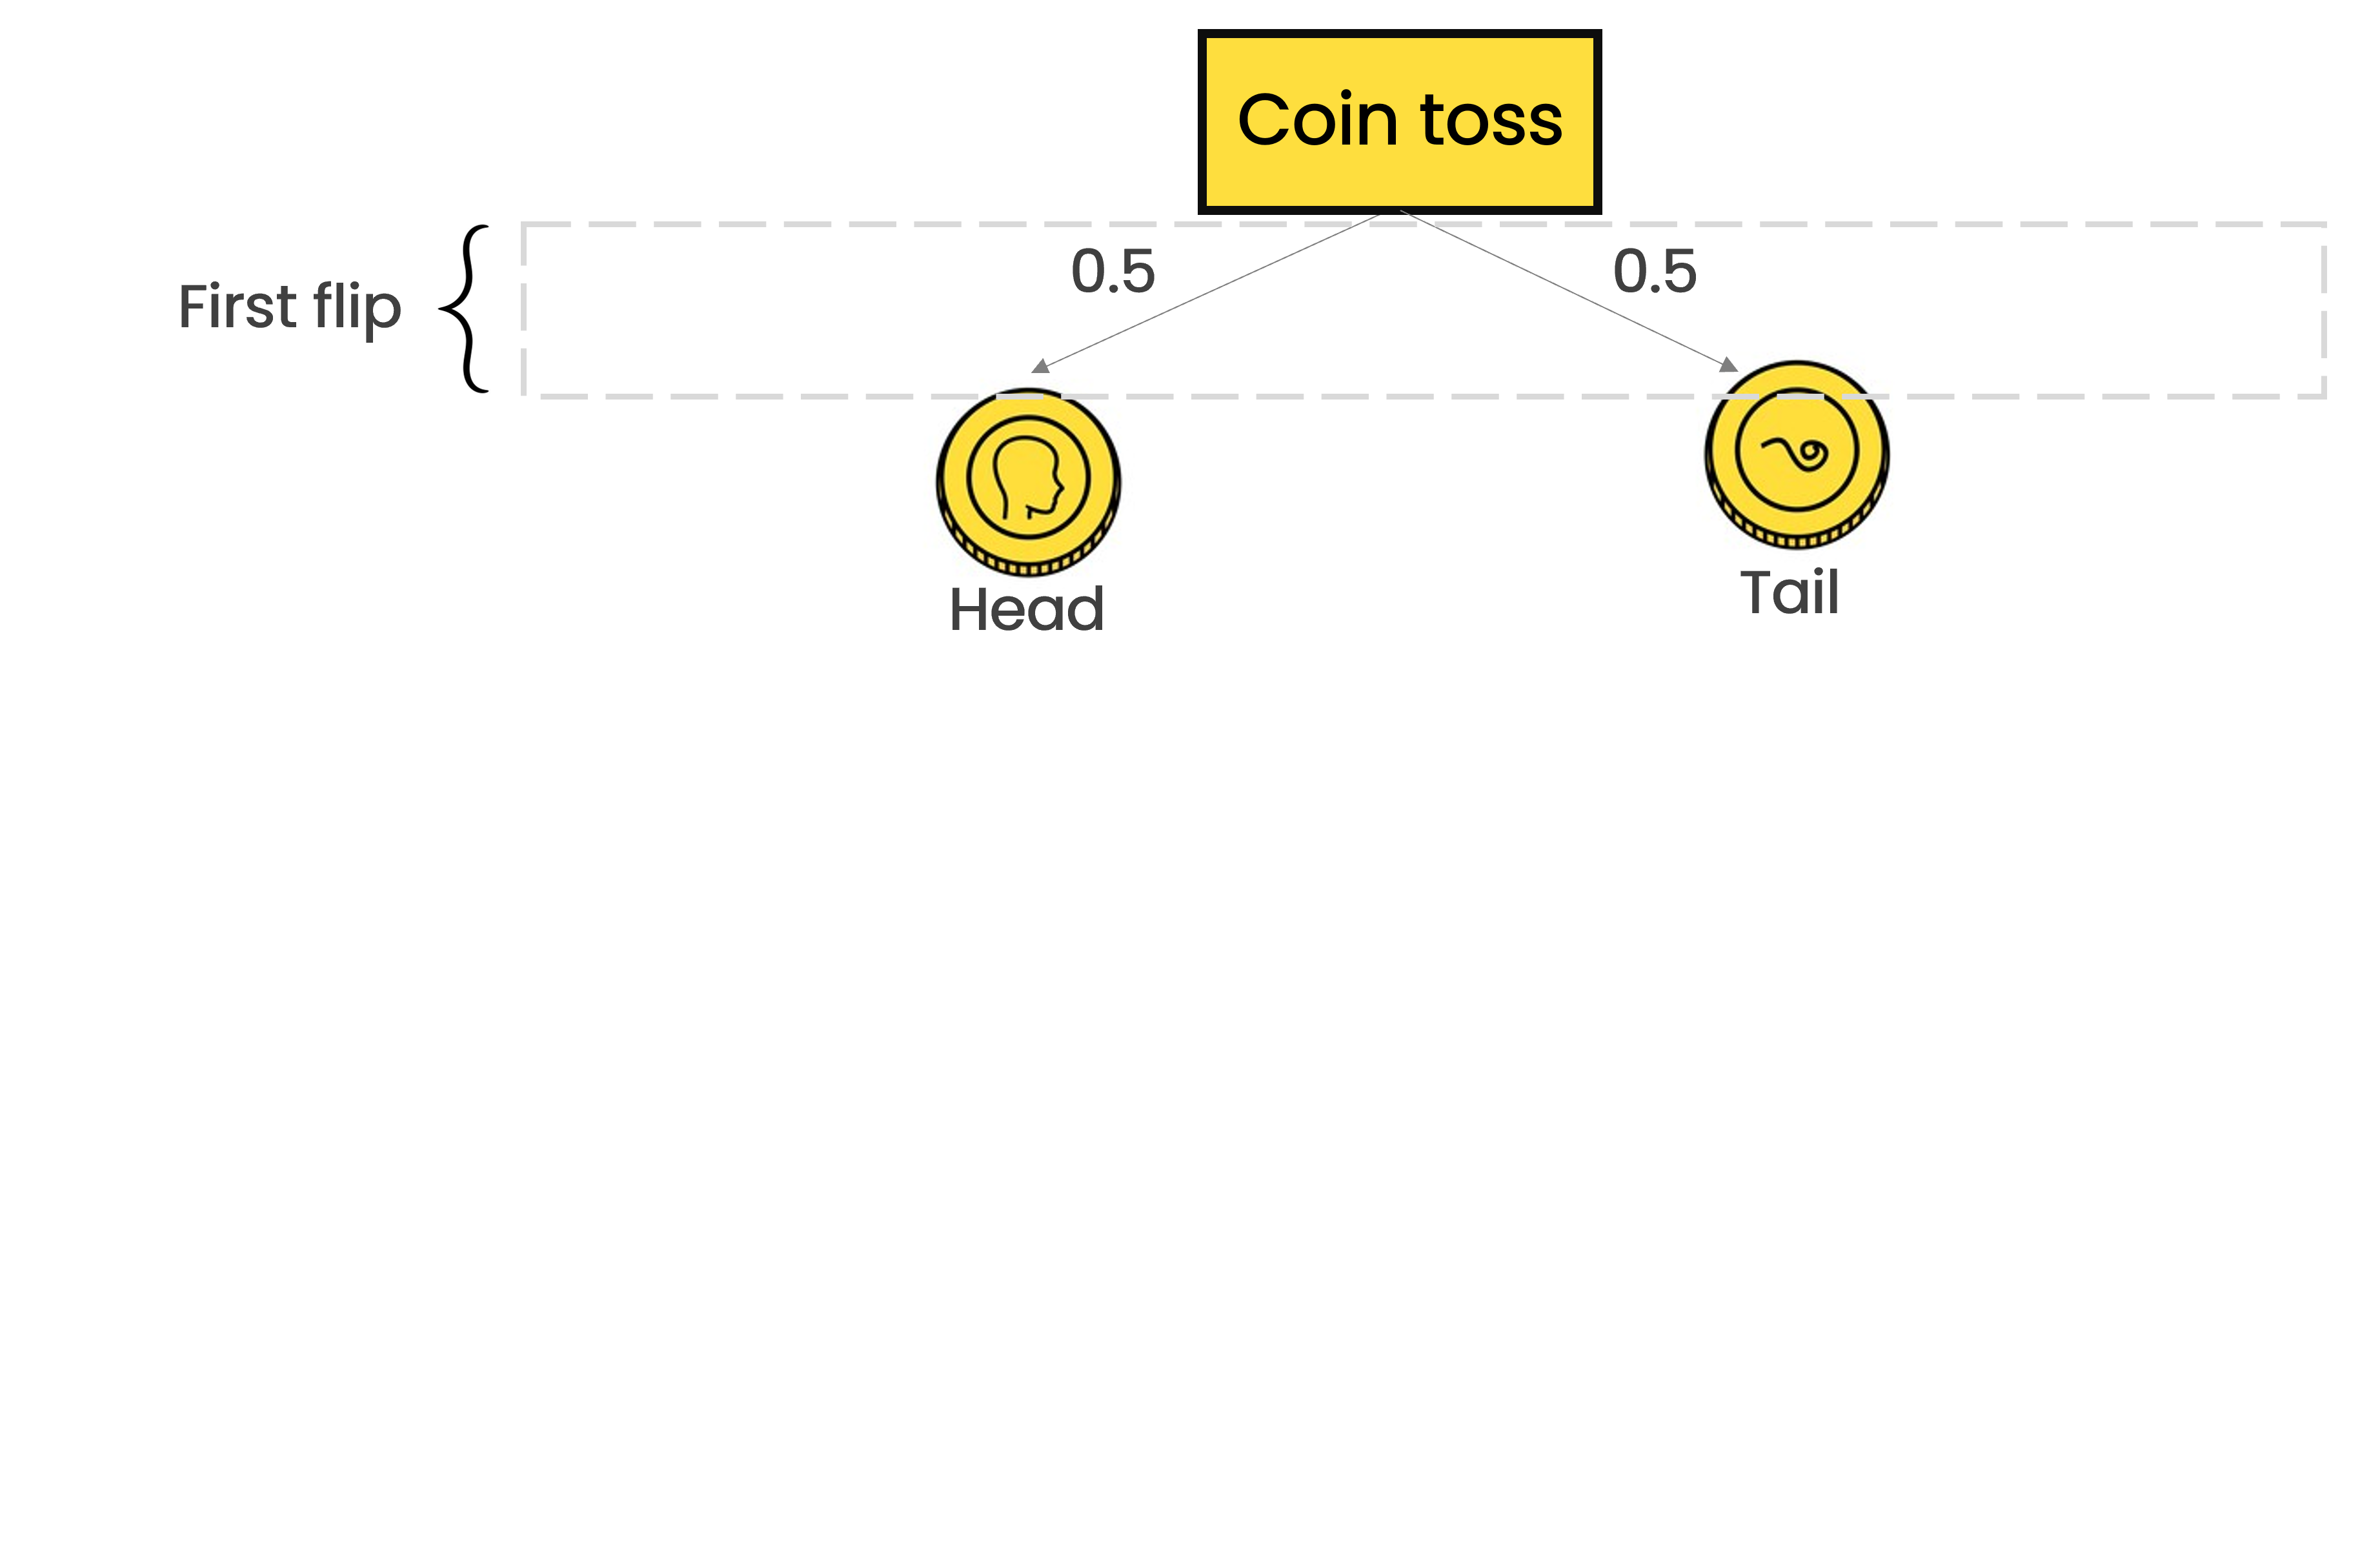
Probabilities in a coin toss
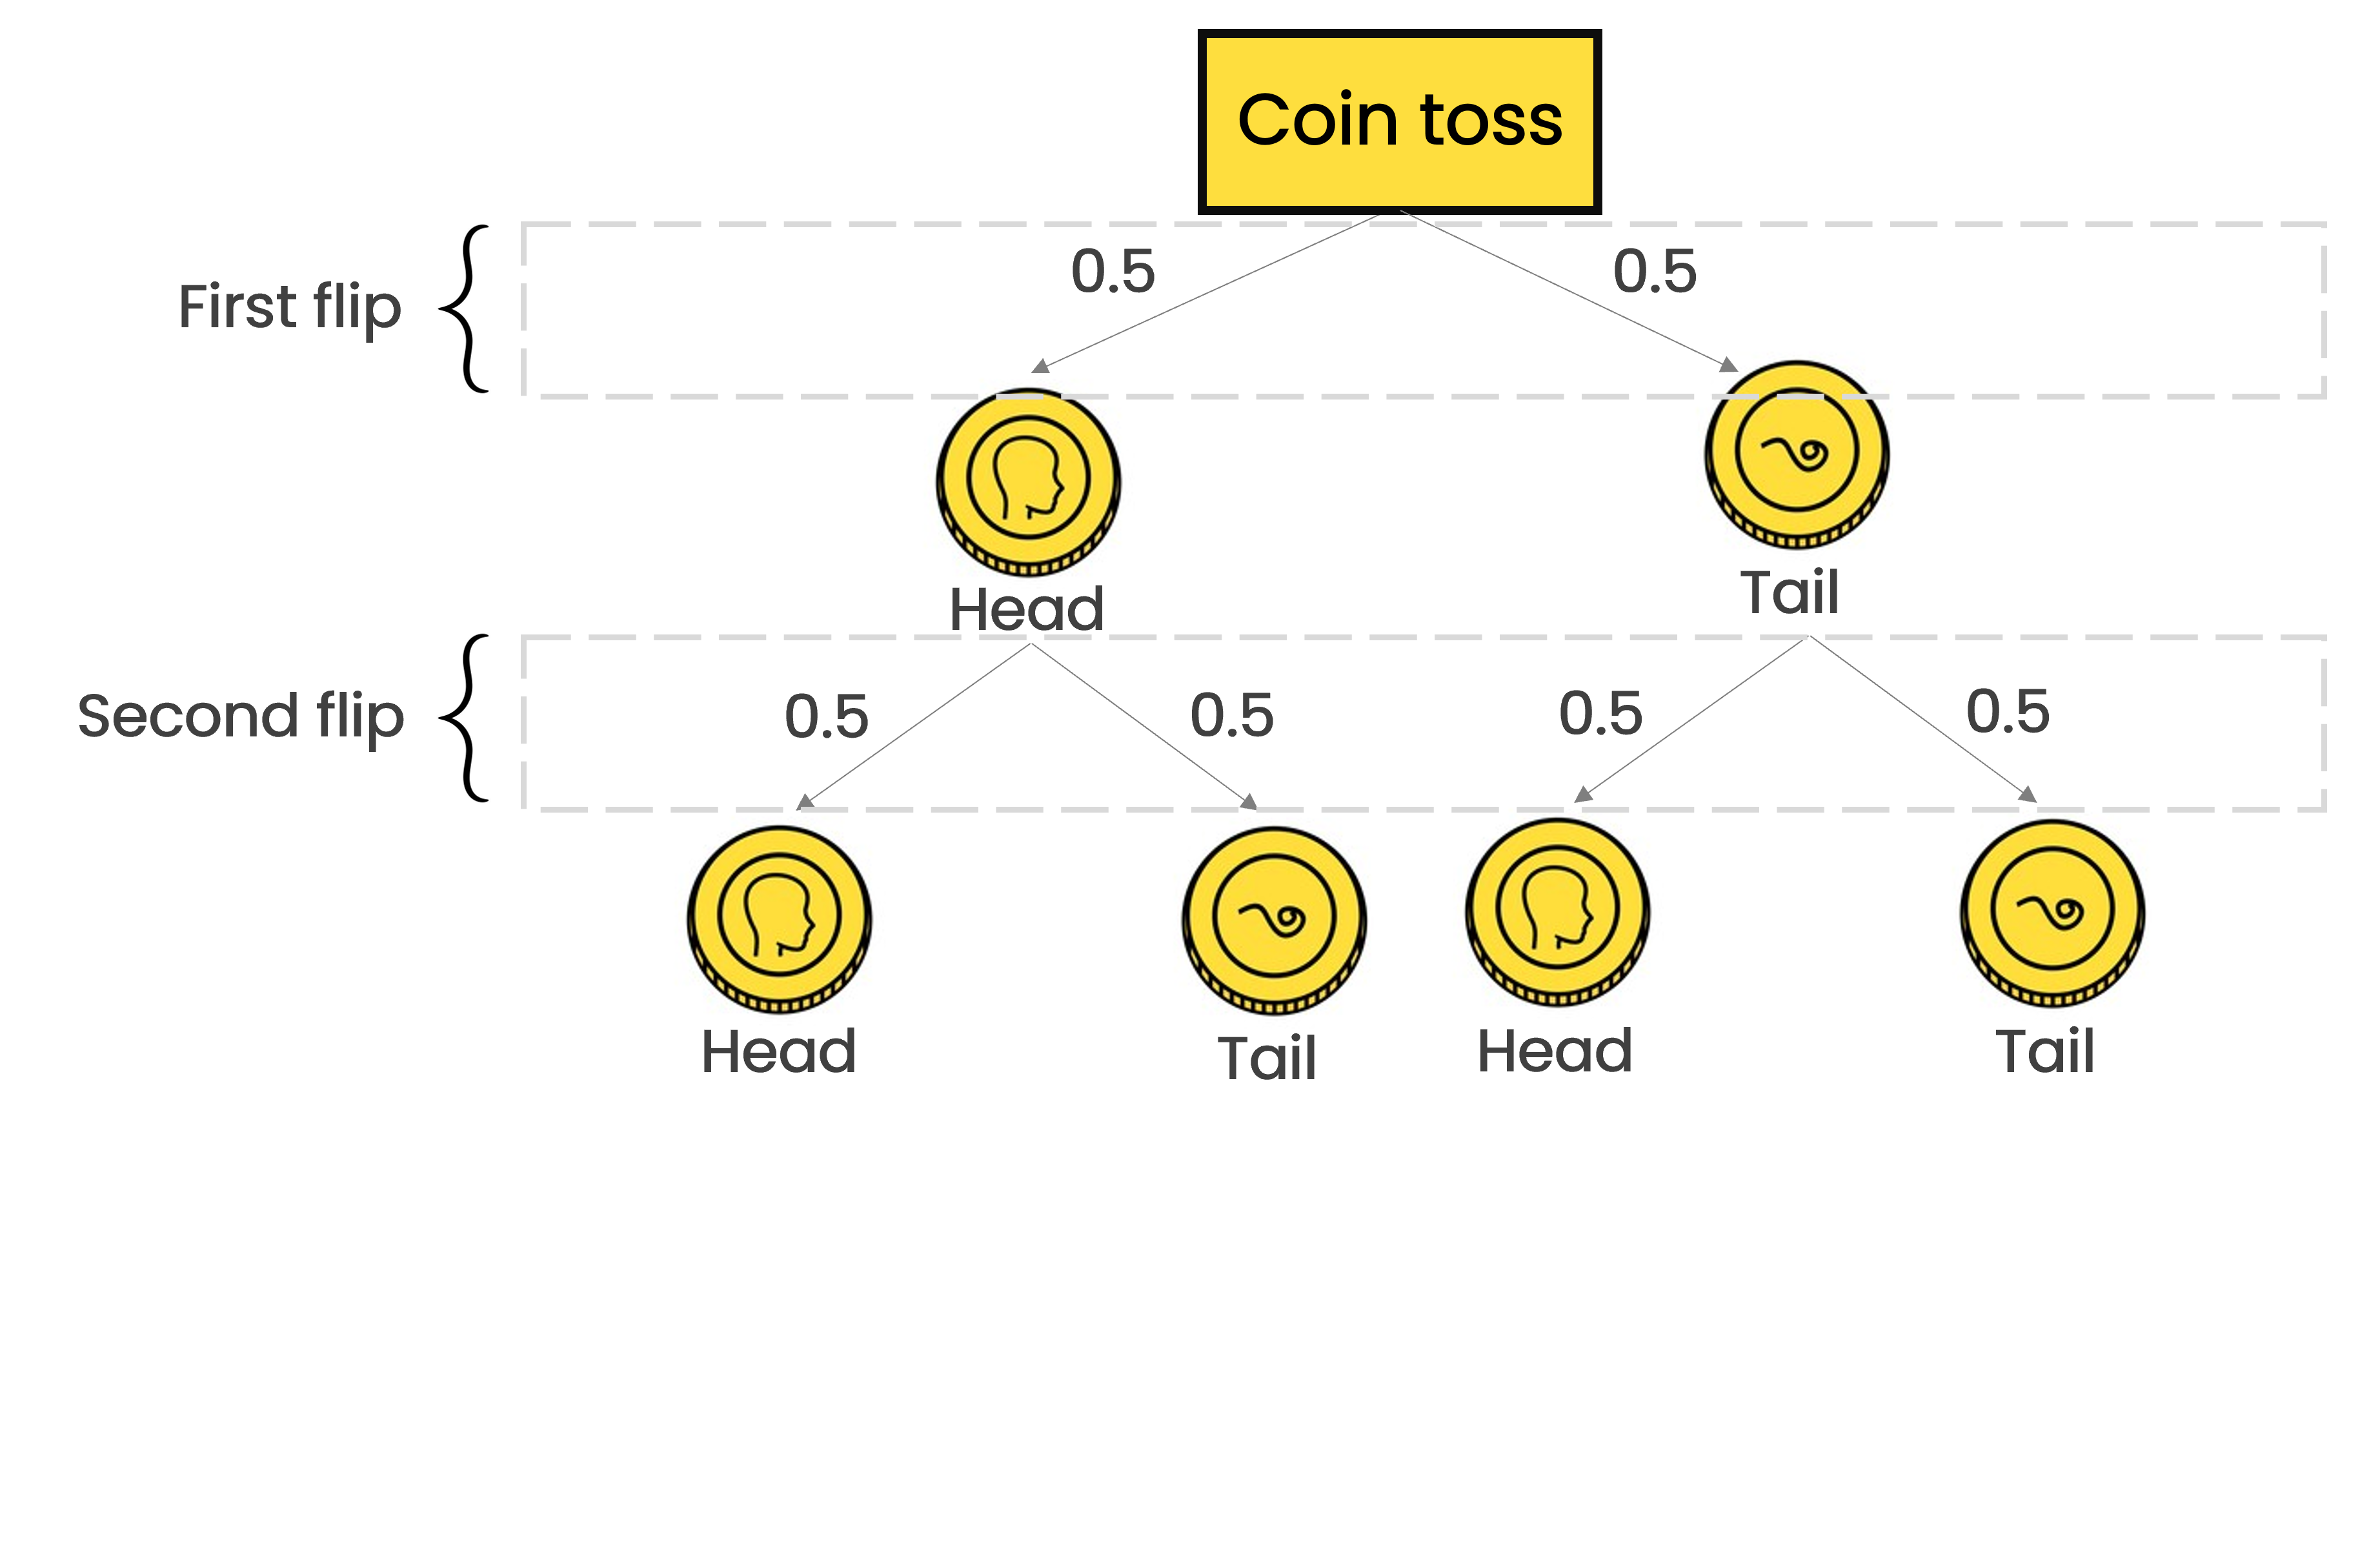
Probabilities in a coin toss
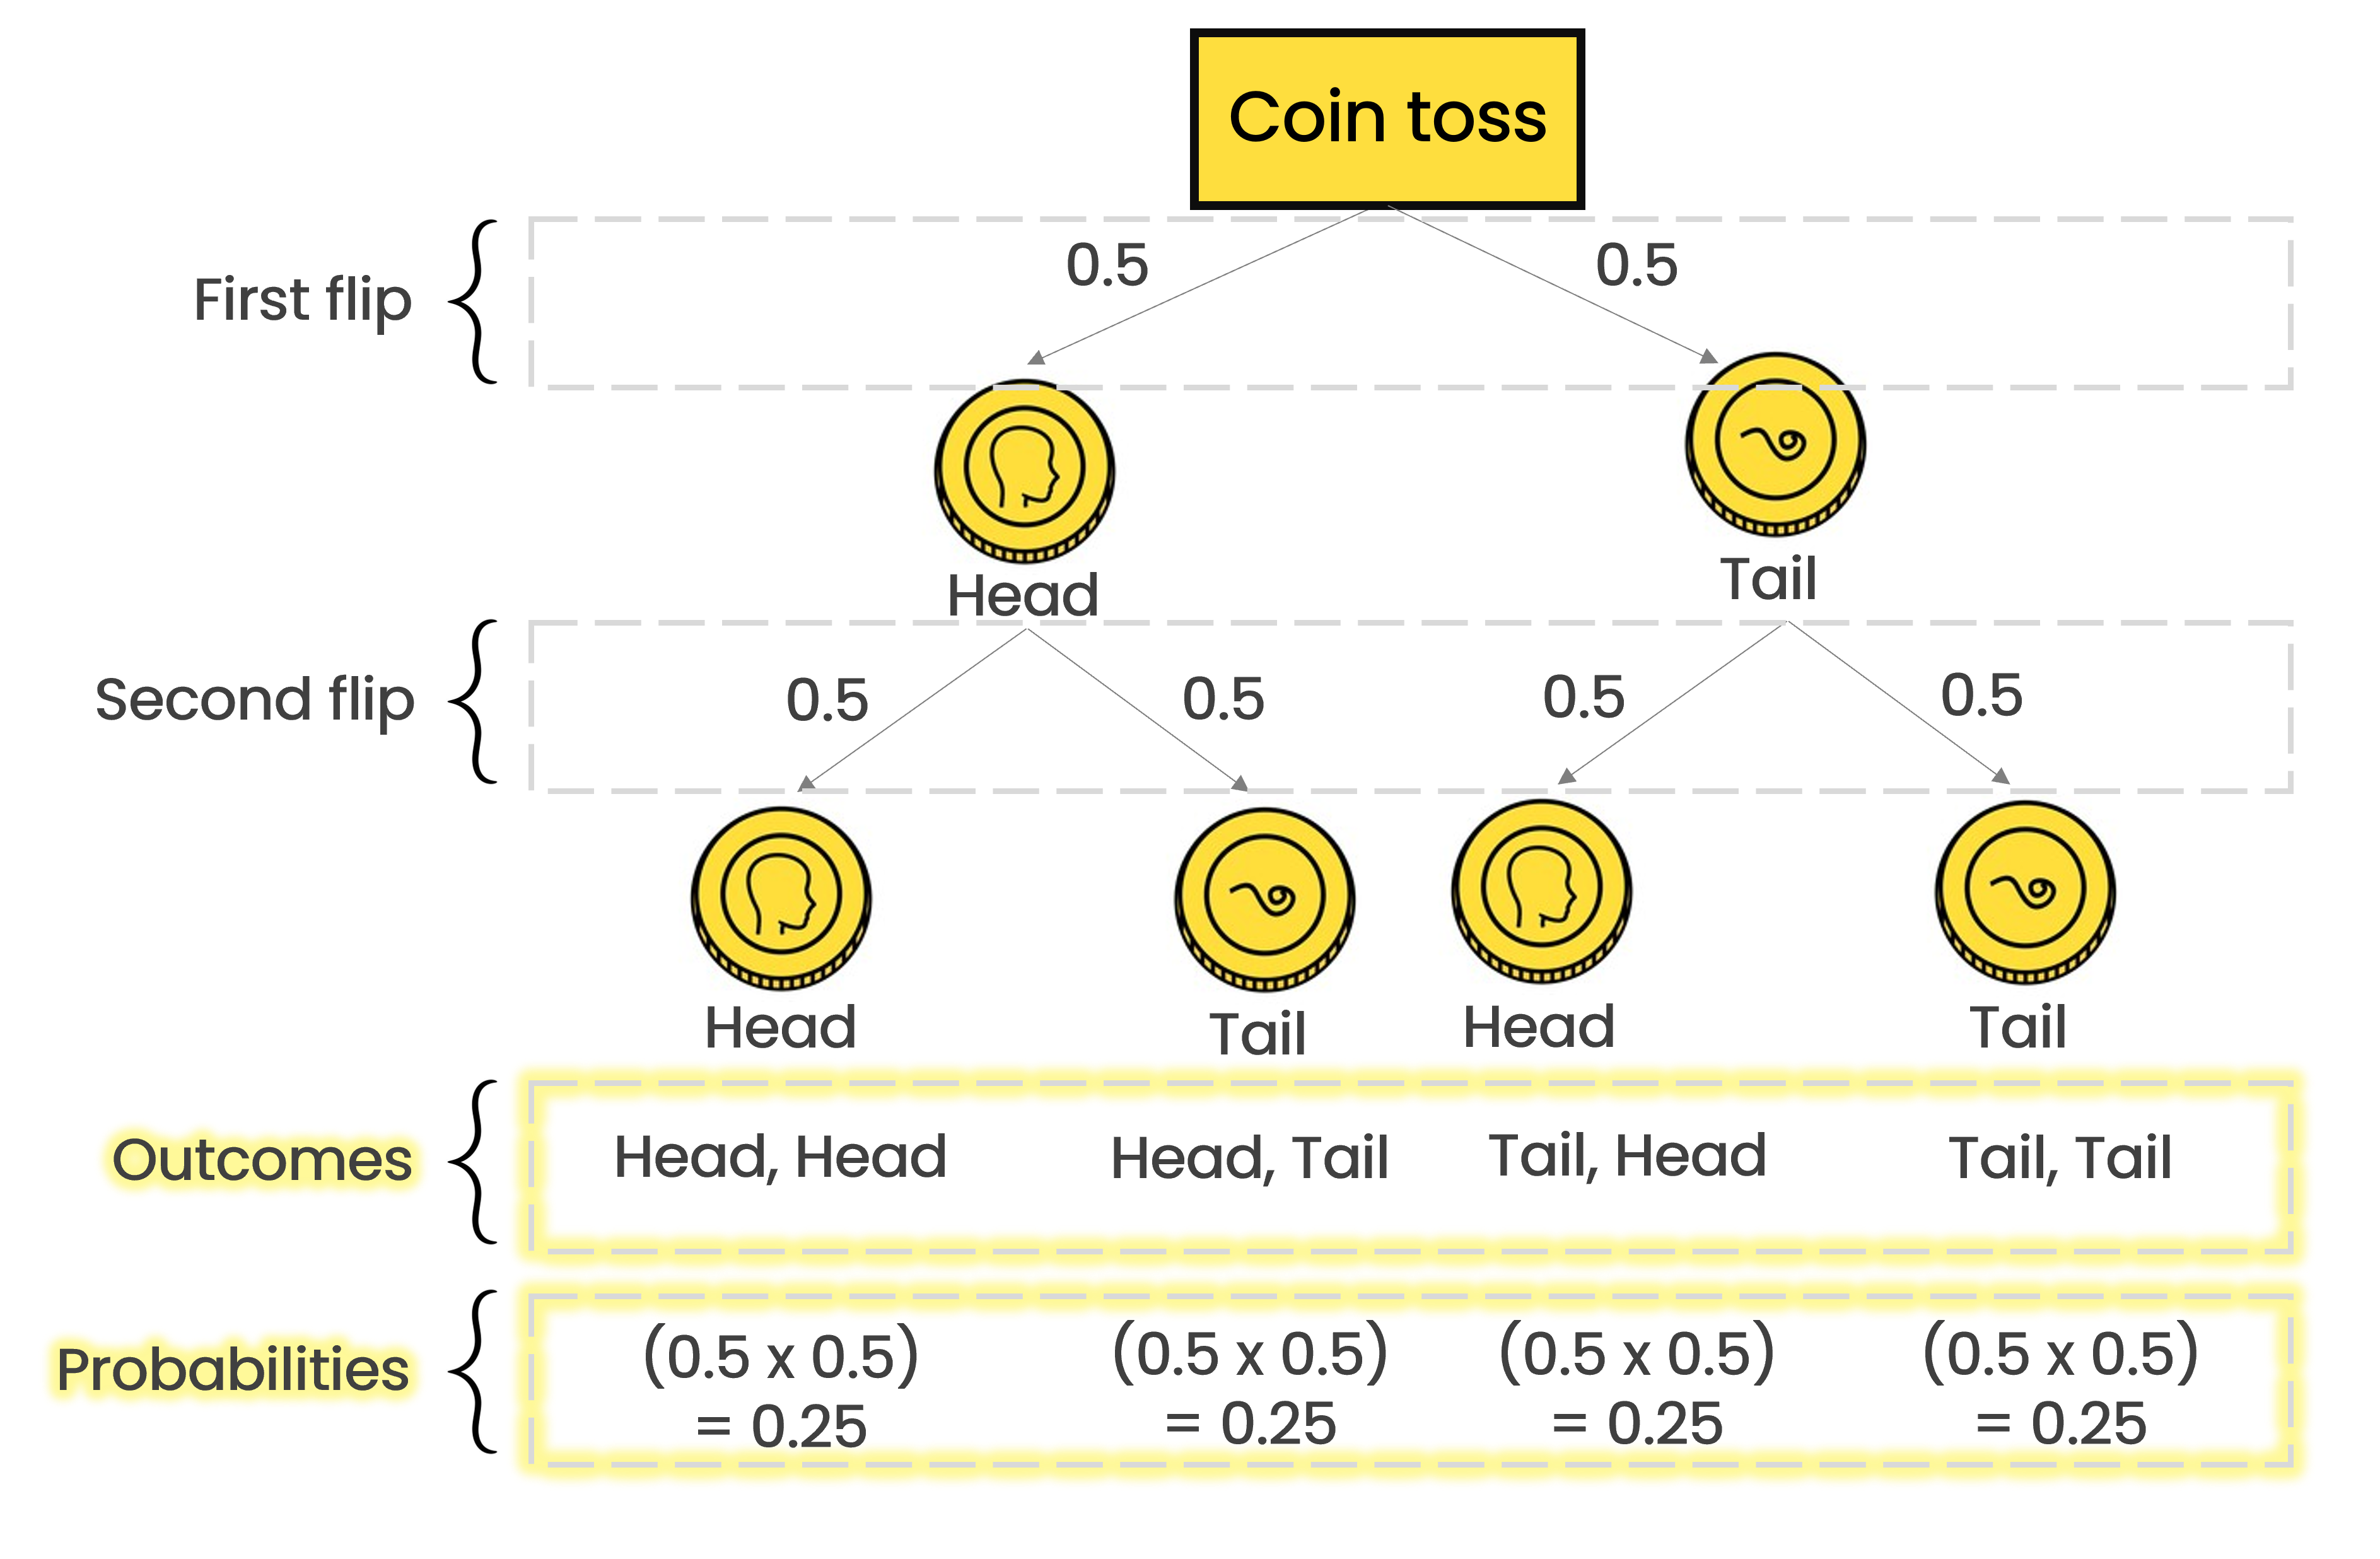
Probabilities in a coin toss
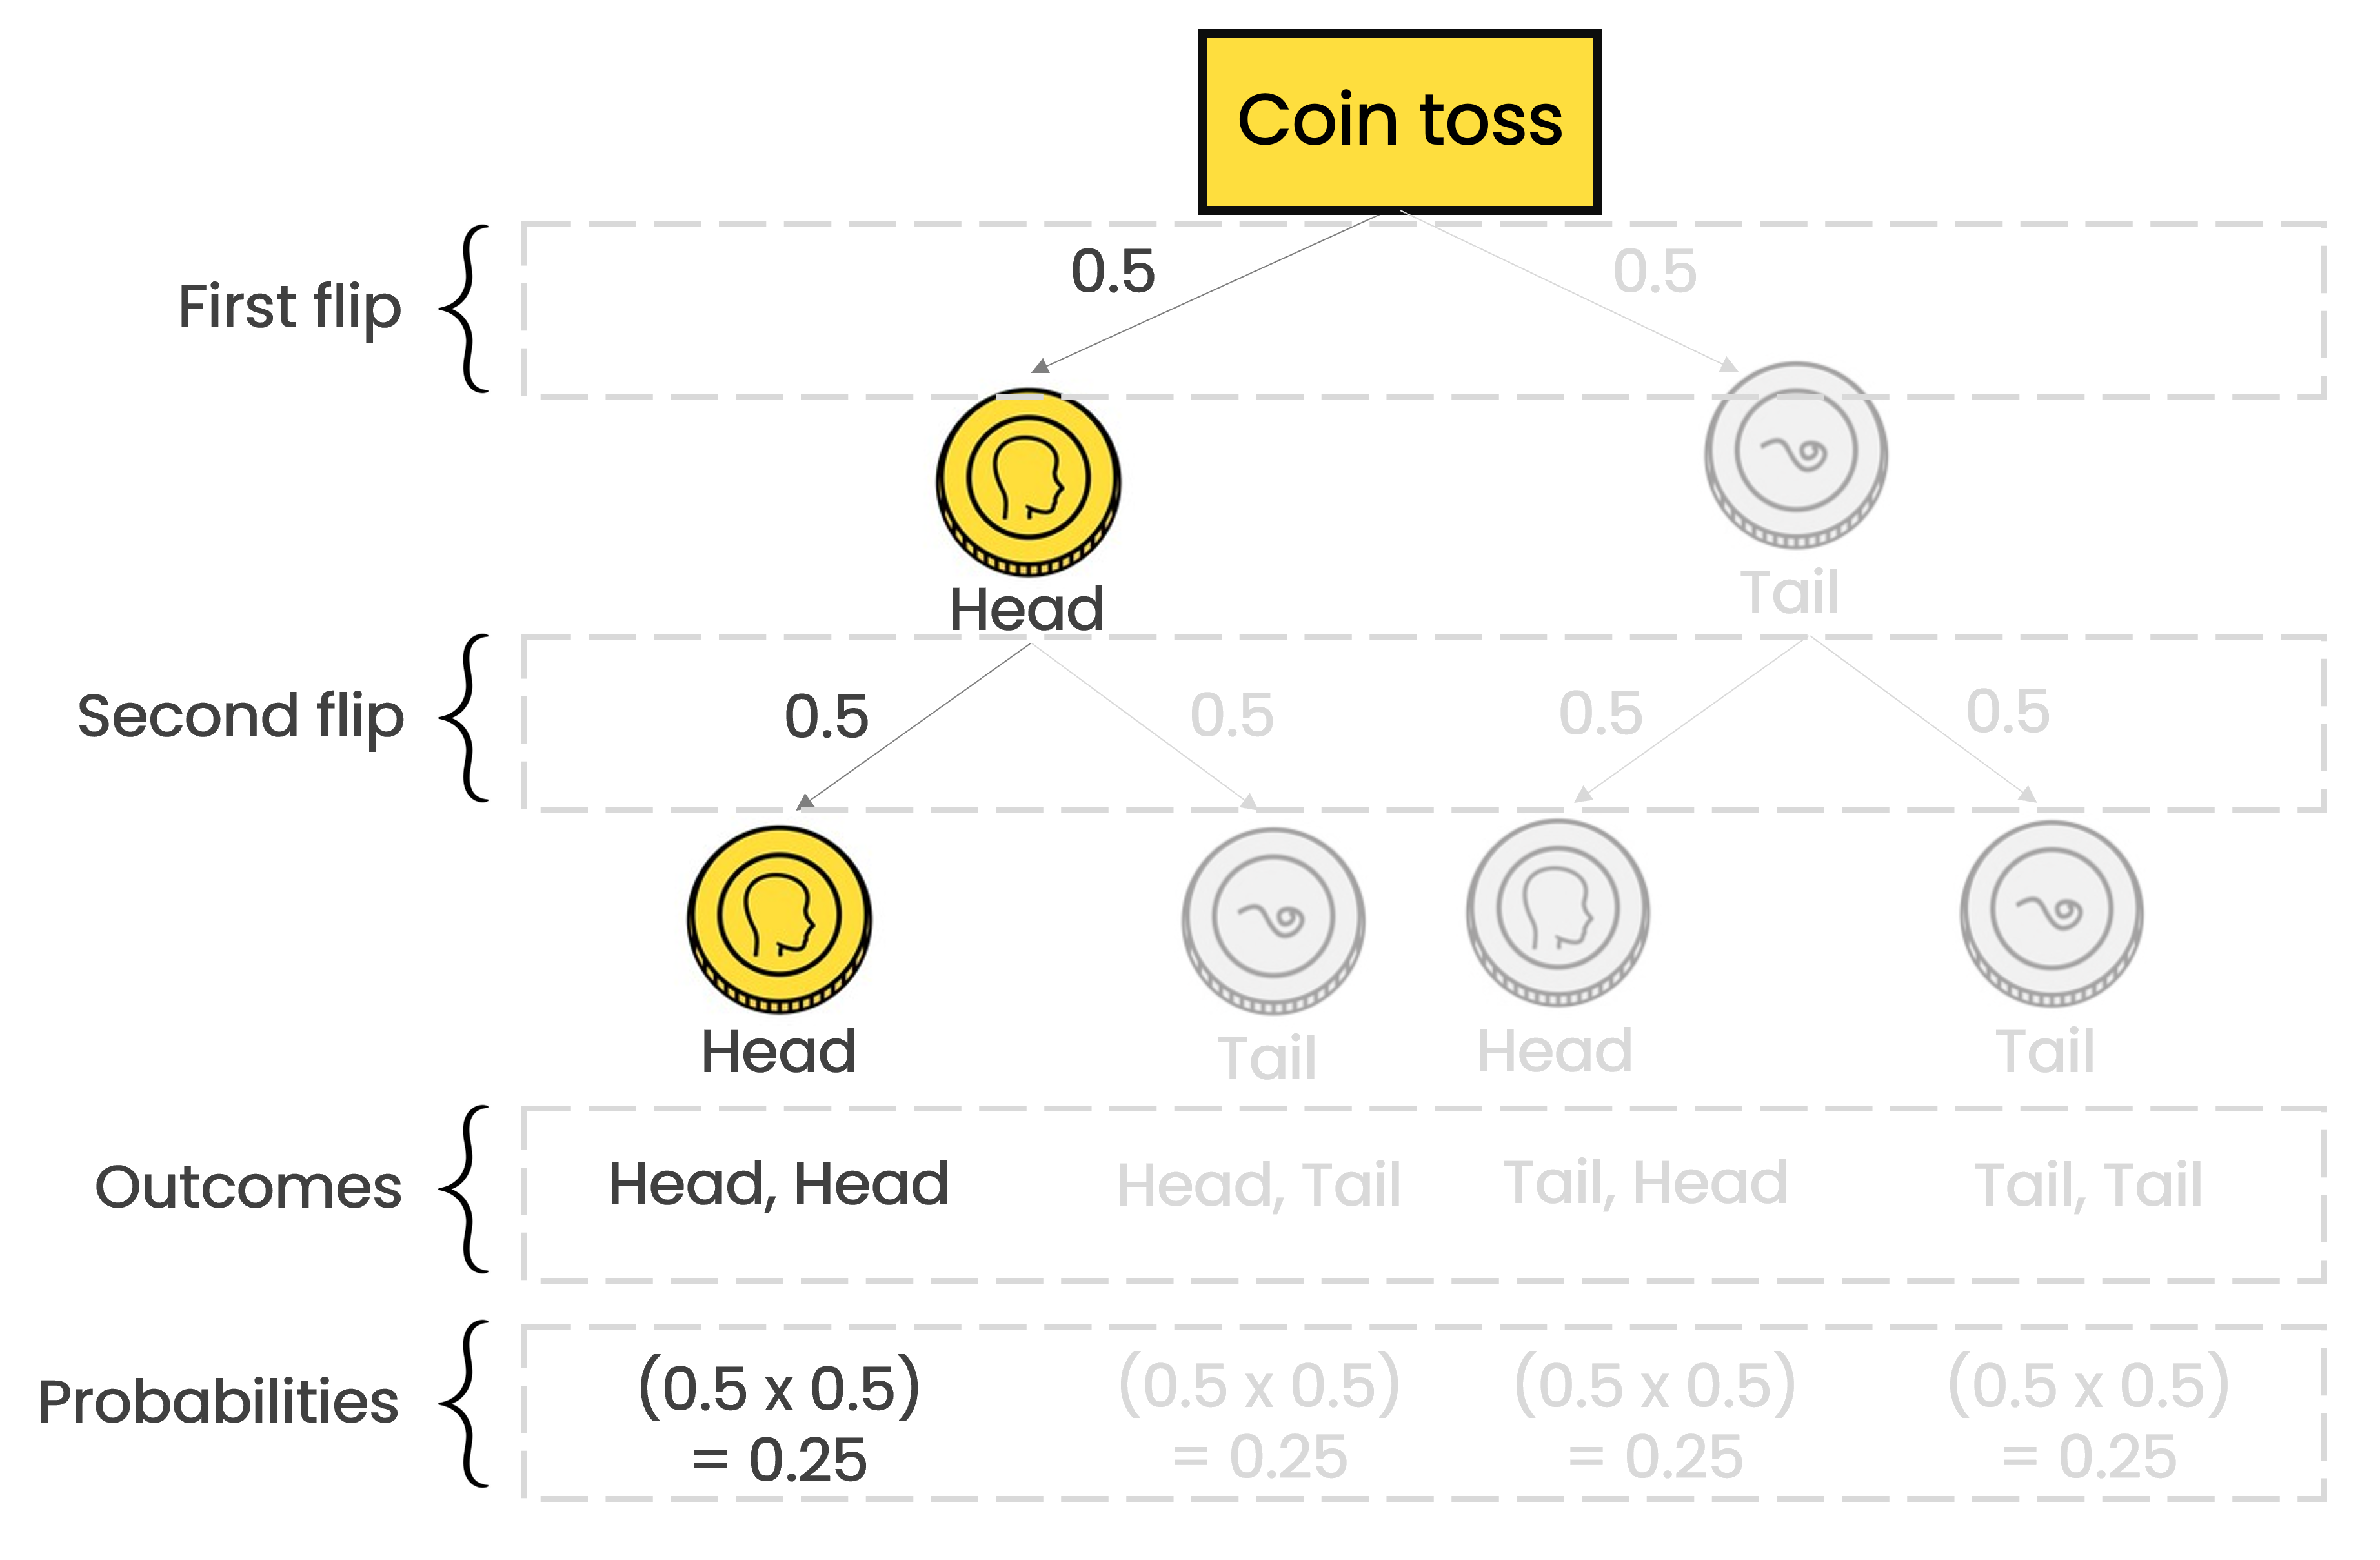
Probabilities in a coin toss
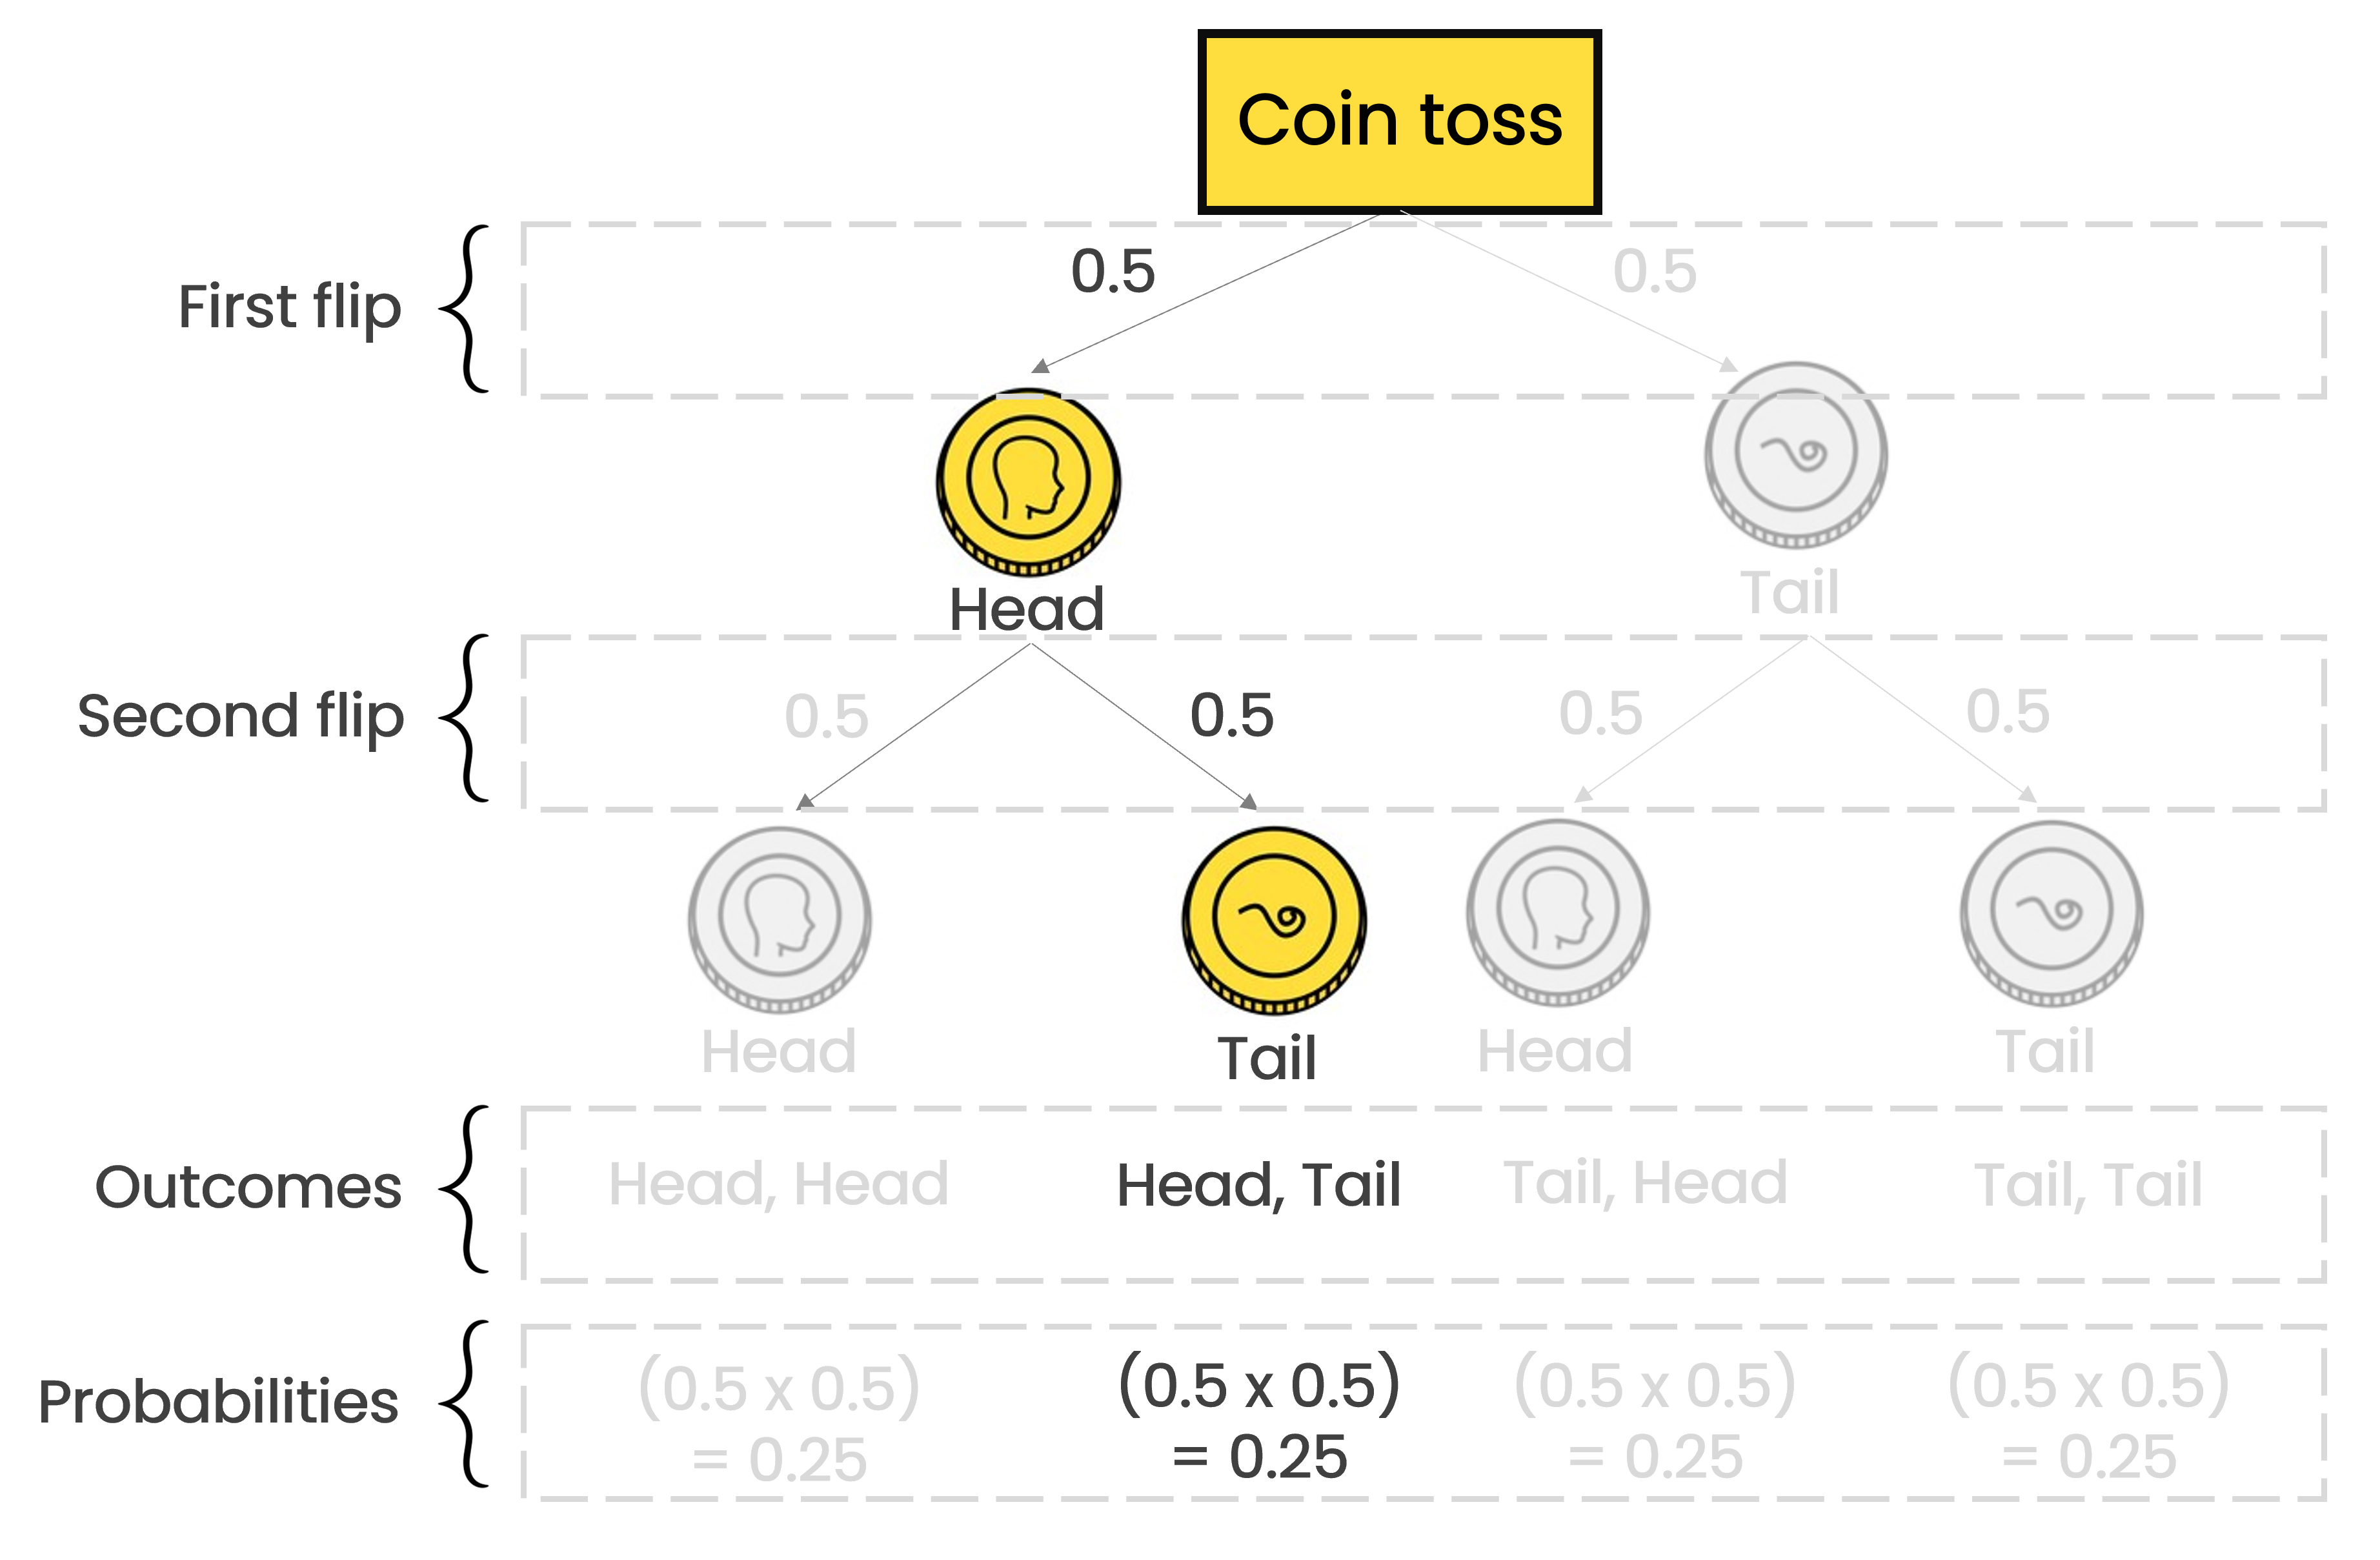
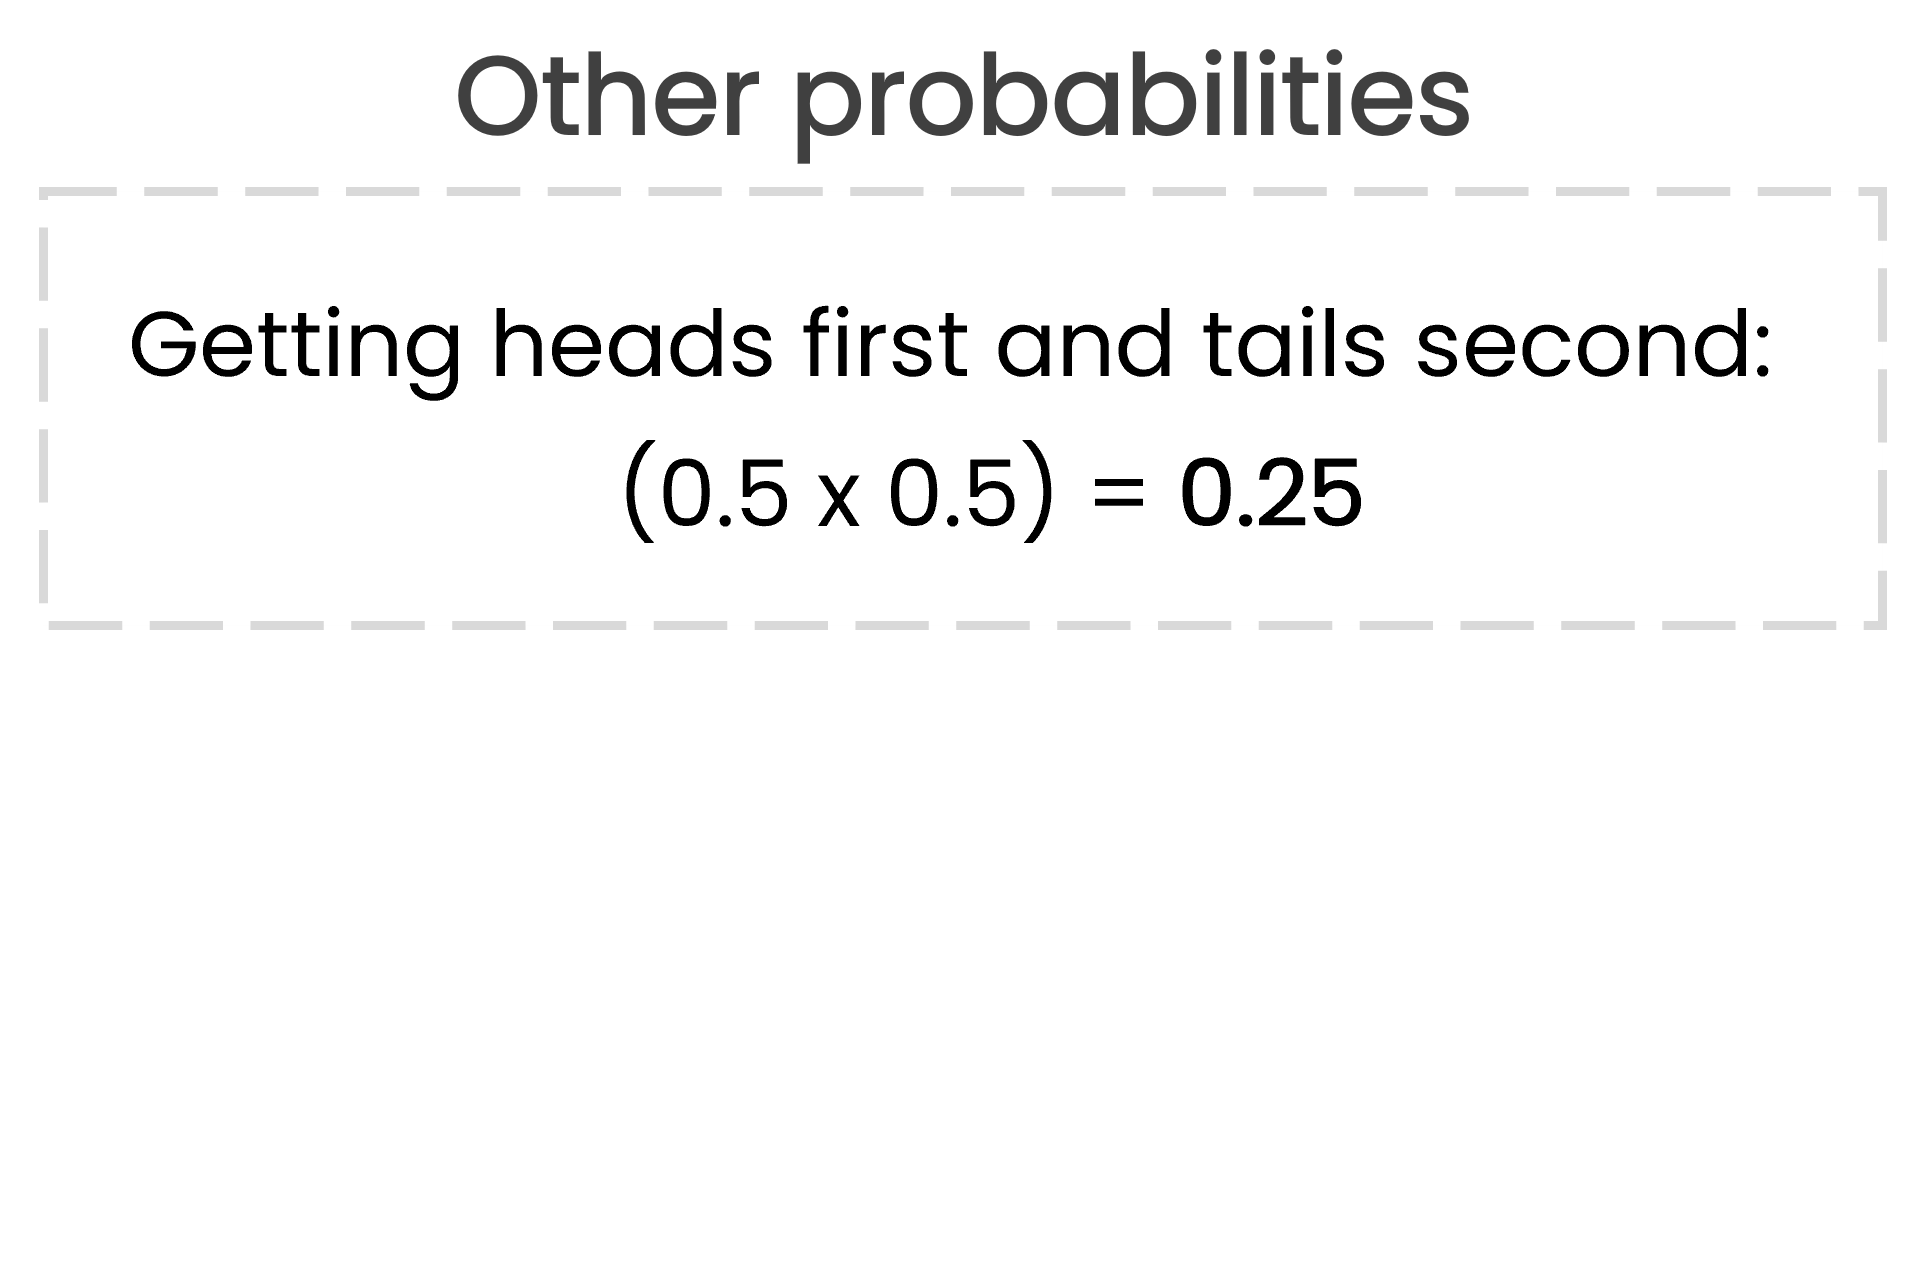
Probabilities in a coin toss
Building a Probabilistic Decision Model

Building a Probabilistic Decision Model

Building a Probabilistic Decision Model
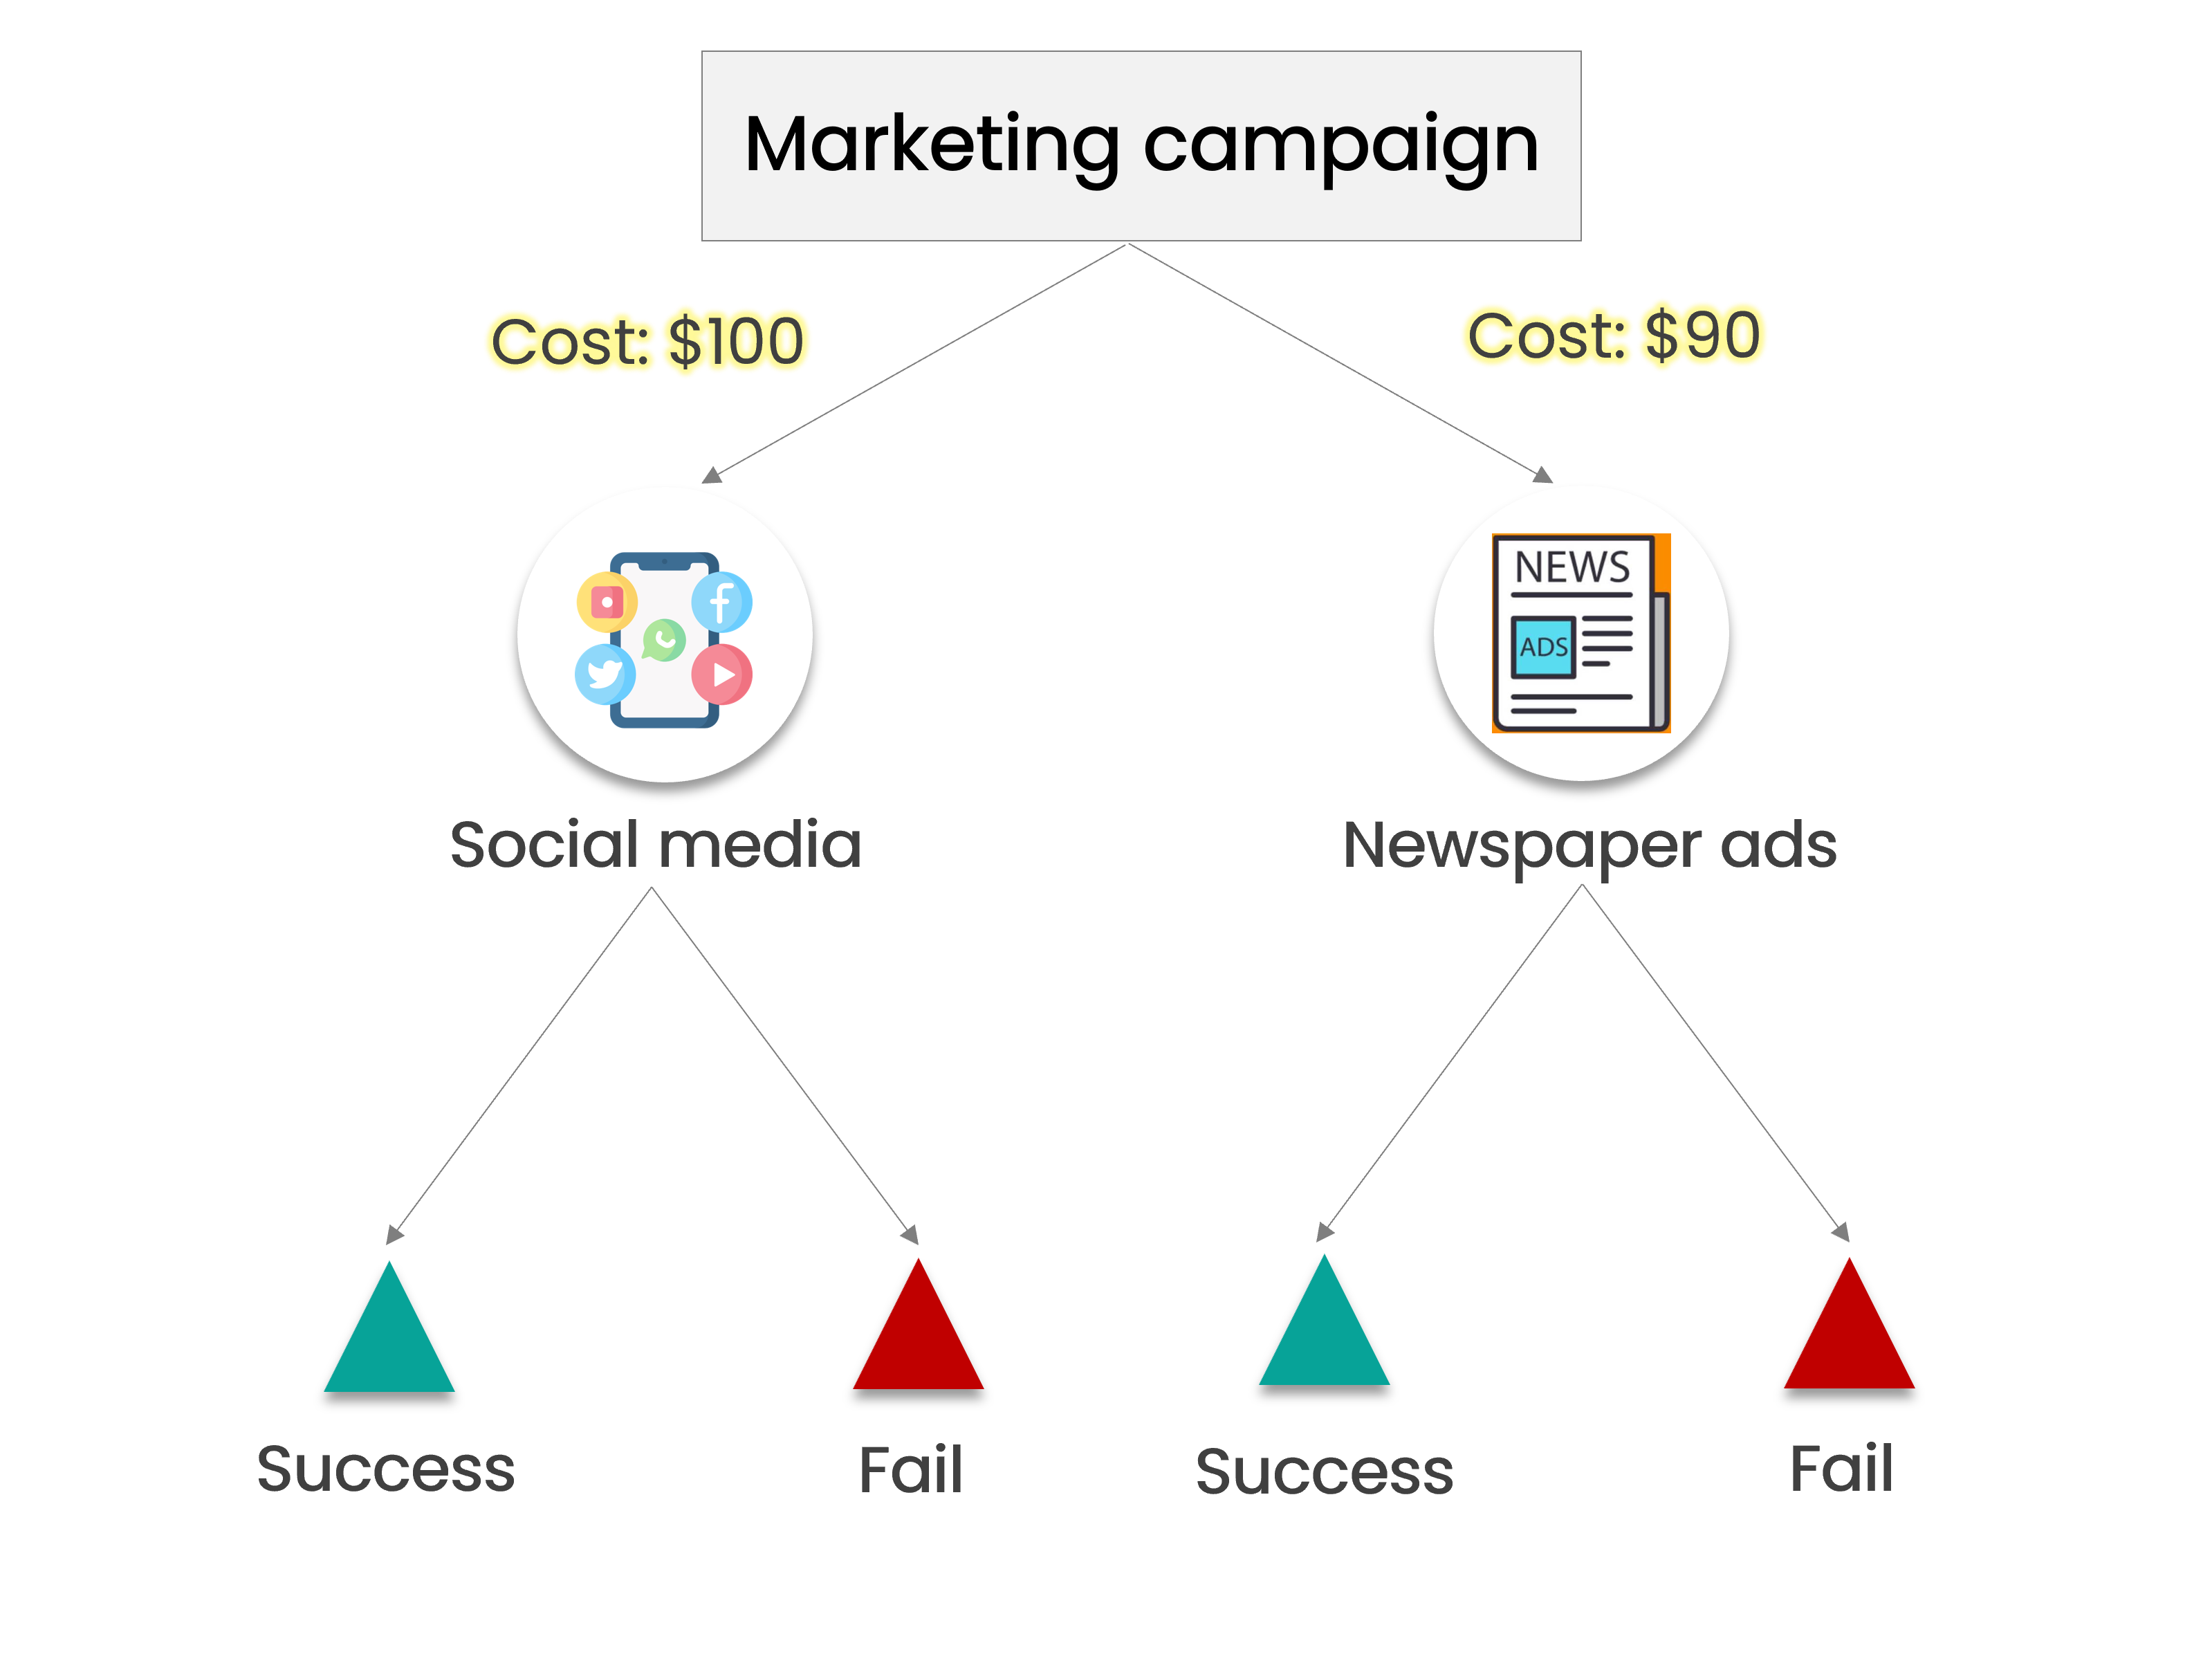
Building a Probabilistic Decision Model
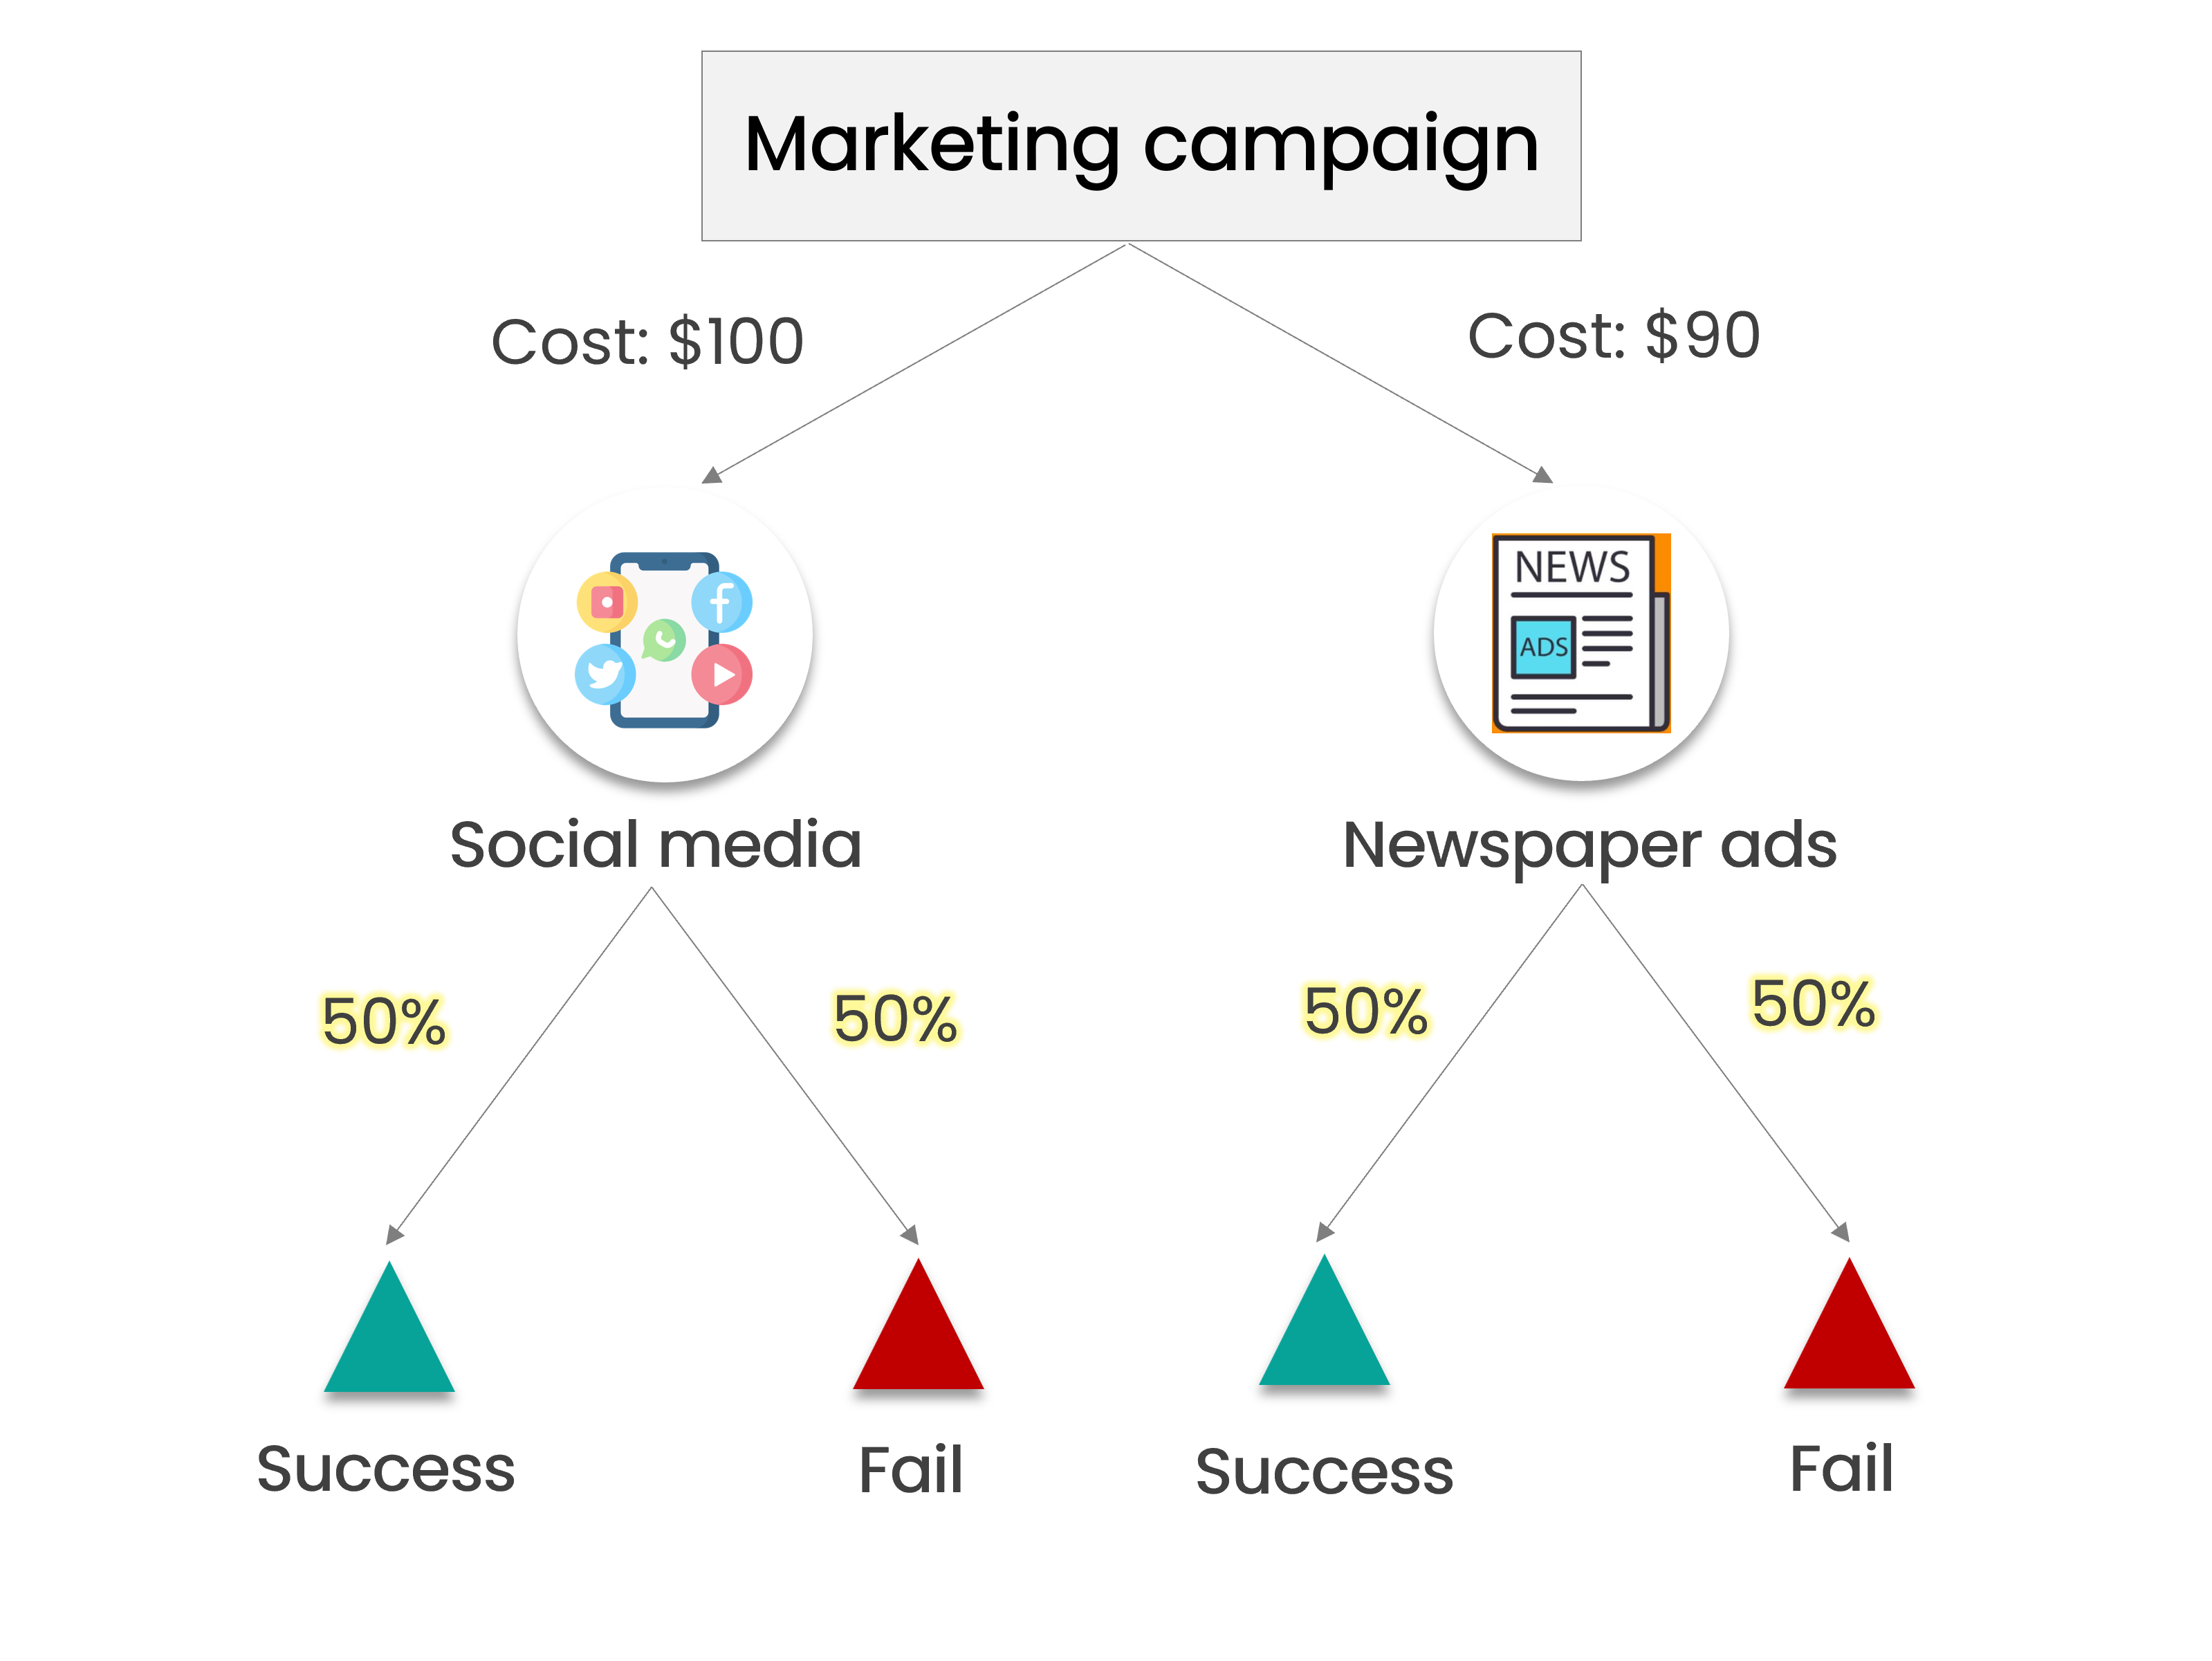
Building a Probabilistic Decision Model
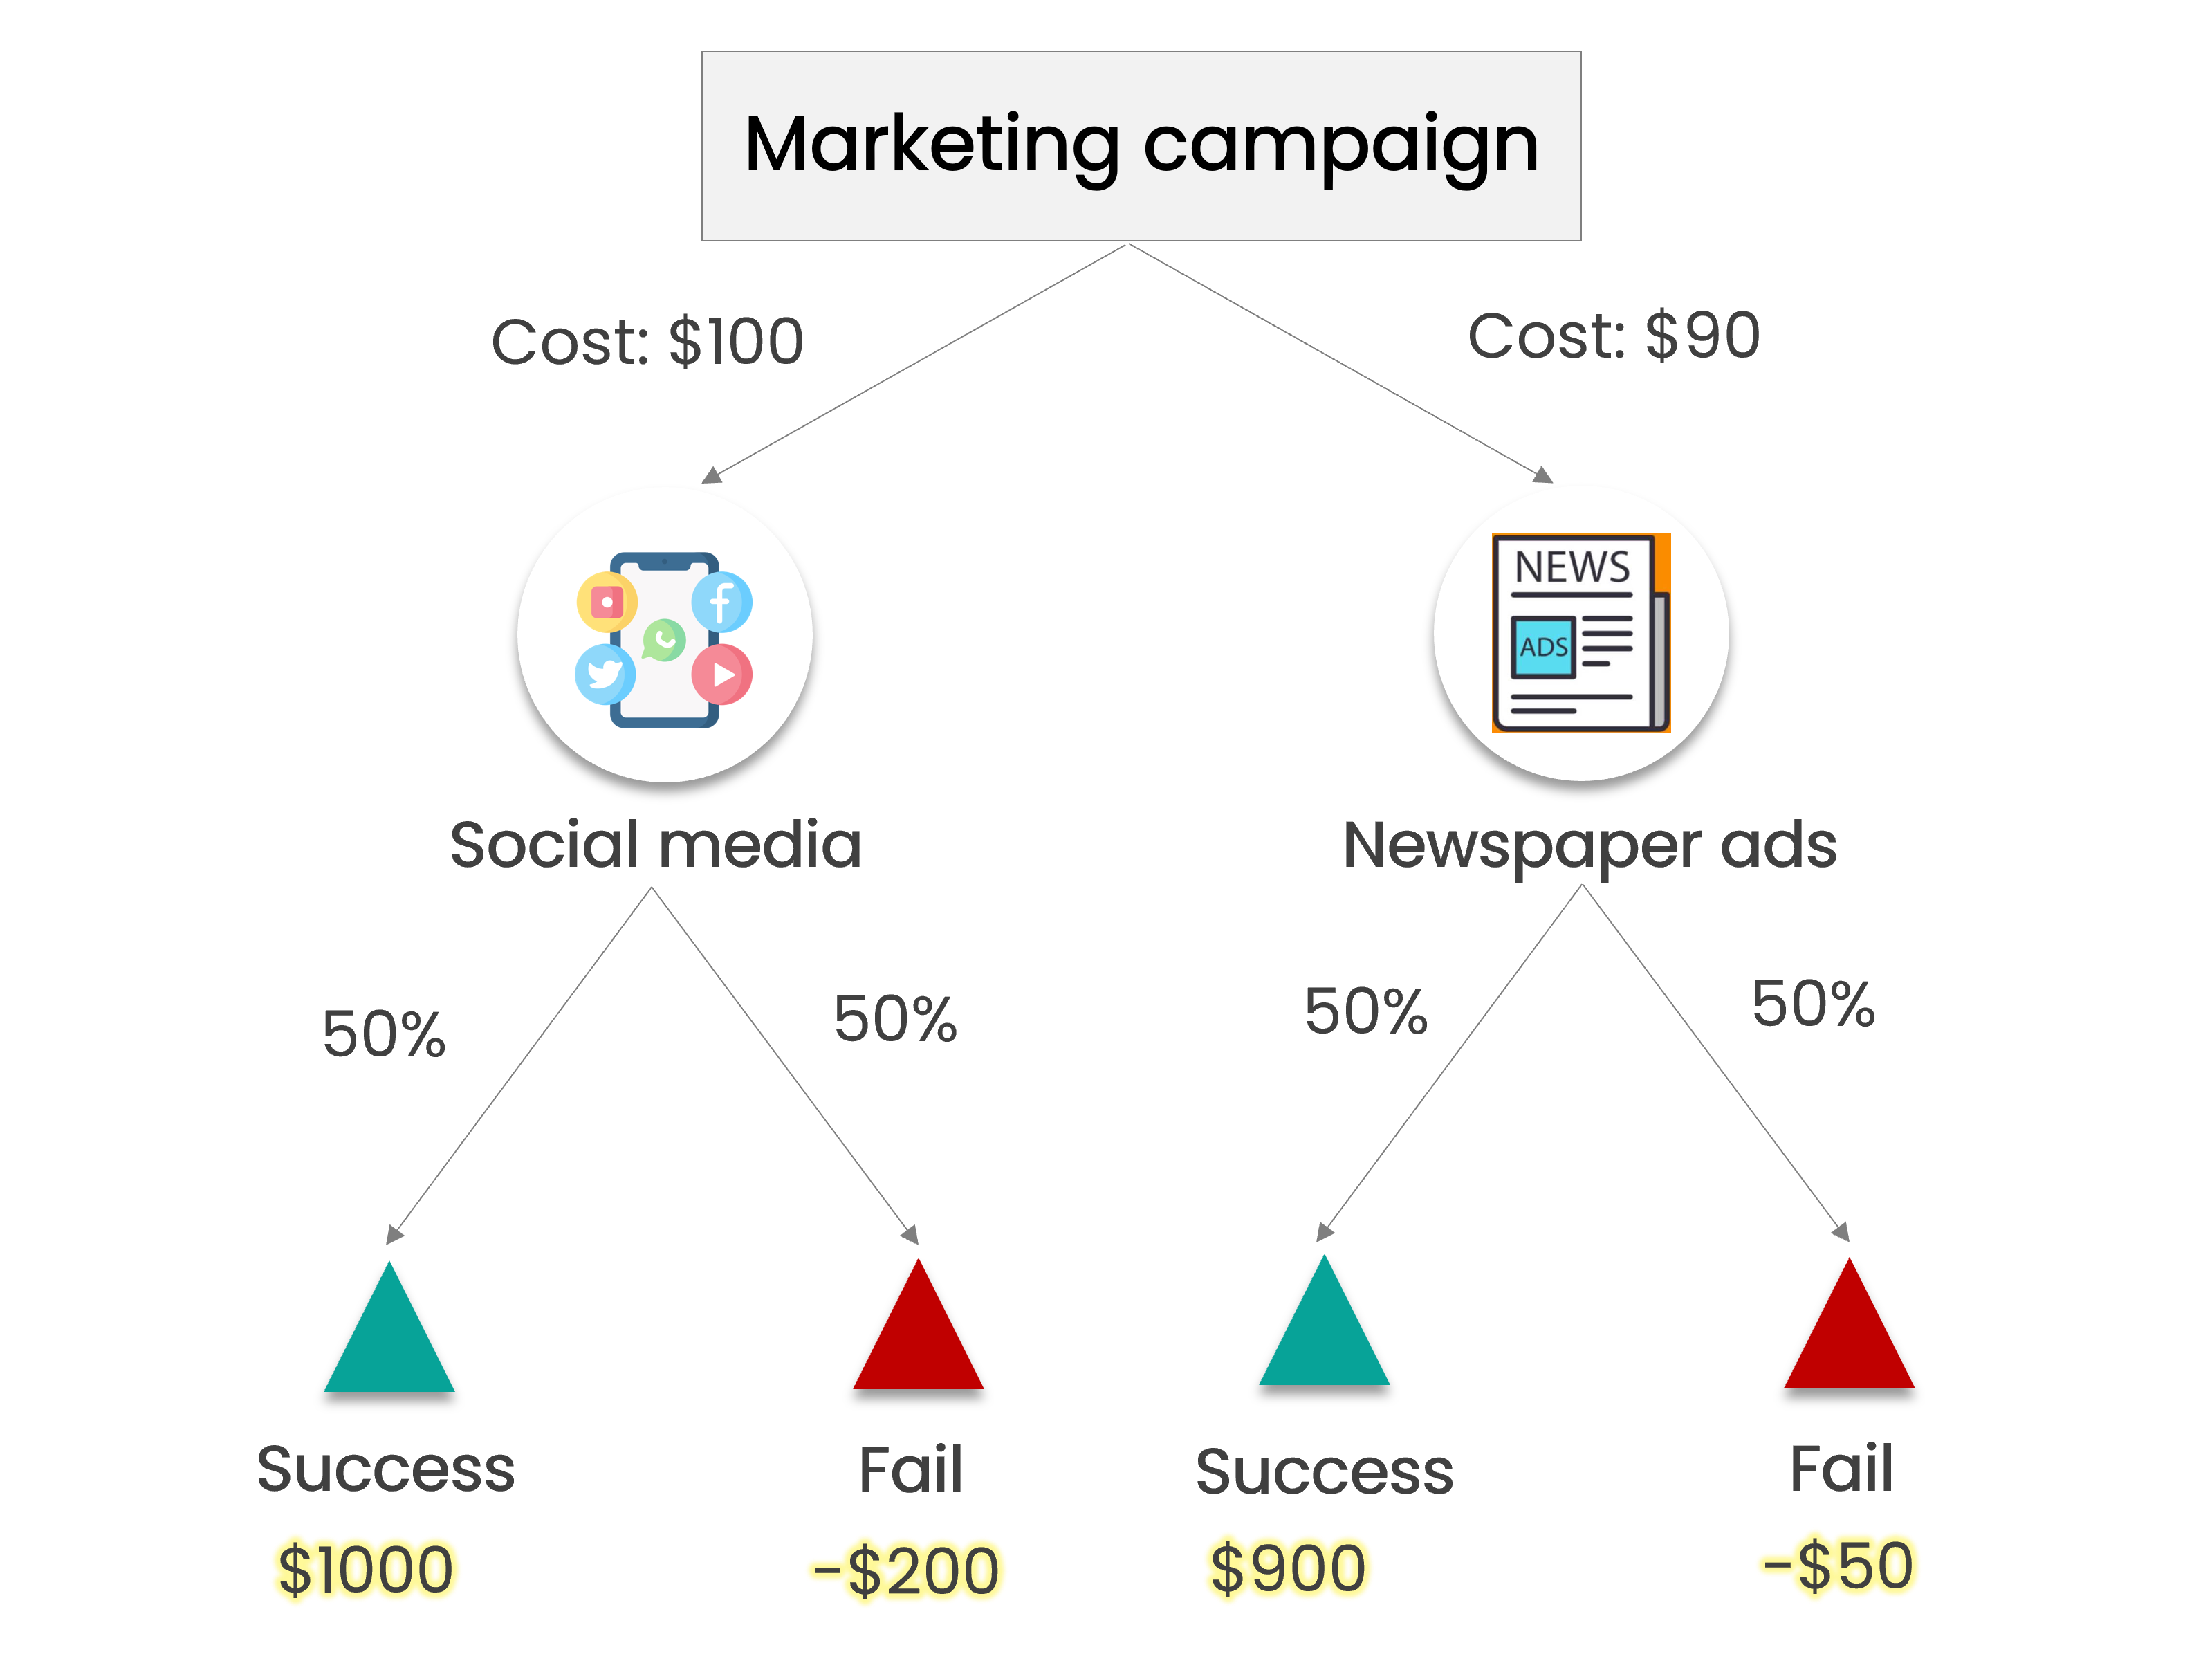
Building a Probabilistic Decision Model
Building a Probabilistic Decision Model
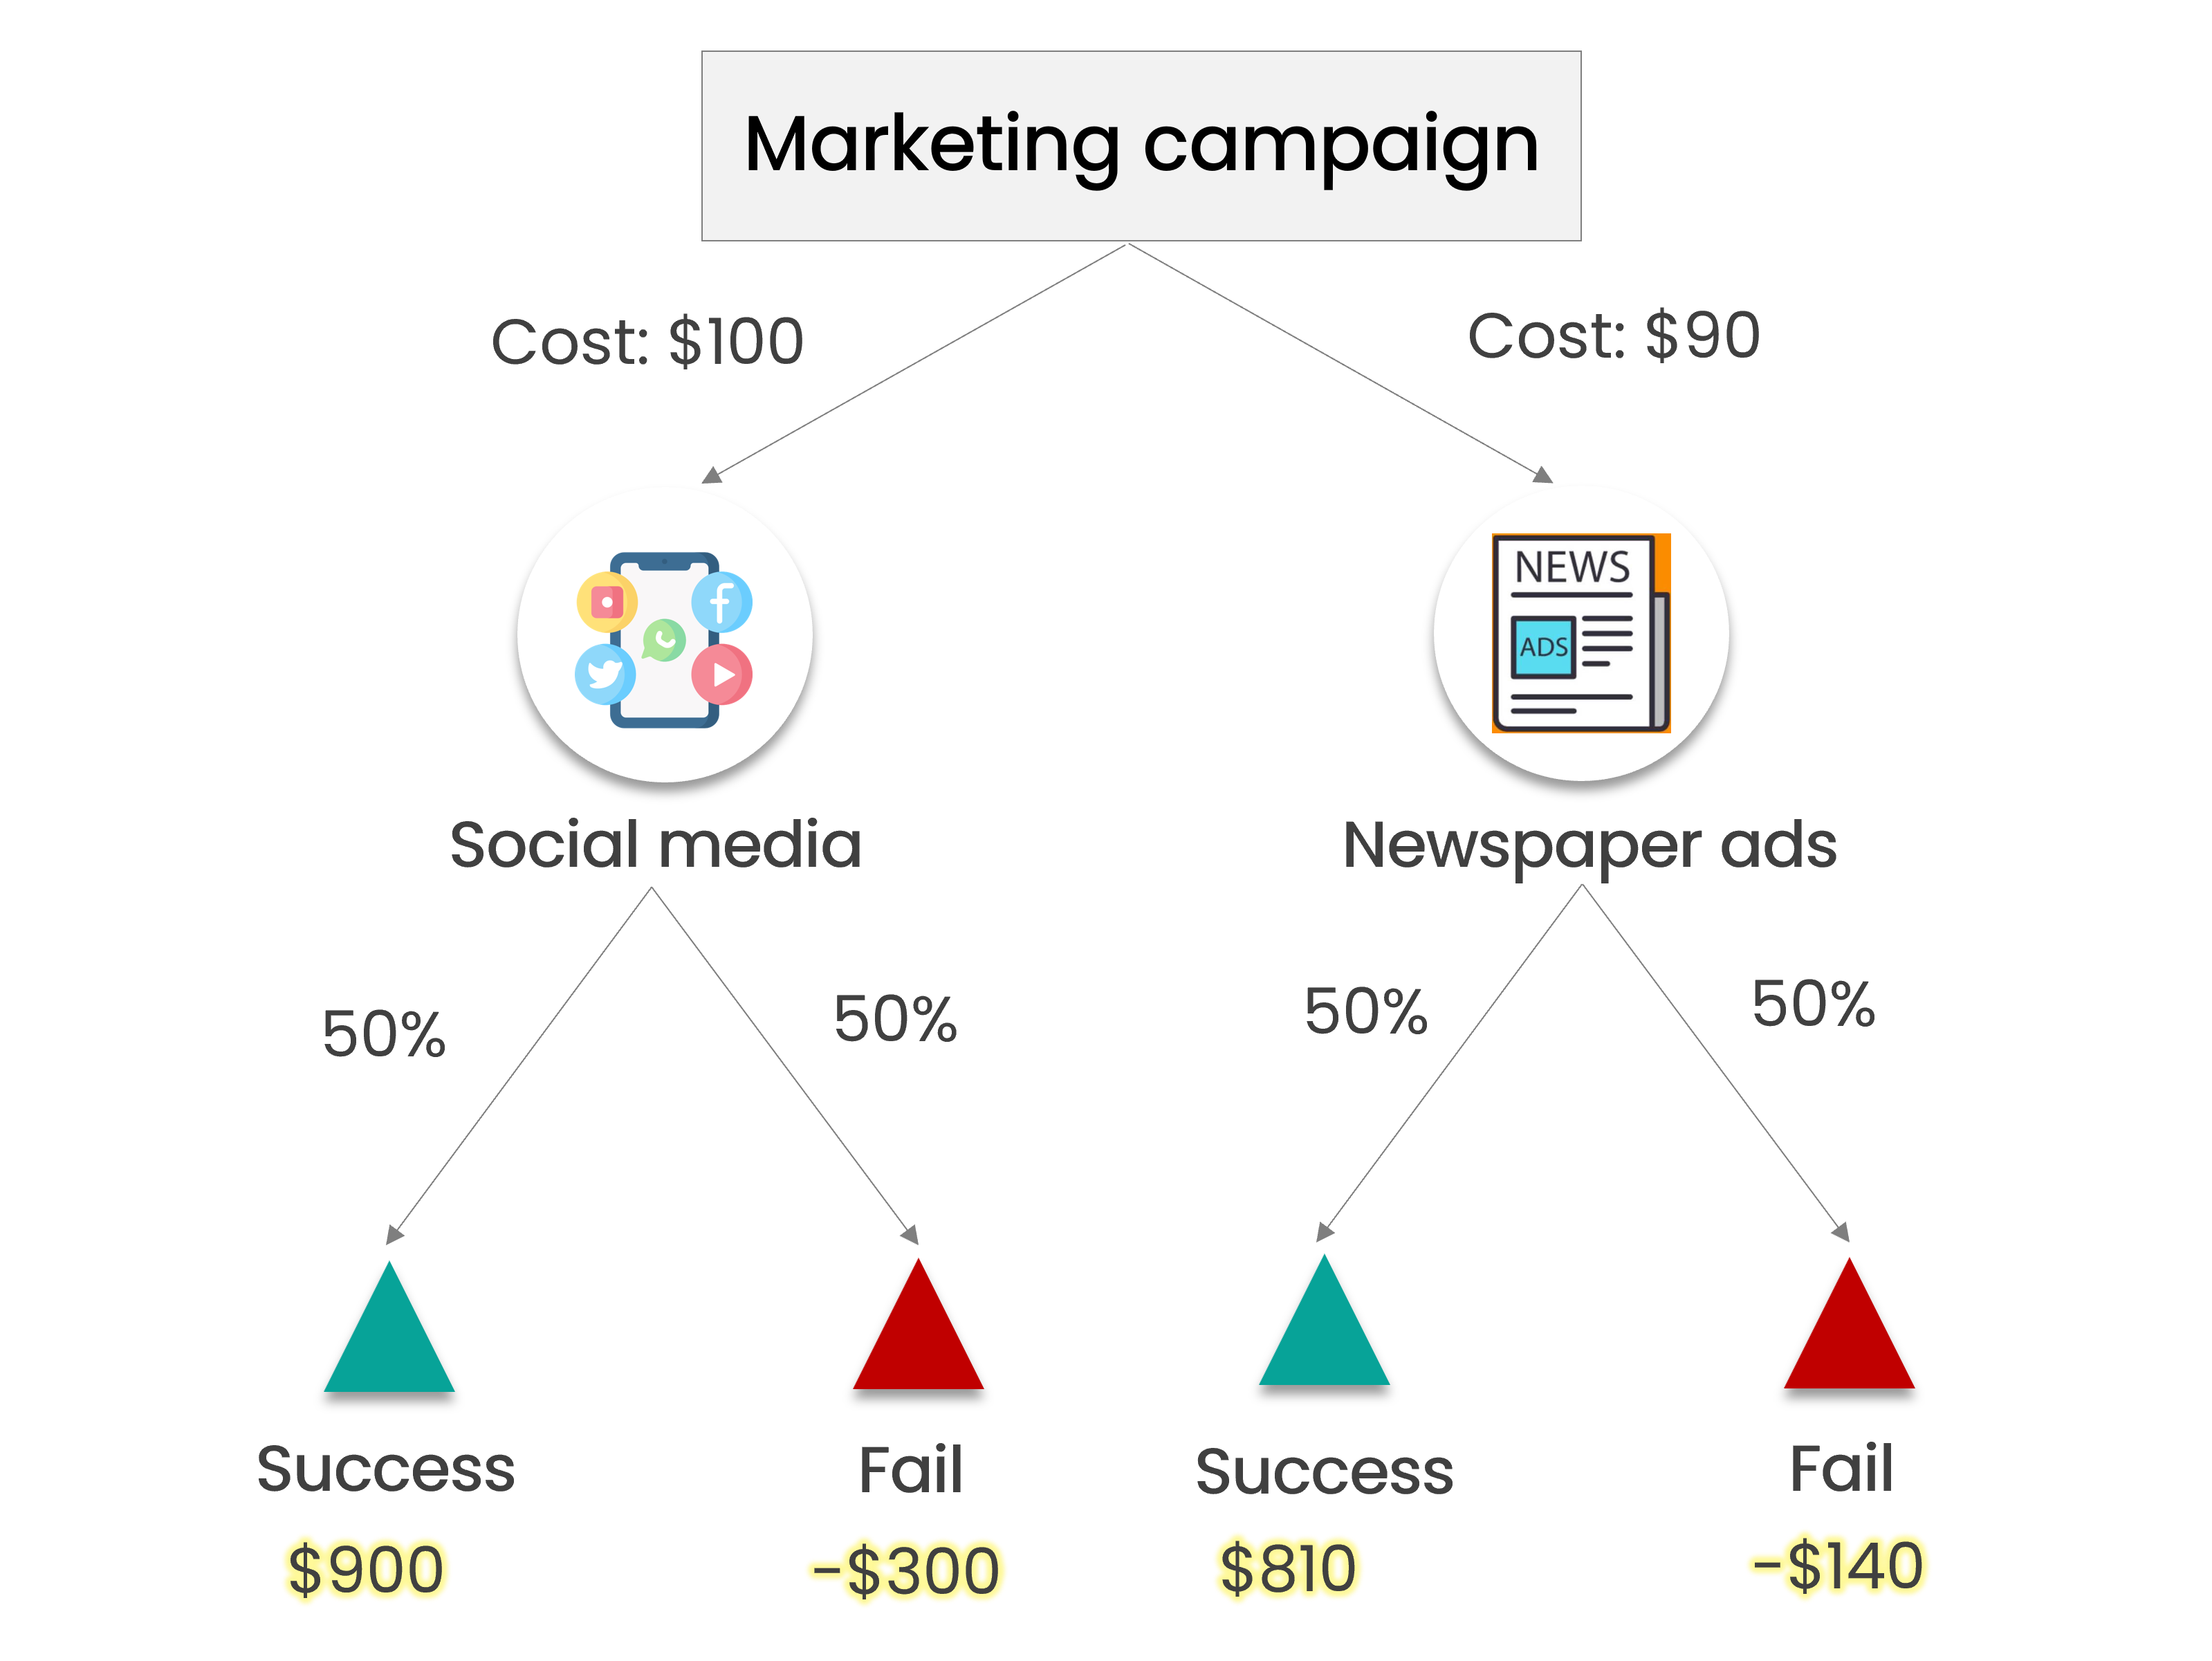
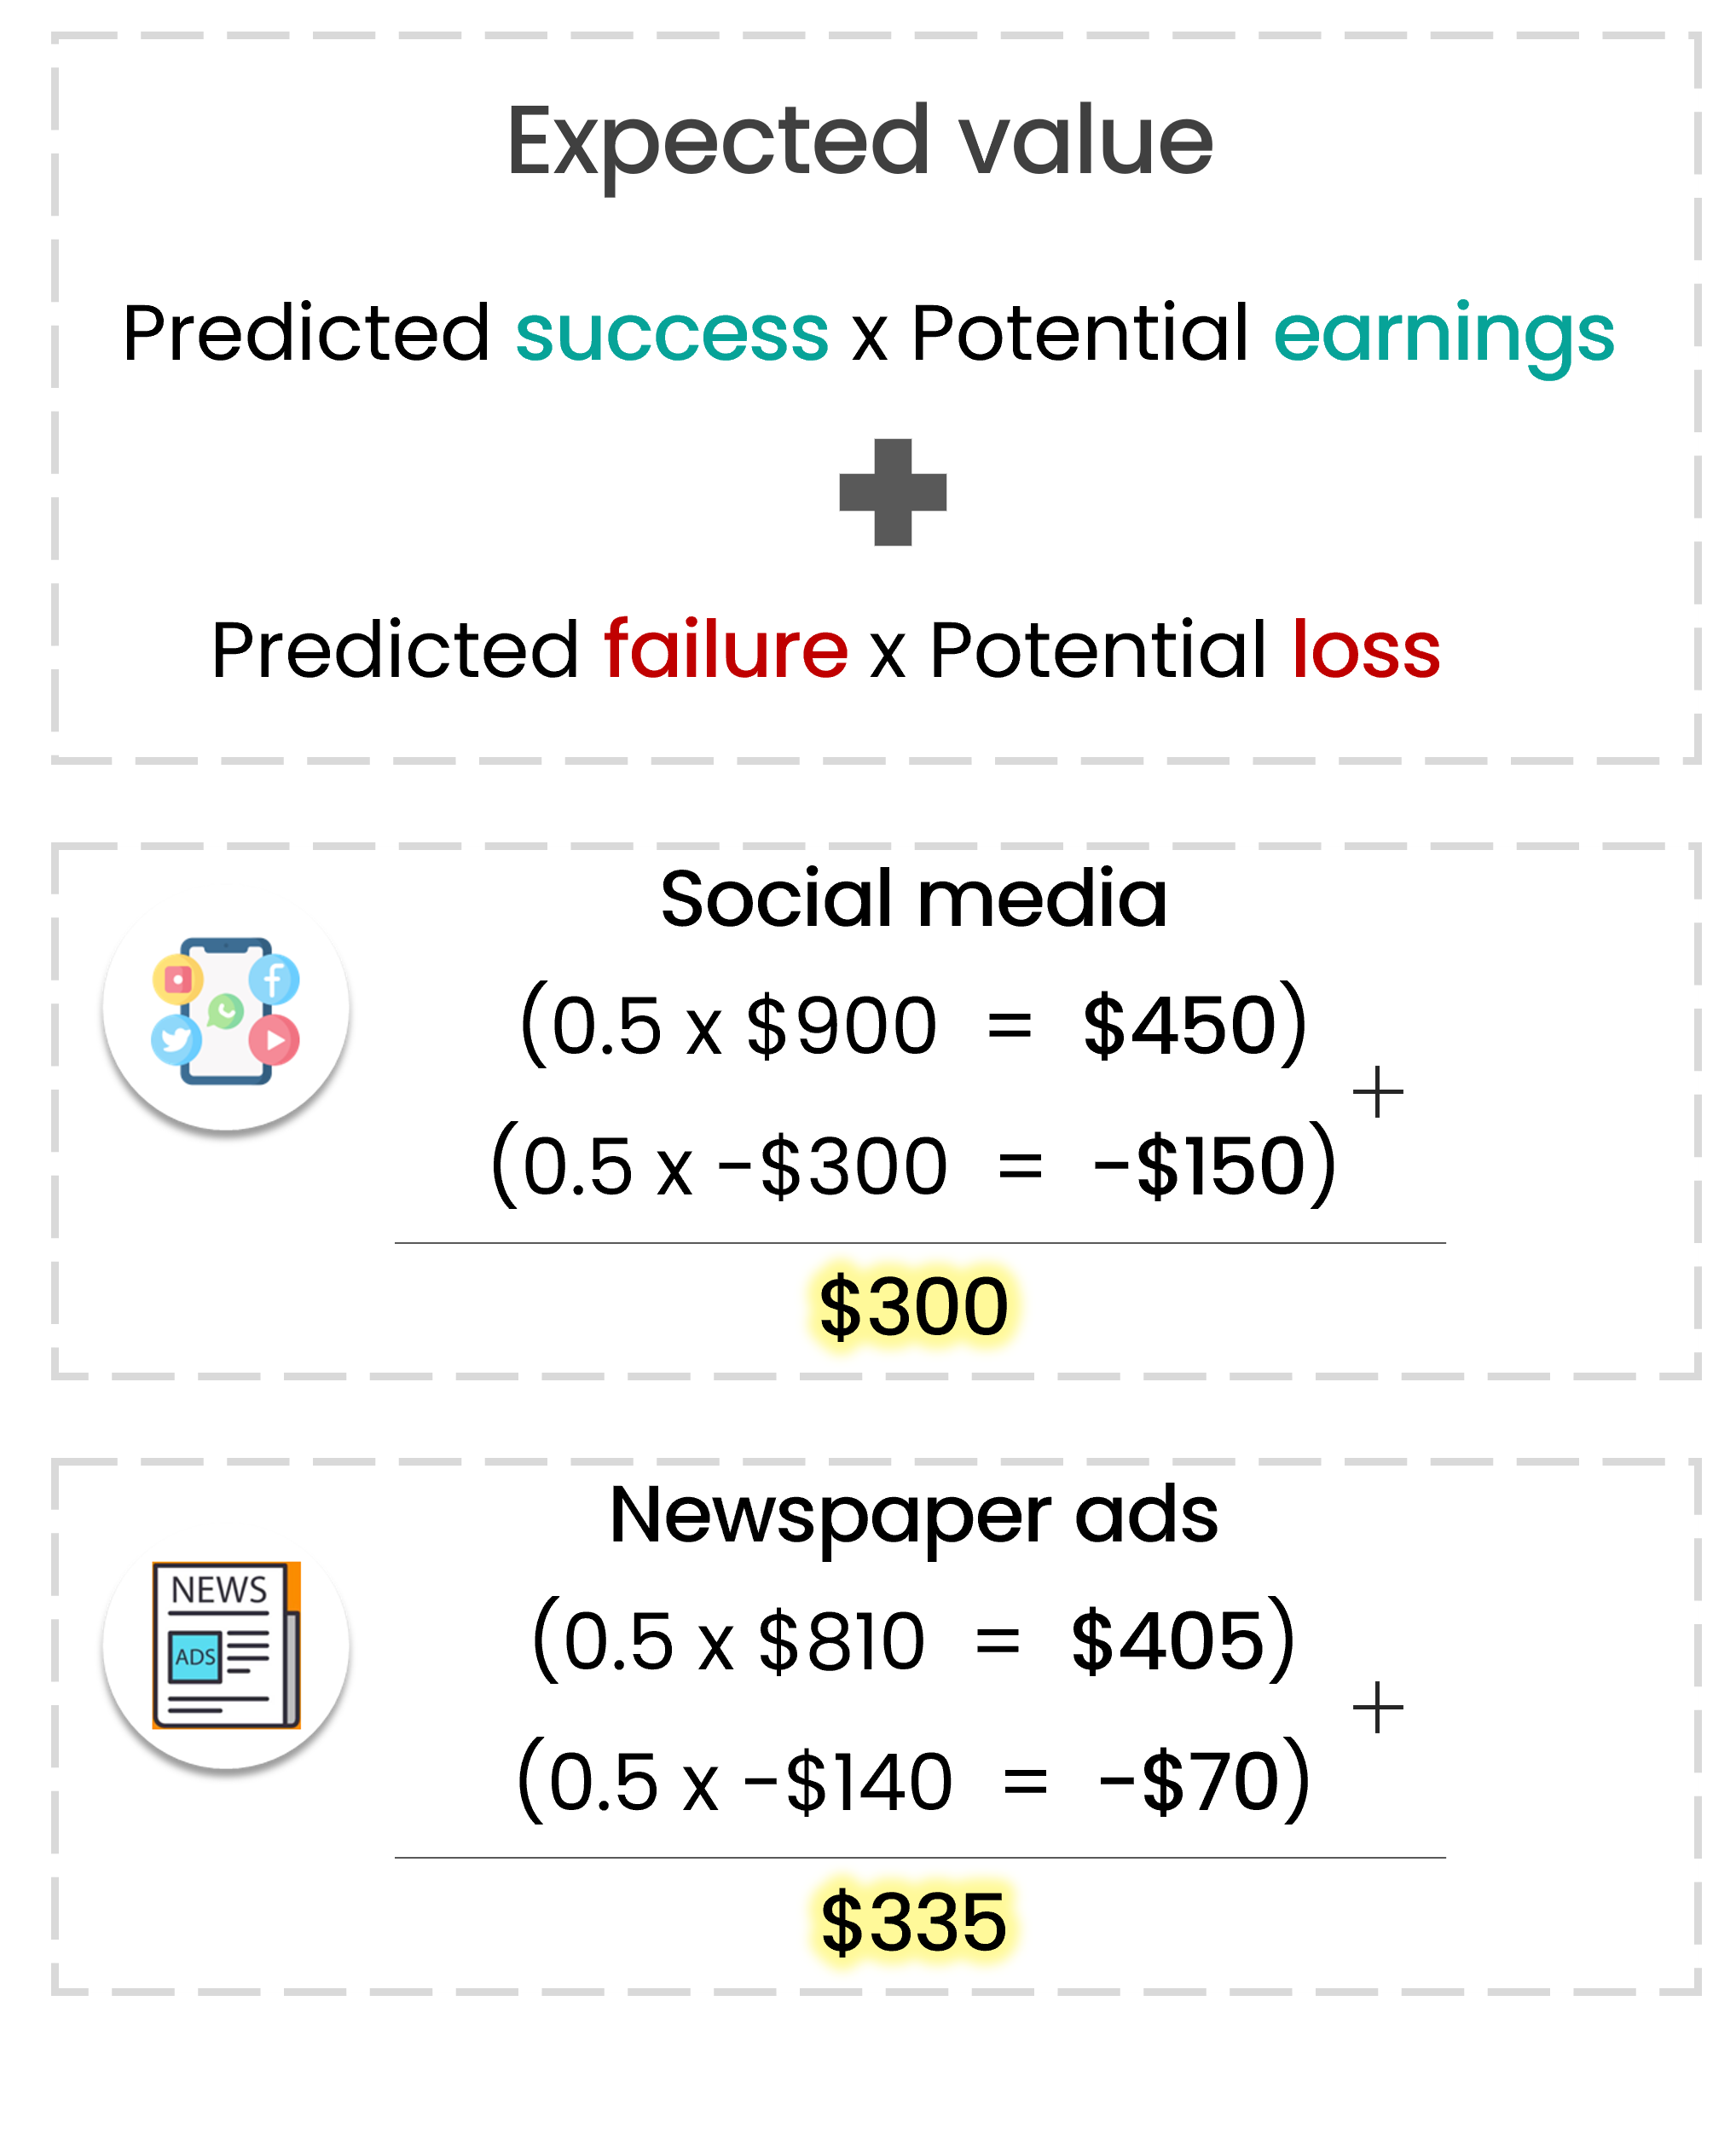
Evaluating expected value
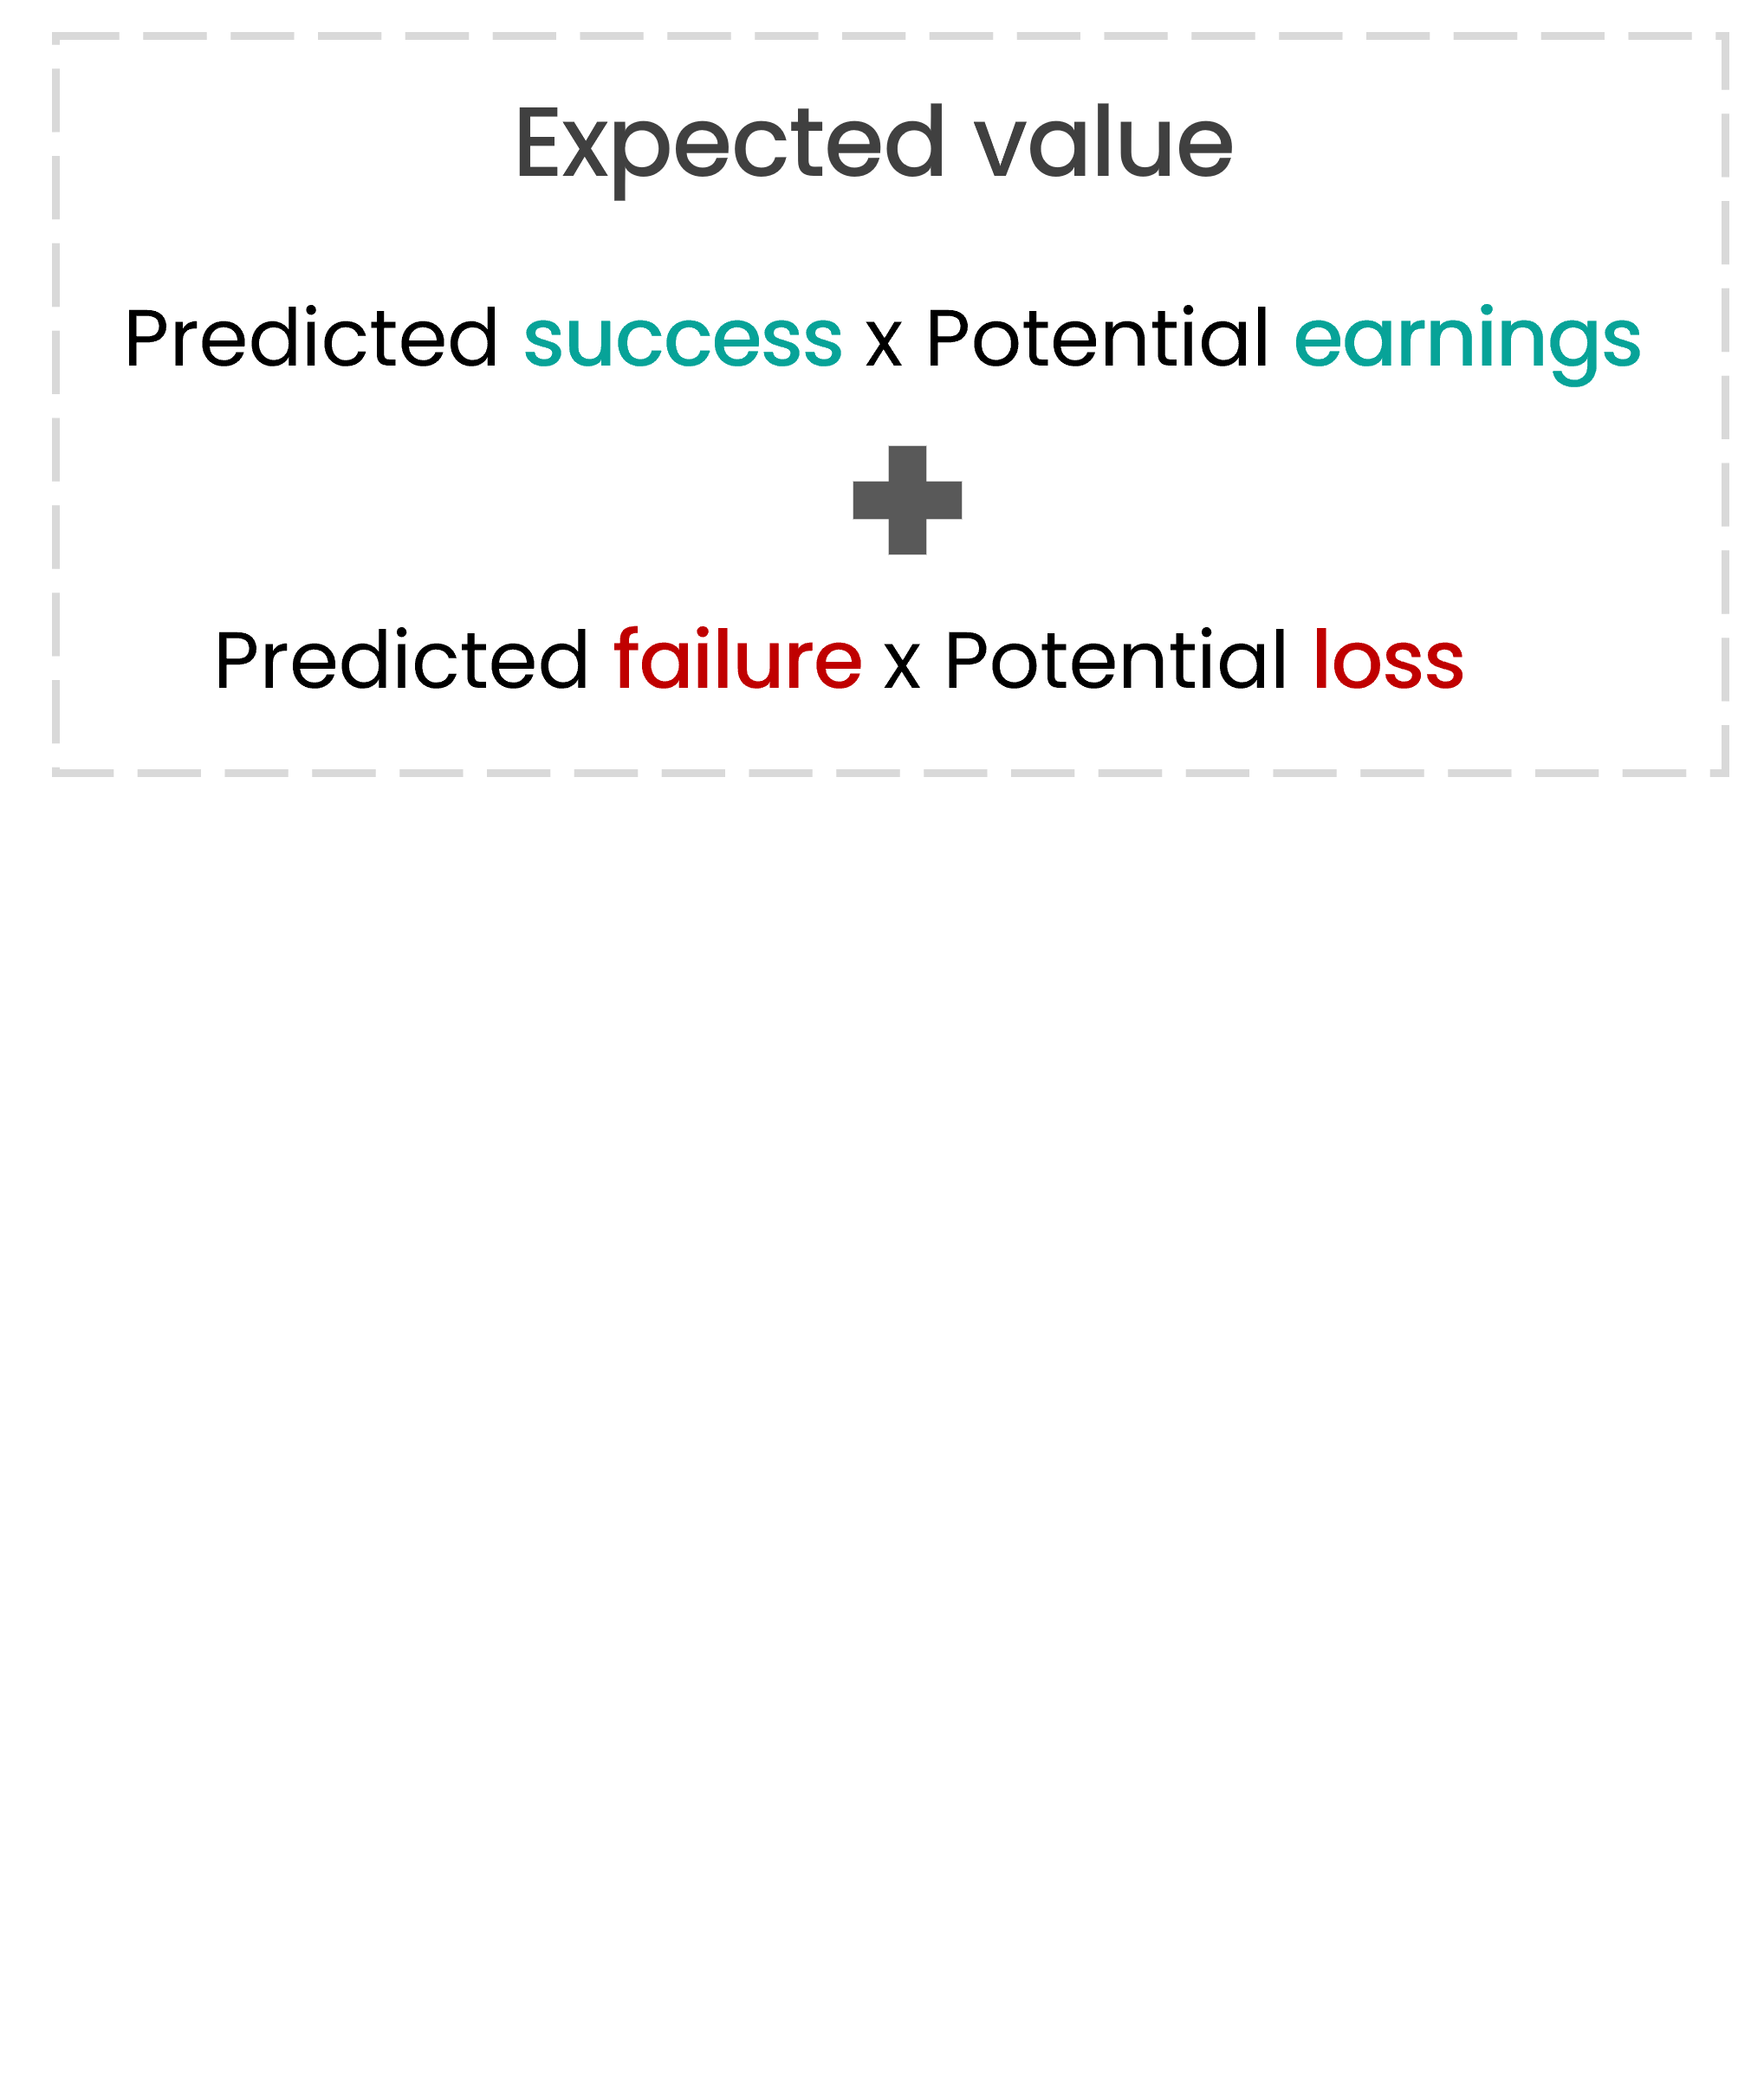
Evaluating expected value

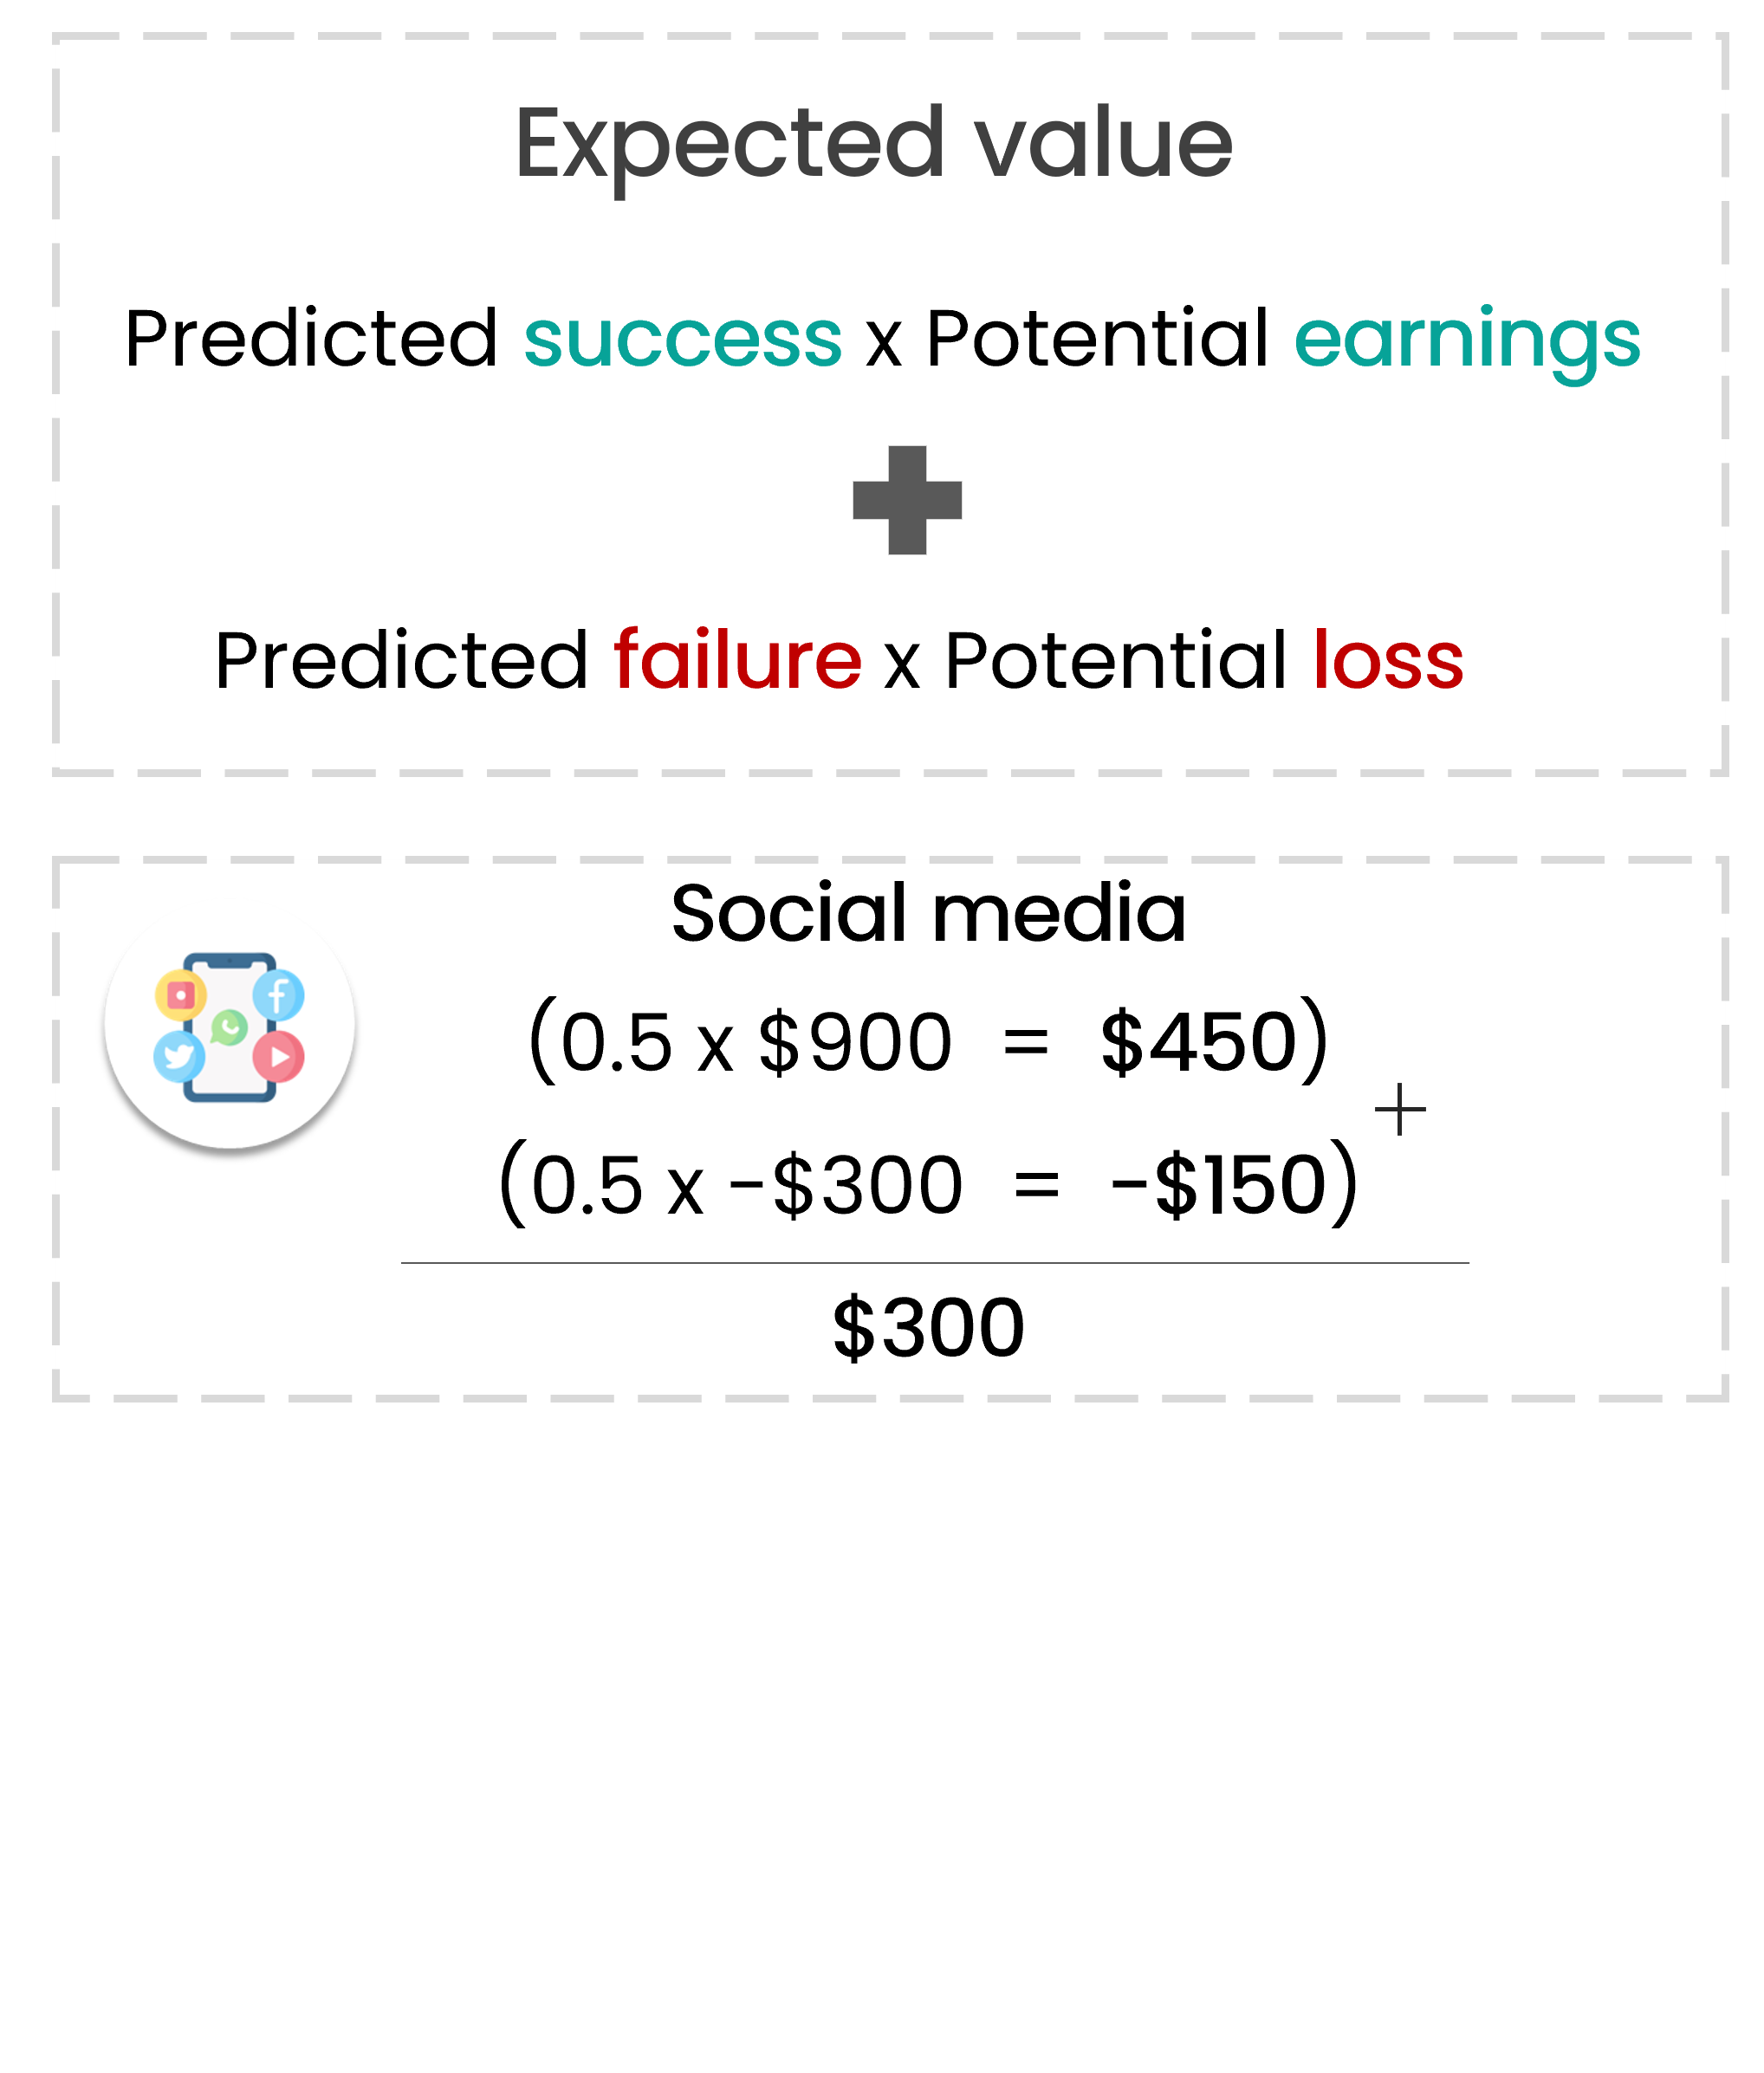
Evaluating expected value

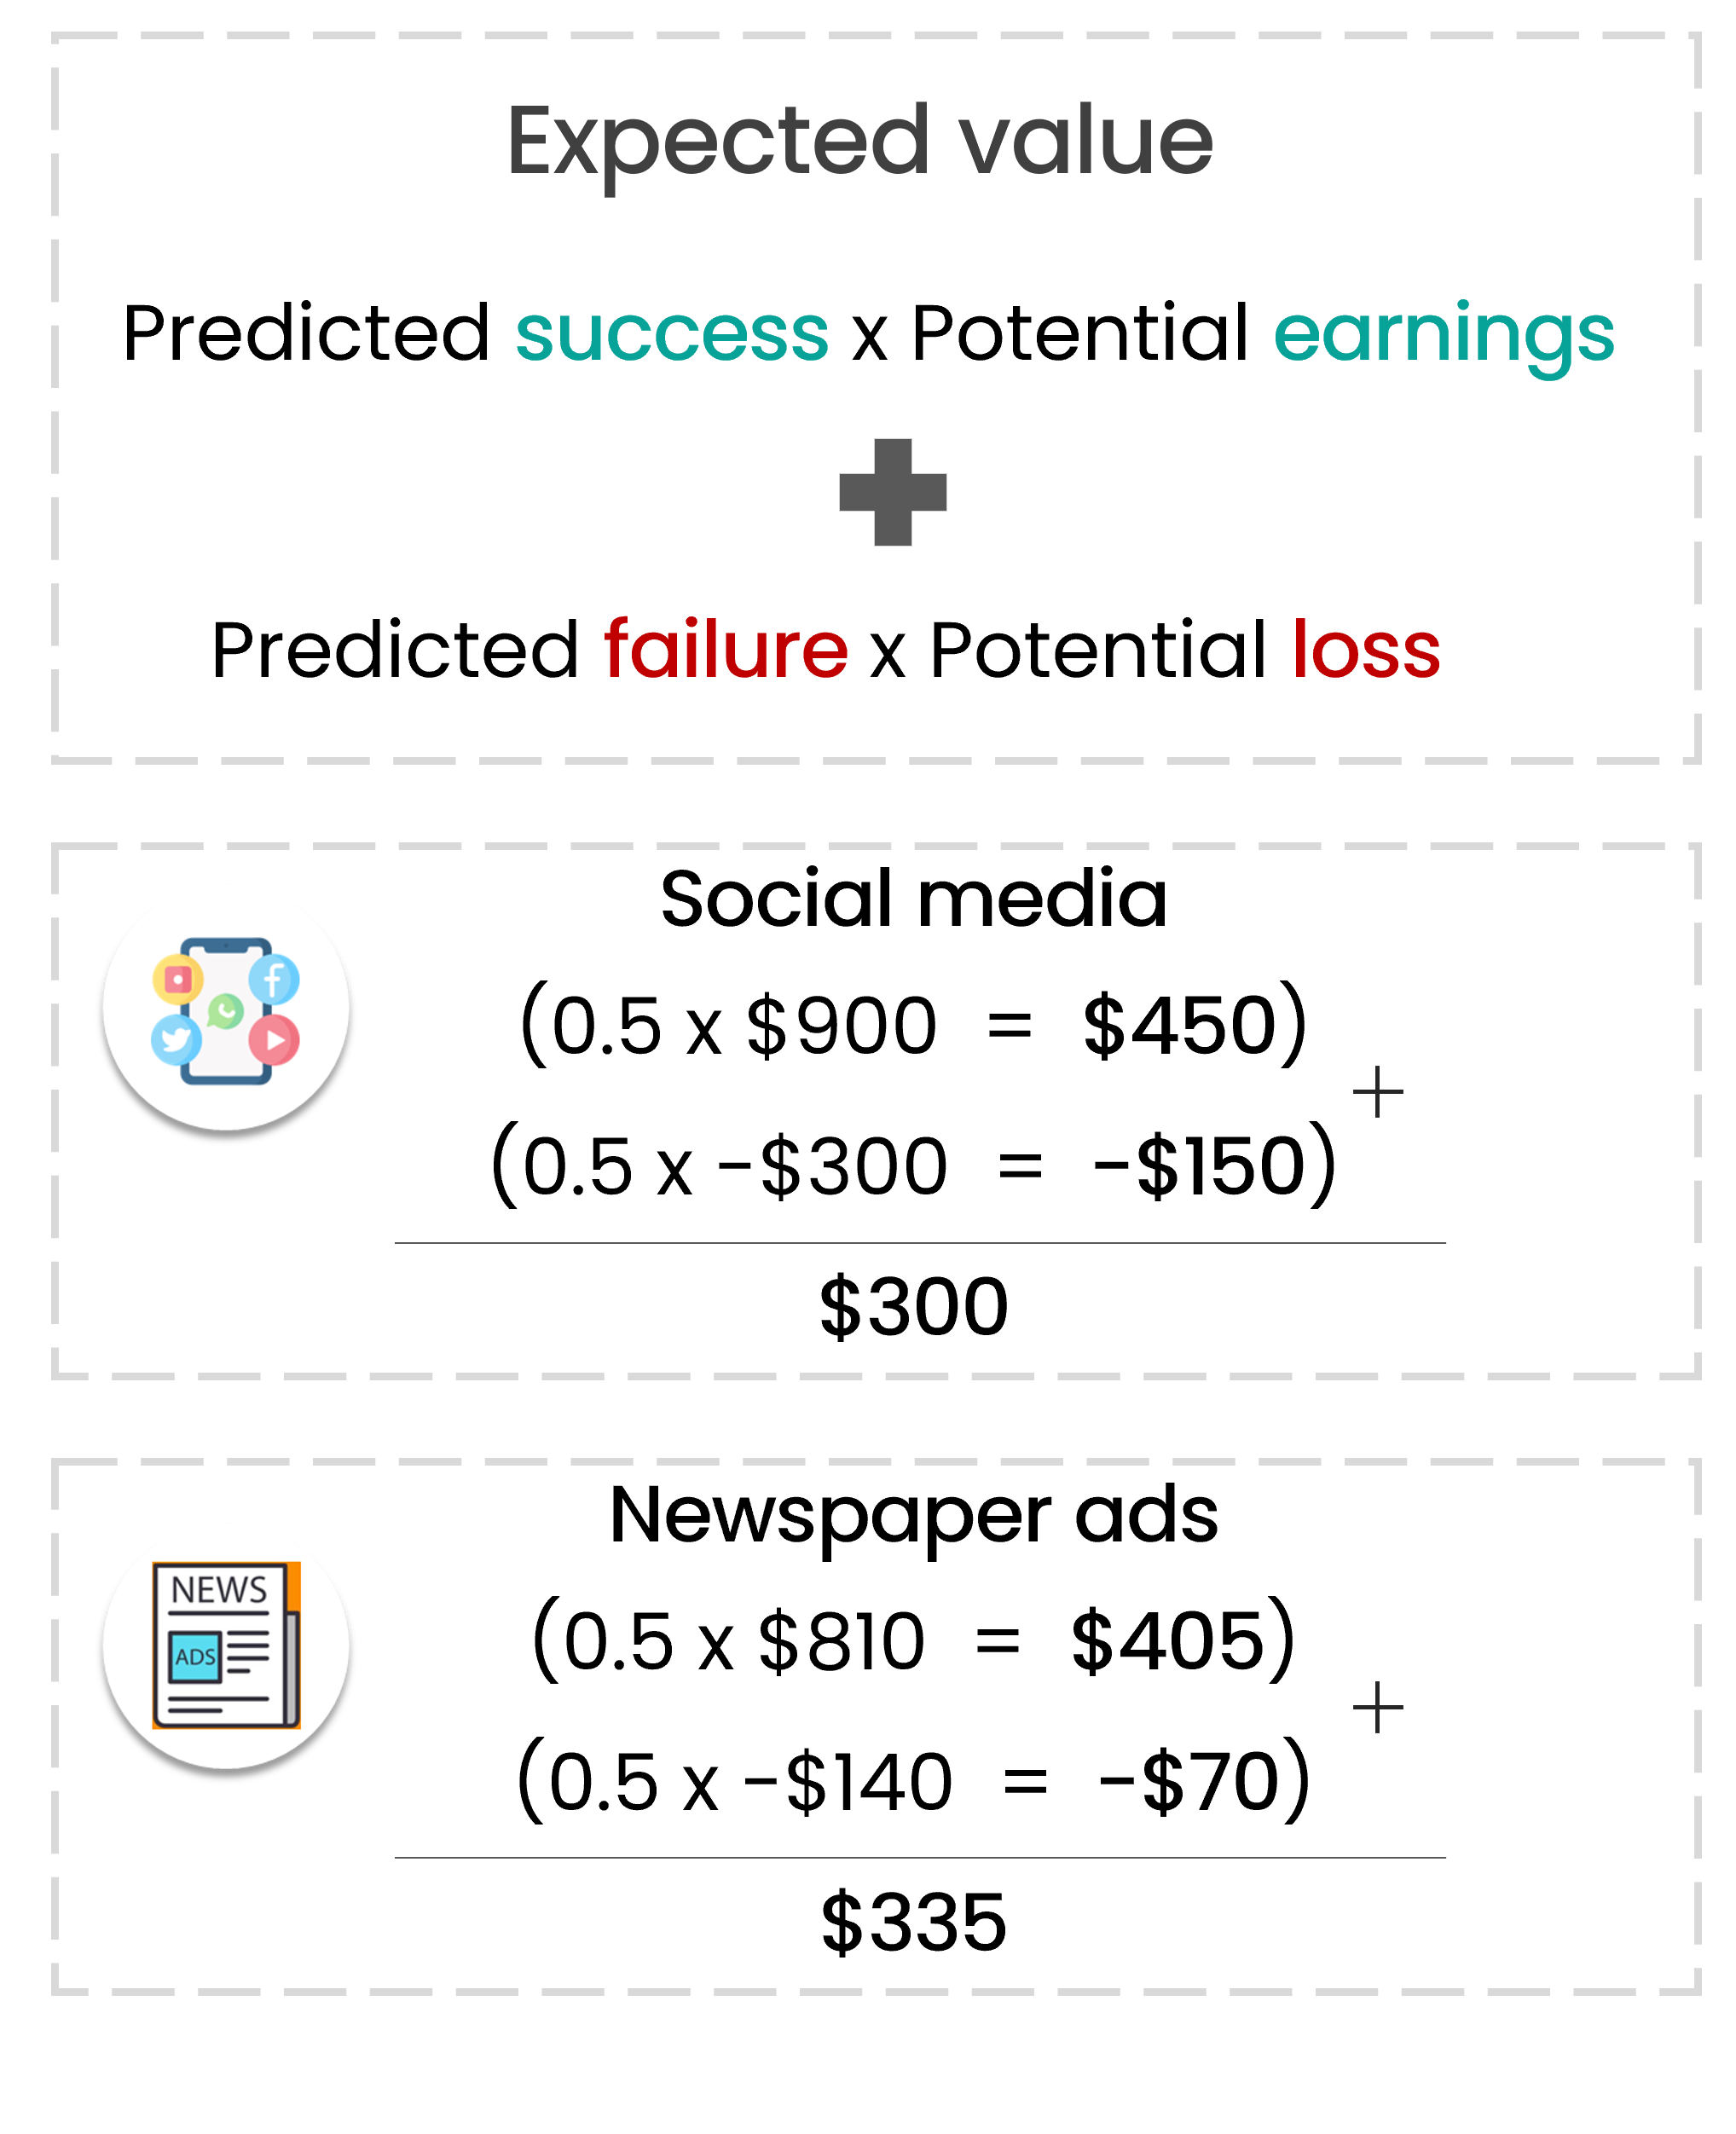
Evaluating expected value