Exploración inicial
Análisis exploratorio de datos en Python

Izzy Weber
Curriculum Manager, DataCamp
Análisis exploratorio de datos

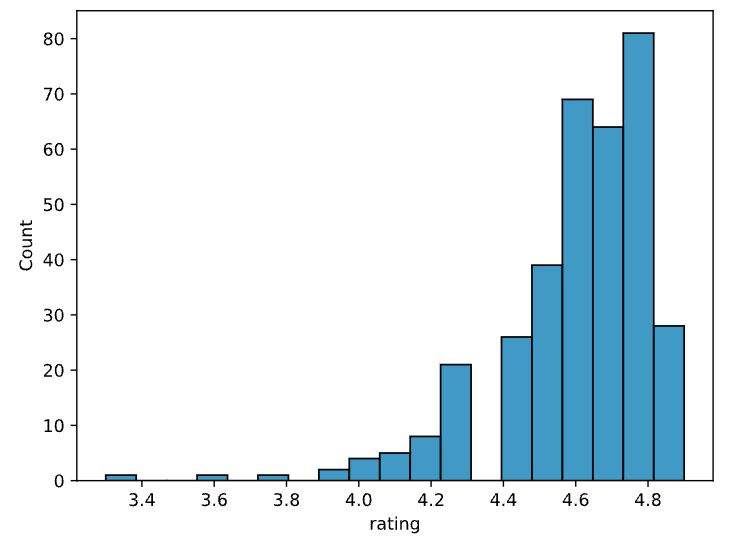
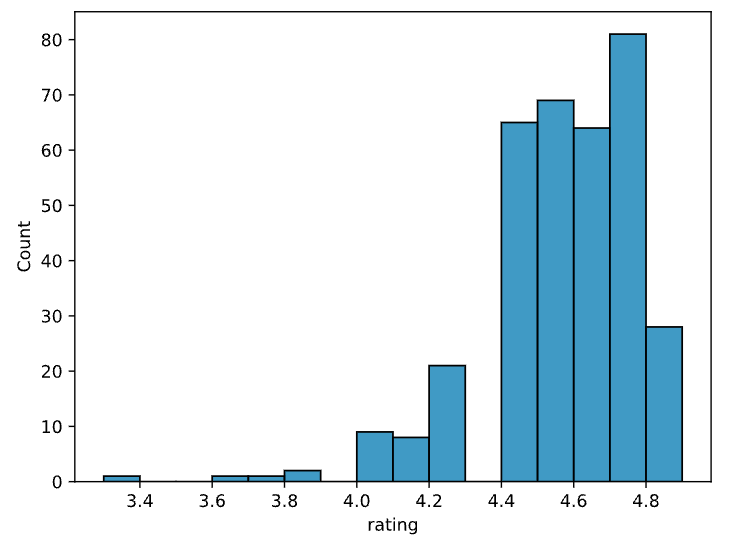
Visualización de datos numéricos
Análisis exploratorio de datos en Python
Izzy Weber
Curriculum Manager, DataCamp

