Relaciones y distribuciones de los factores
Análisis exploratorio de datos en Python

Izzy Weber
Curriculum Manager, DataCamp
Explorar las relaciones categóricas
sns.histplot(data=divorce, x="marriage_duration", binwidth=1)
plt.show()
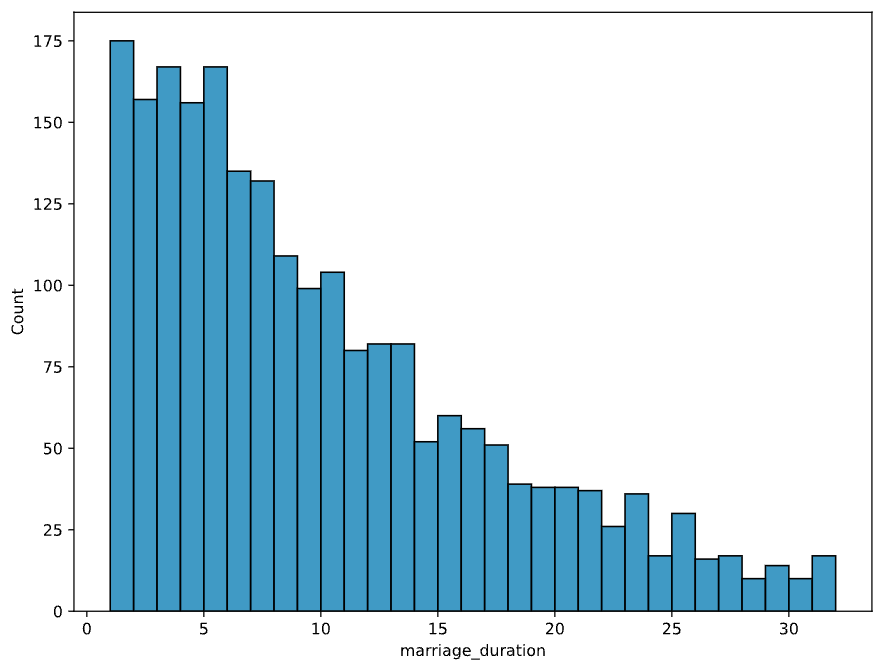
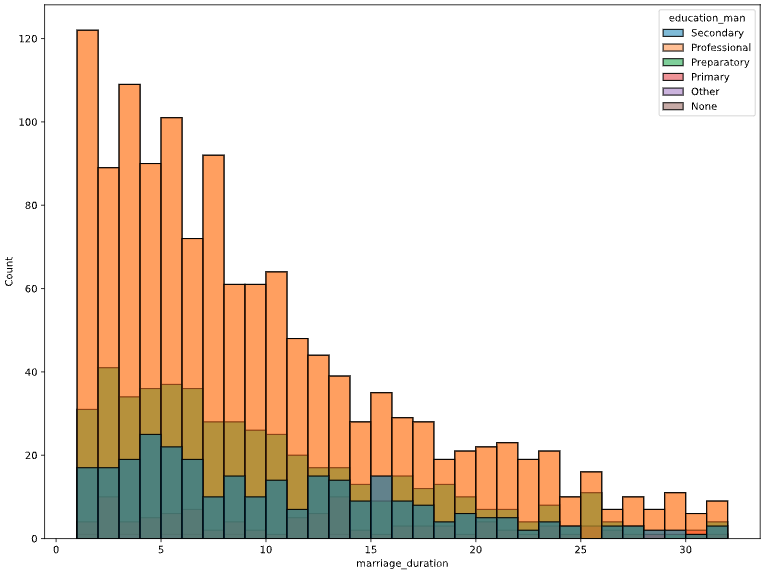
Explorar las relaciones categóricas
sns.histplot(data=divorce, x="marriage_duration", hue="education_man", binwidth=1)
plt.show()
Gráficos de estimación de densidad del kernel (KDE)
sns.kdeplot(data=divorce, x="marriage_duration", hue="education_man")
plt.show()
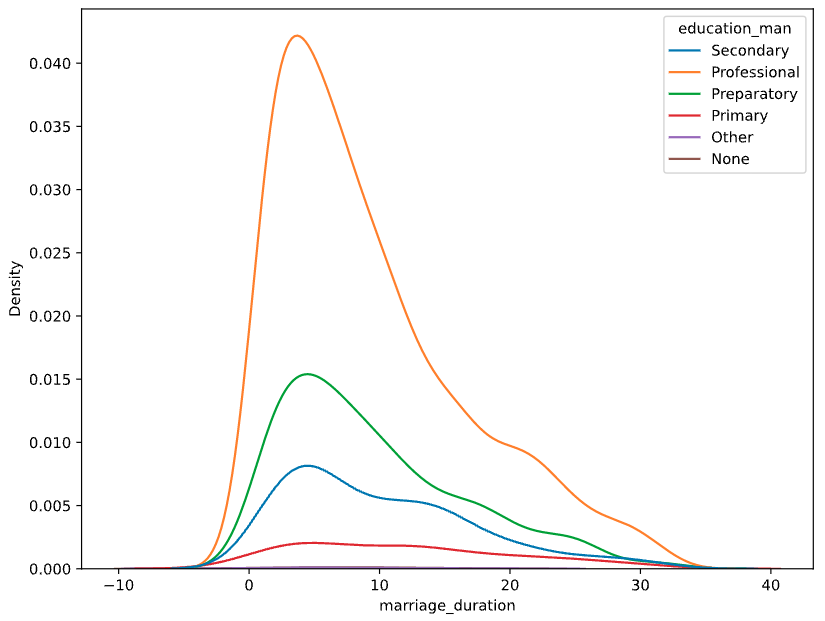
Gráficos de estimación de densidad del kernel (KDE)
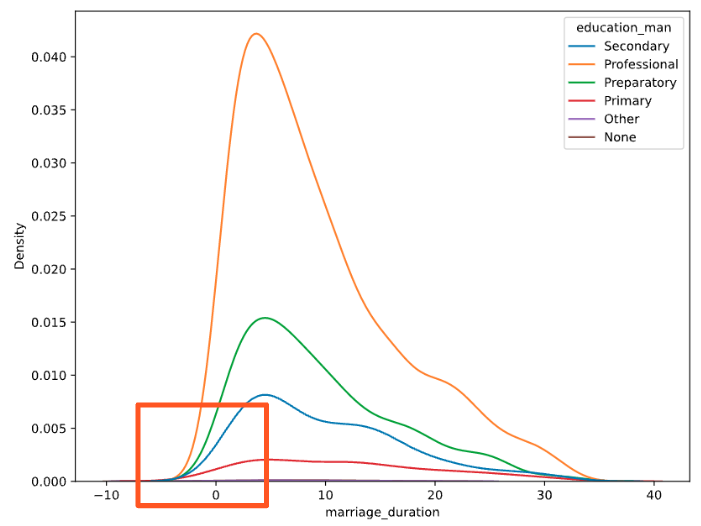
Gráficos de estimación de densidad del kernel (KDE)
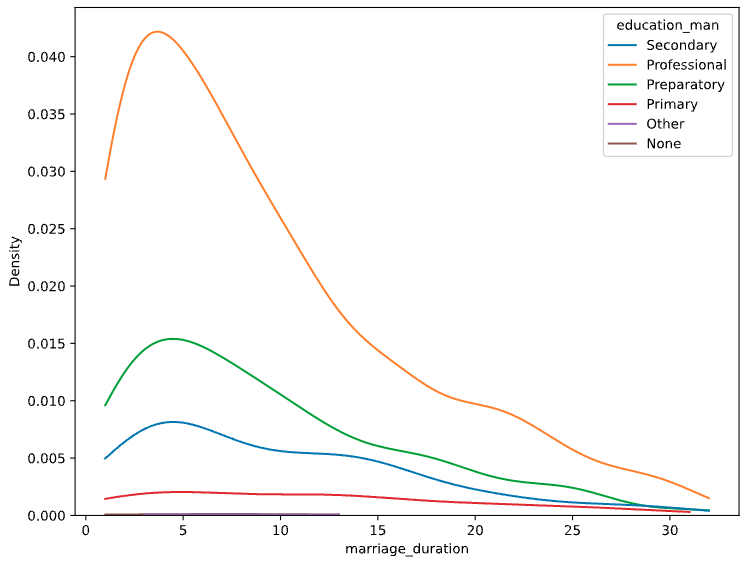
sns.kdeplot(data=divorce, x="marriage_duration", hue="education_man", cut=0)
plt.show()
Gráficos KDE acumulativos
sns.kdeplot(data=divorce, x="marriage_duration", hue="education_man", cut=0, cumulative=True)
plt.show()
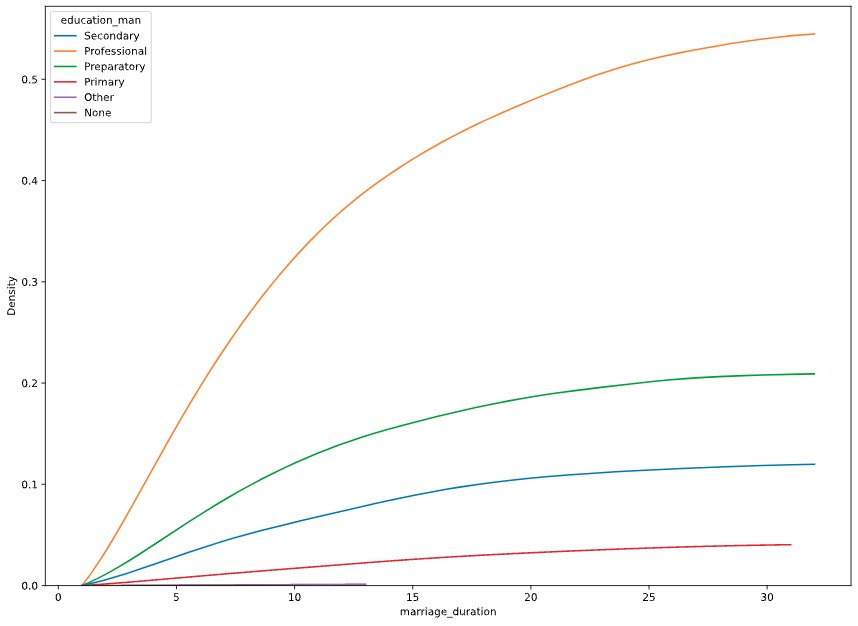
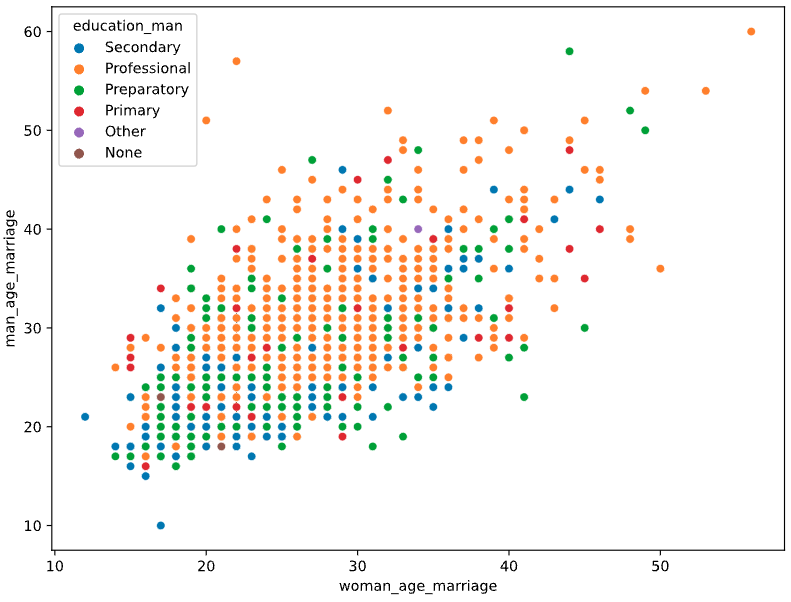
Diagrama de dispersión con variables categóricas
sns.scatterplot(data=divorce, x="woman_age_marriage", y="man_age_marriage")
plt.show()
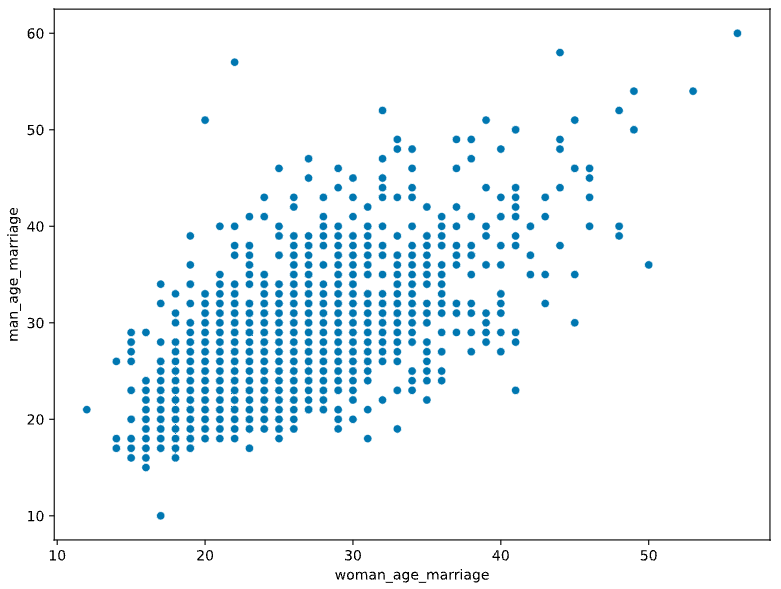
Diagrama de dispersión con variables categóricas