Generar nuevos features
Análisis exploratorio de datos en Python

George Boorman
Curriculum Manager, DataCamp
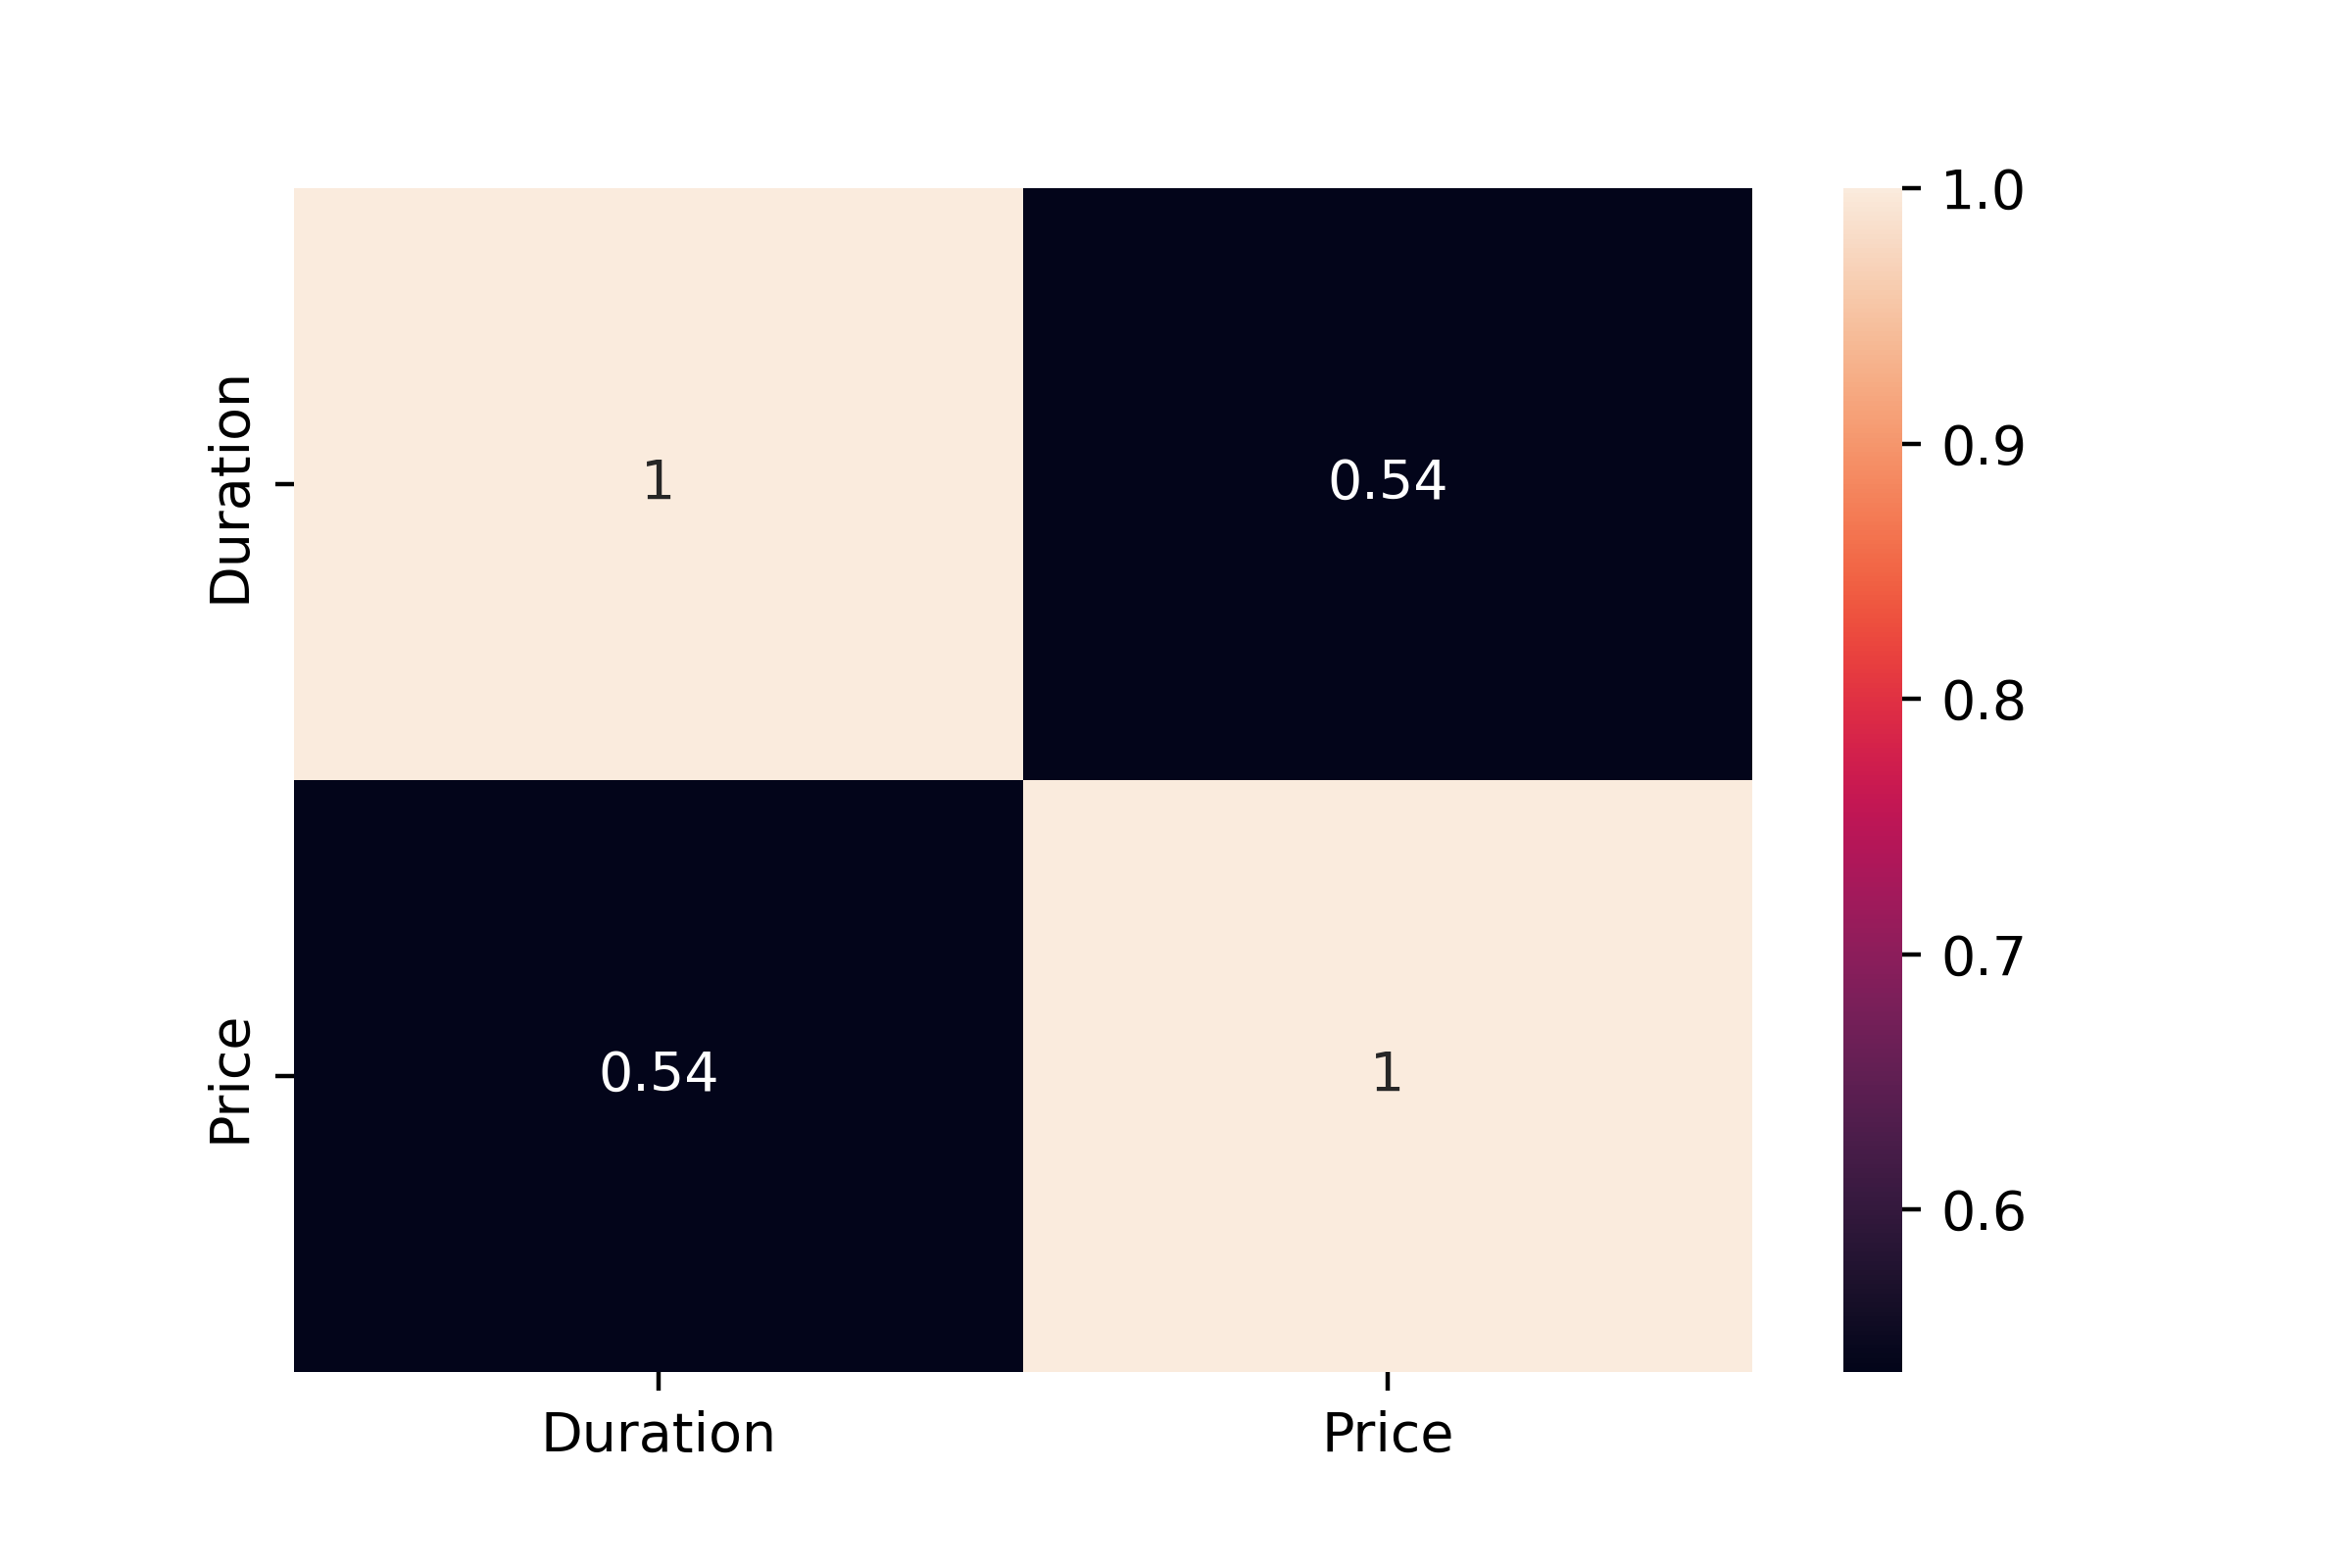
Correlación
sns.heatmap(planes.corr(numeric_only=True), annot=True)
plt.show()
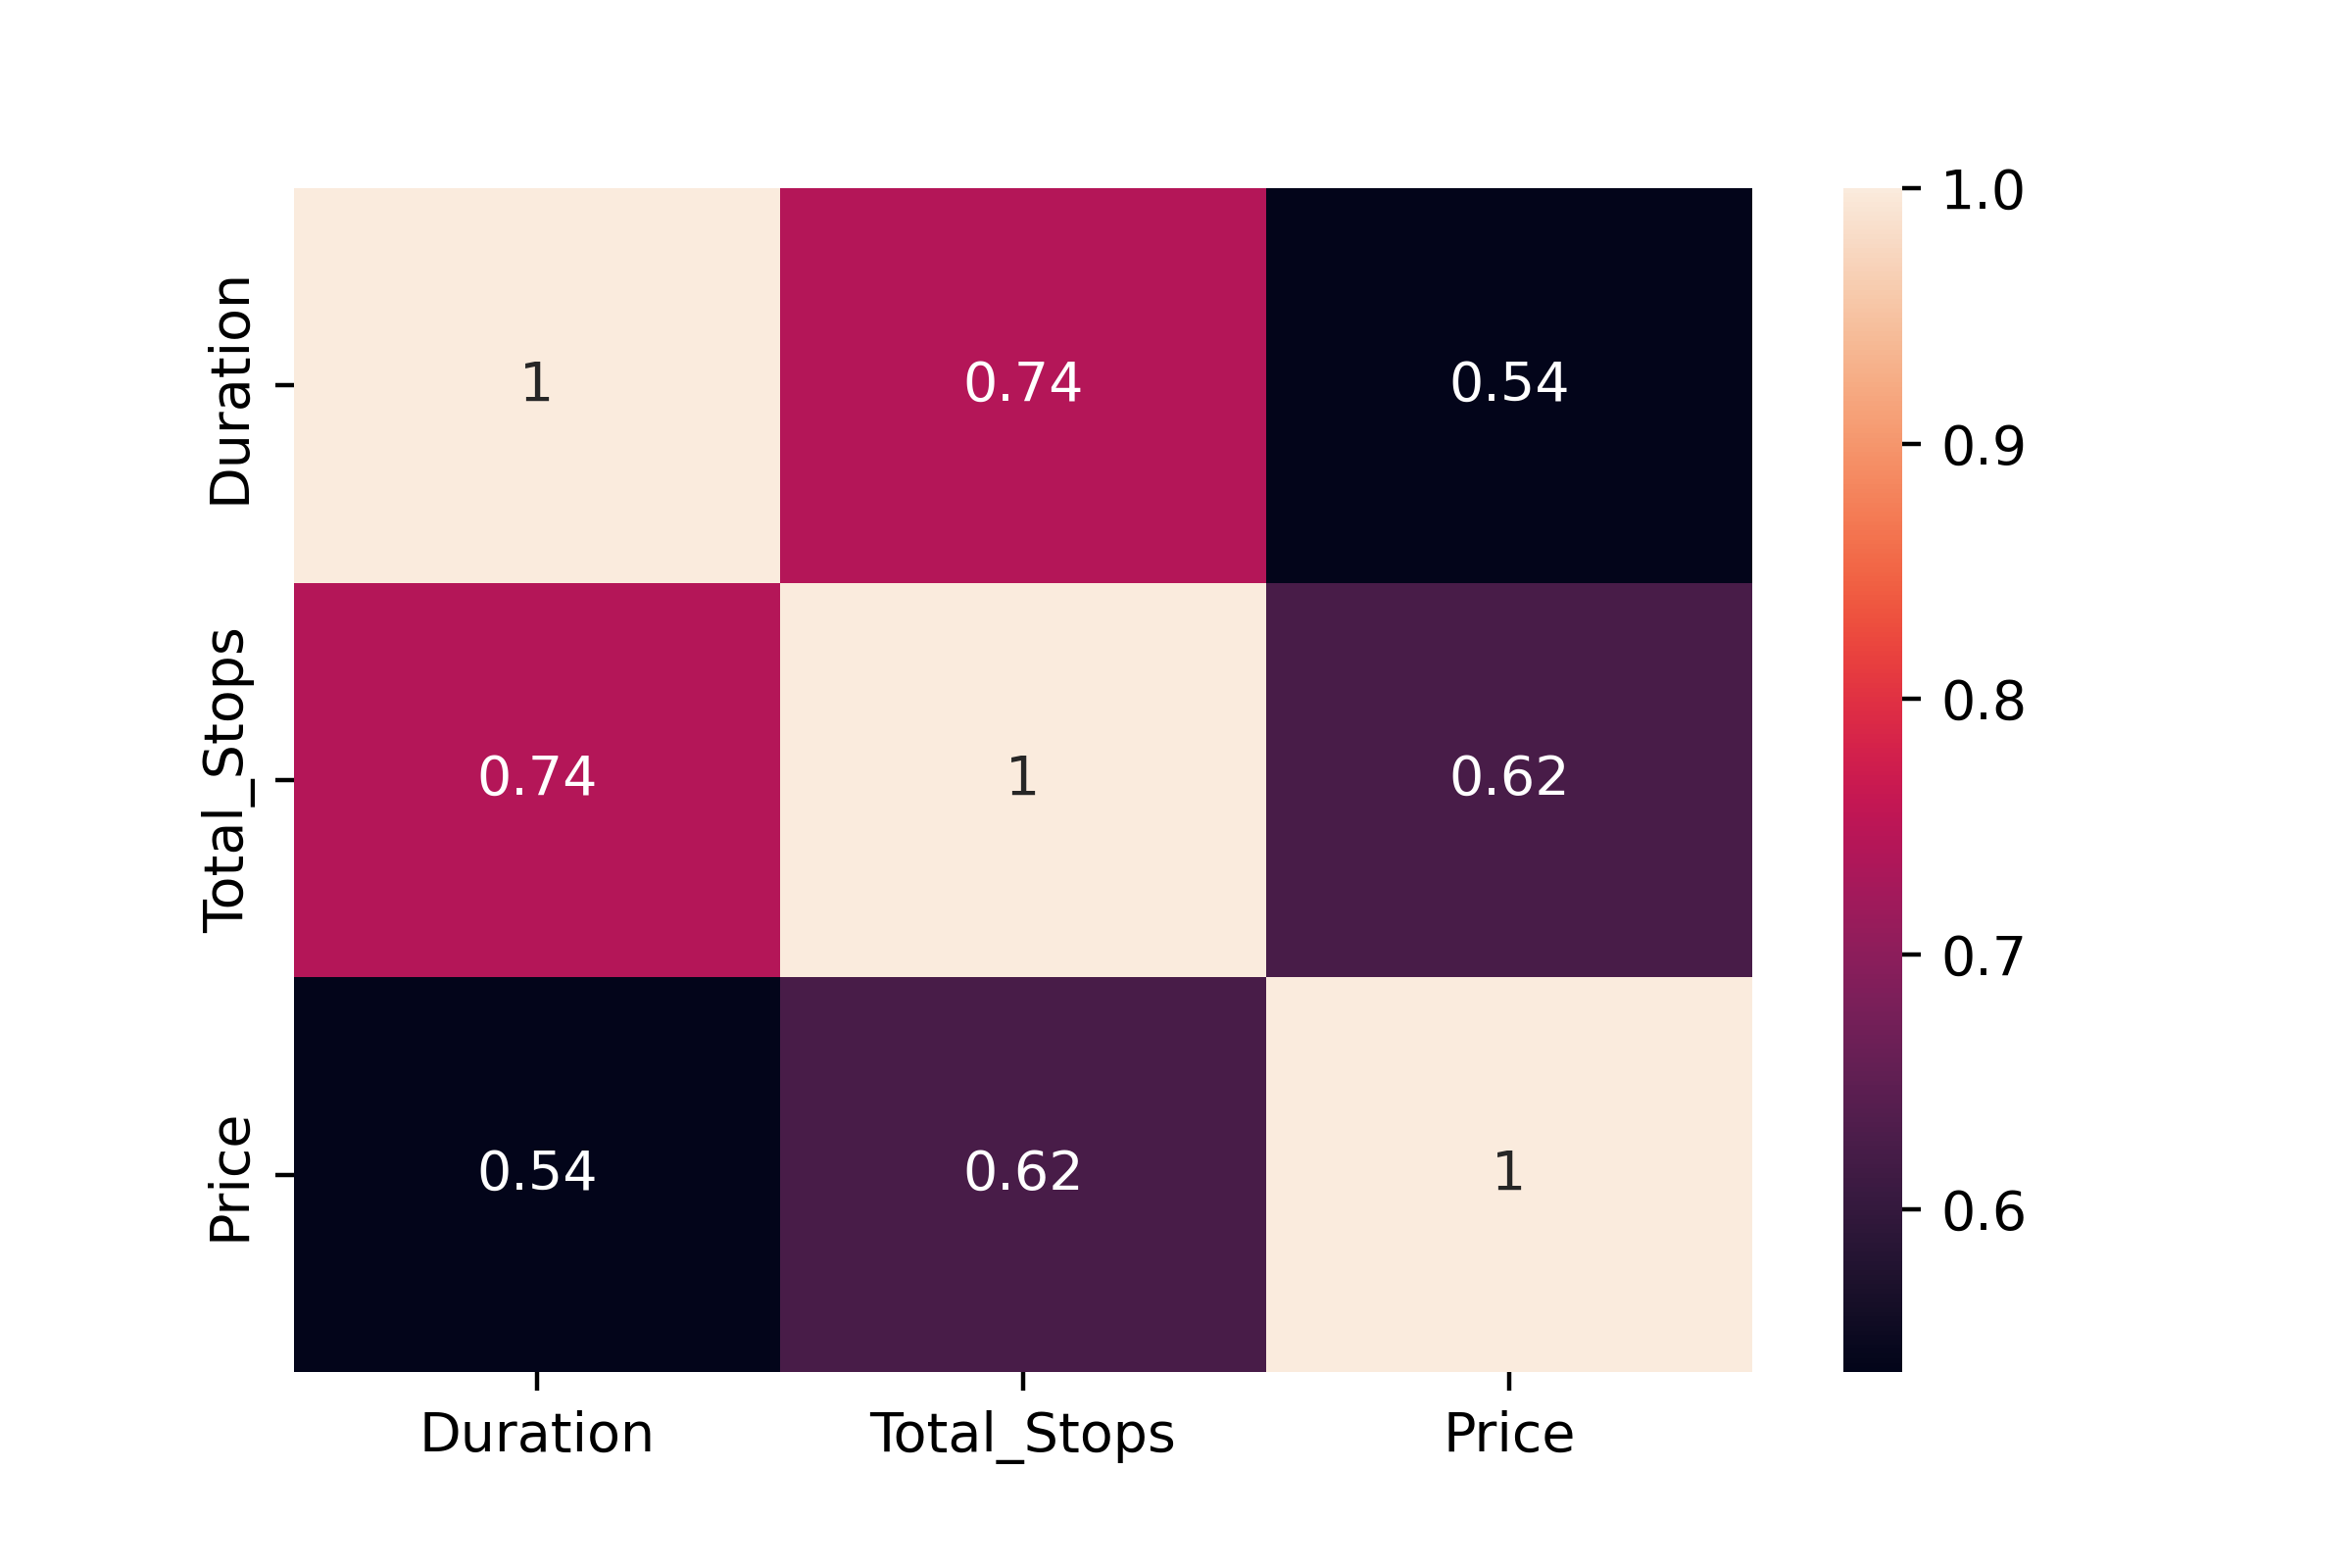
Correlación
sns.heatmap(planes.corr(numeric_only=True), annot=True)
plt.show()
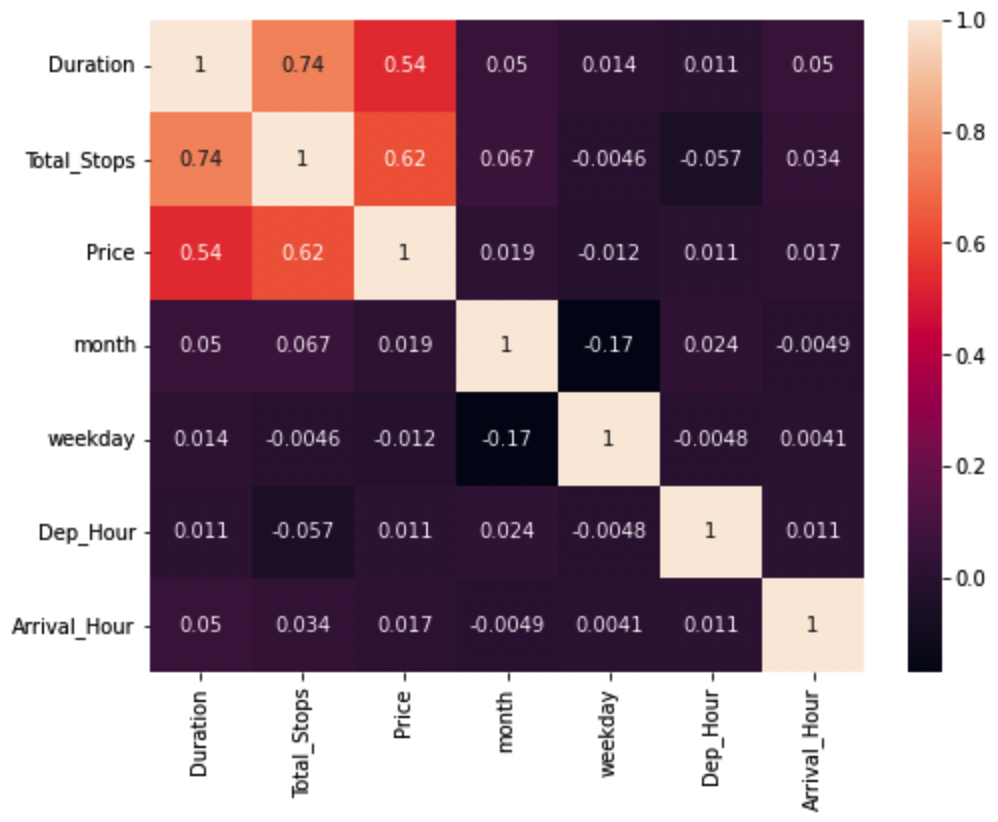
Correlación
pd.cut()
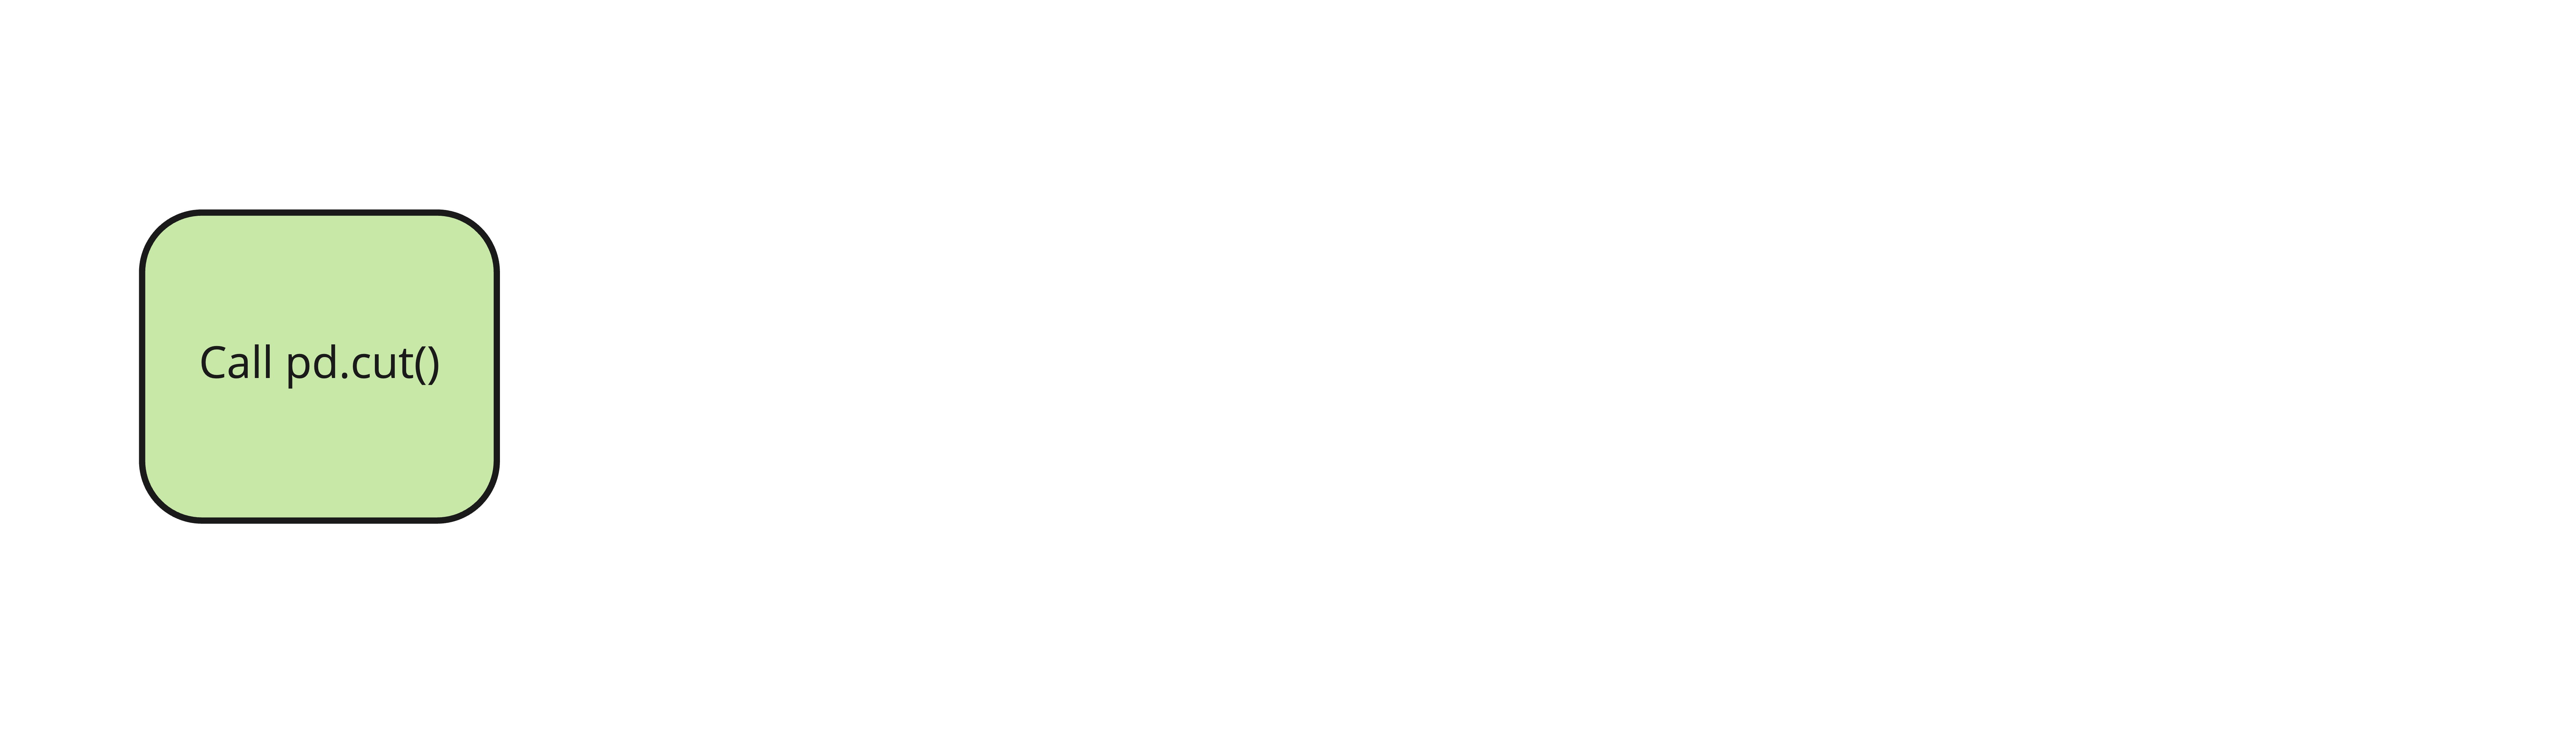
planes["Price_Category"] = pd.cut(
pd.cut()
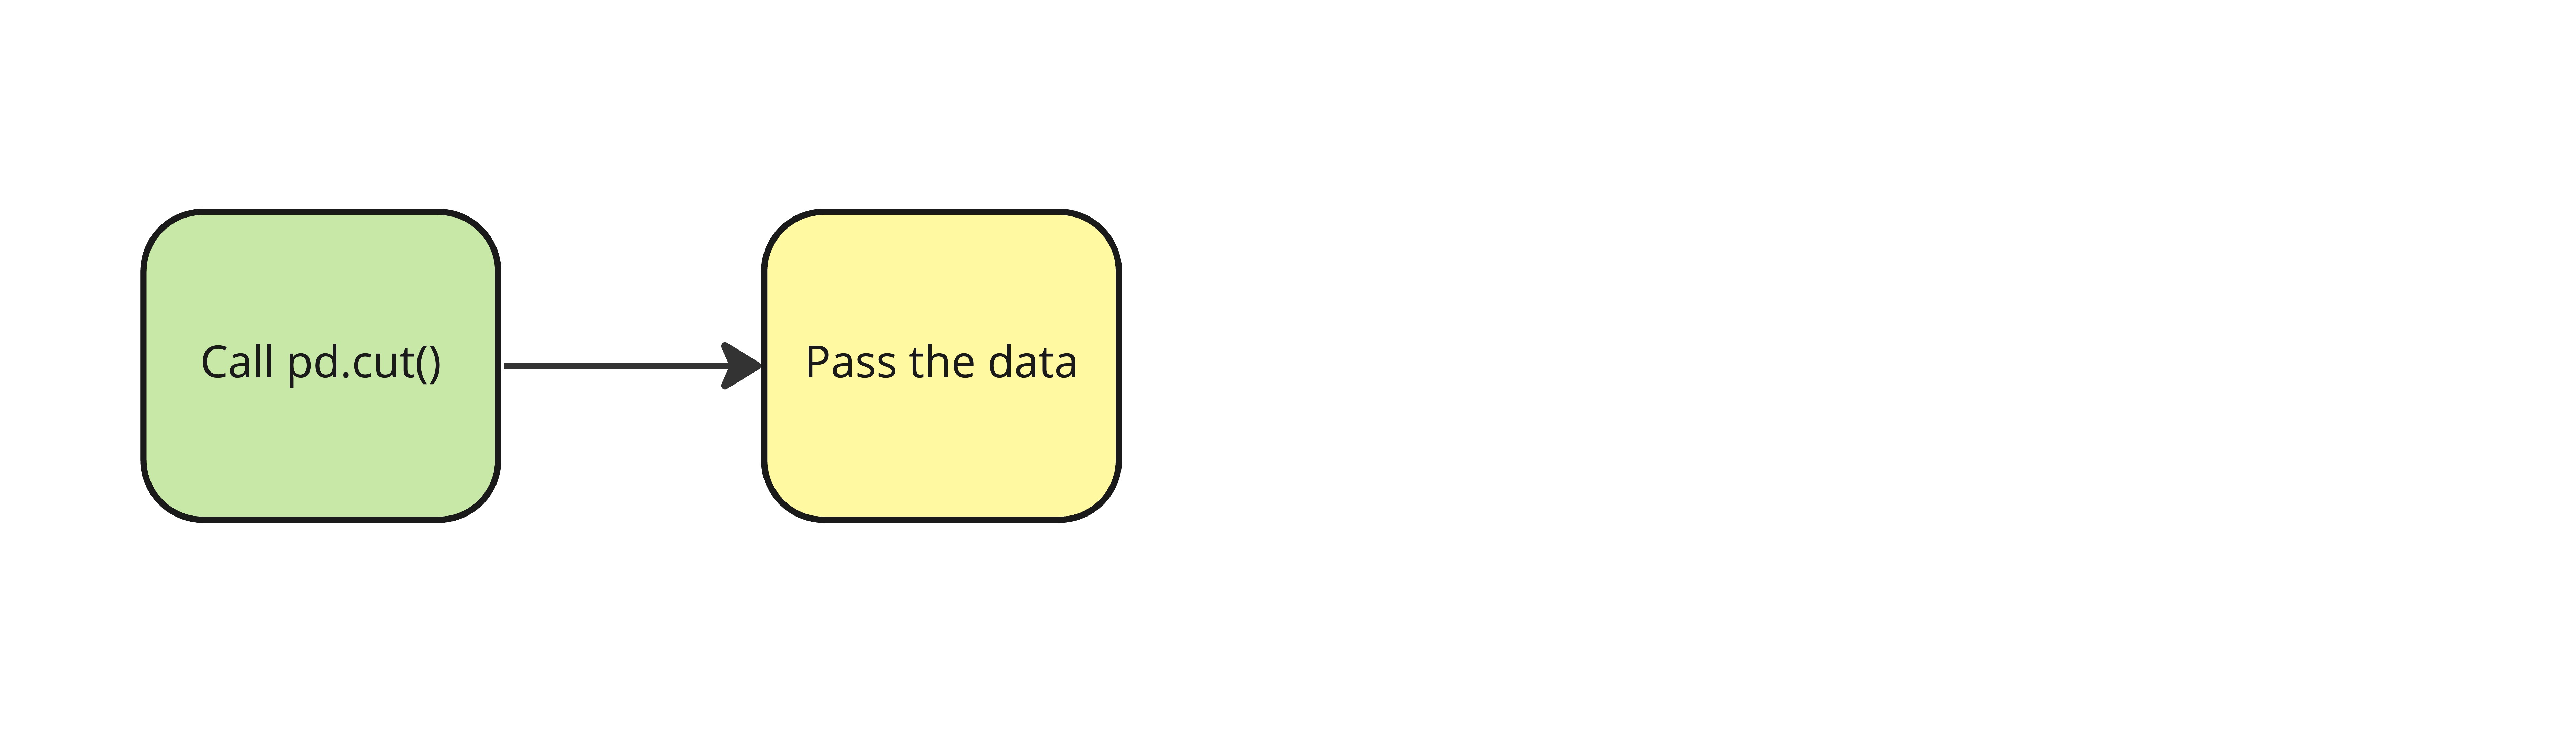
planes["Price_Category"] = pd.cut(planes["Price"],
pd.cut()
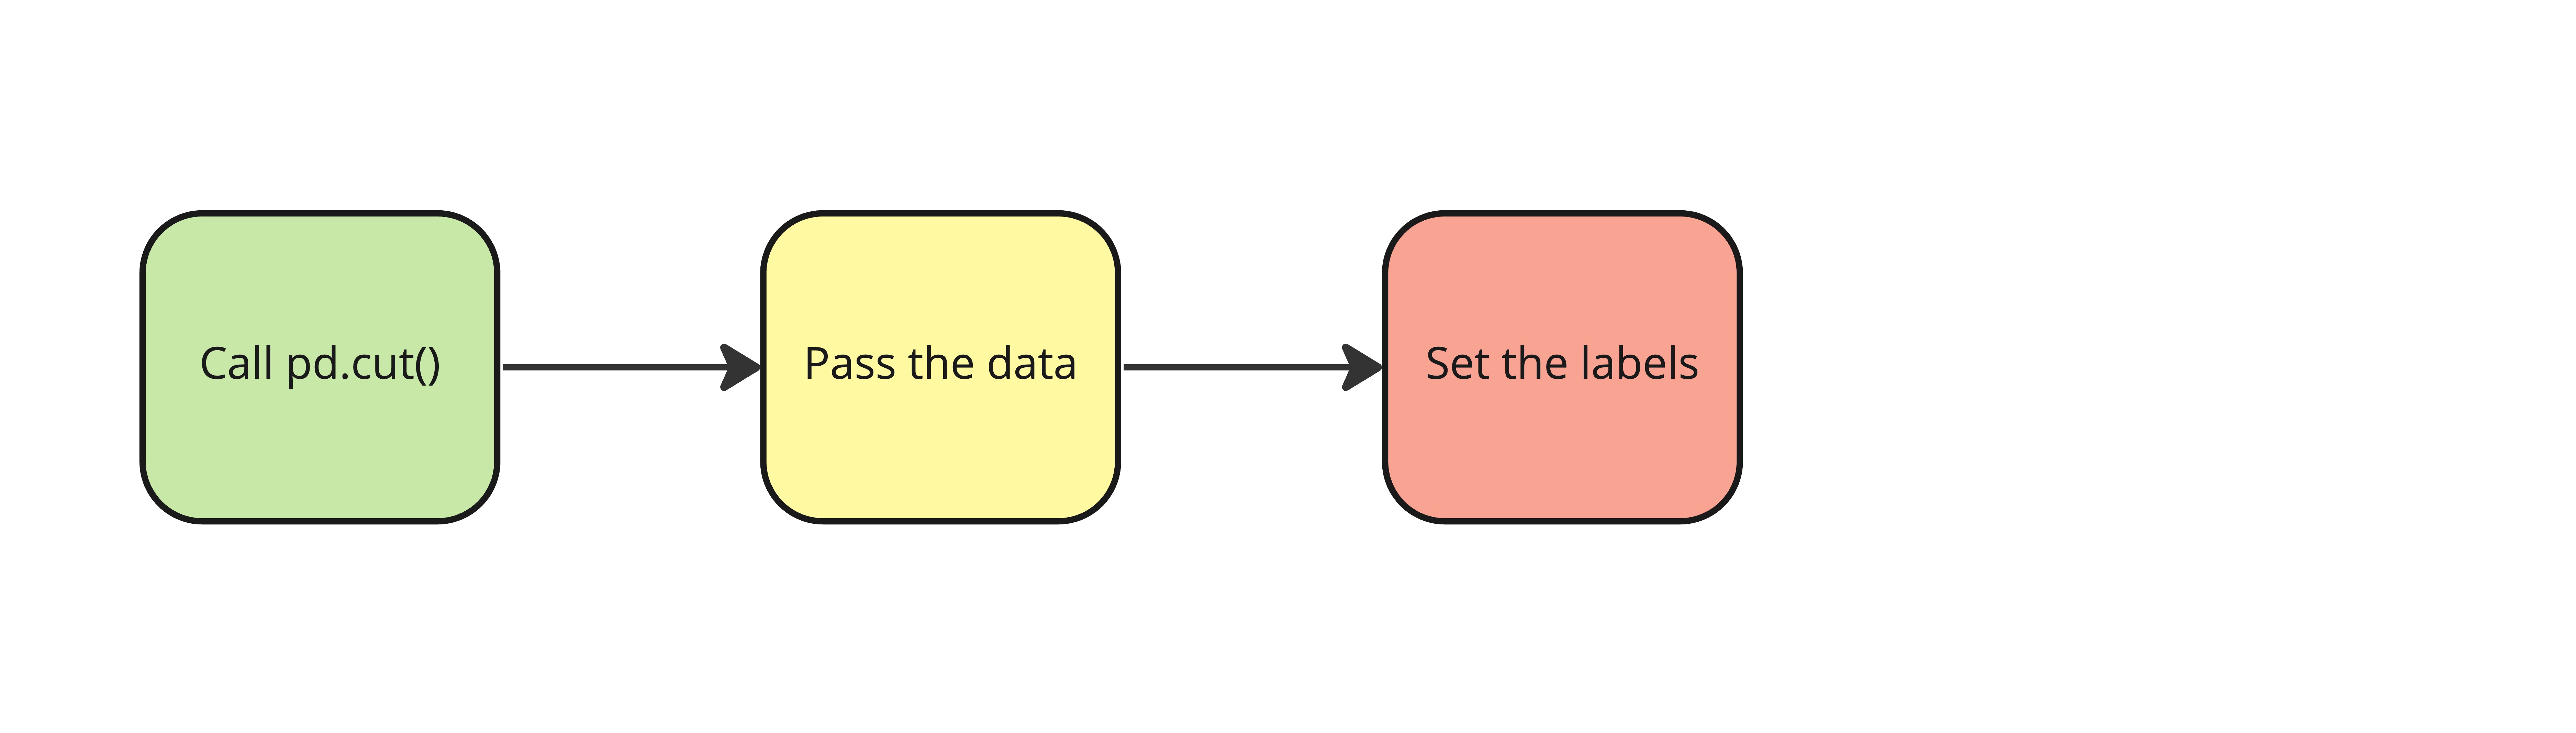
planes["Price_Category"] = pd.cut(planes["Price"],
                                  labels=labels,
pd.cut()
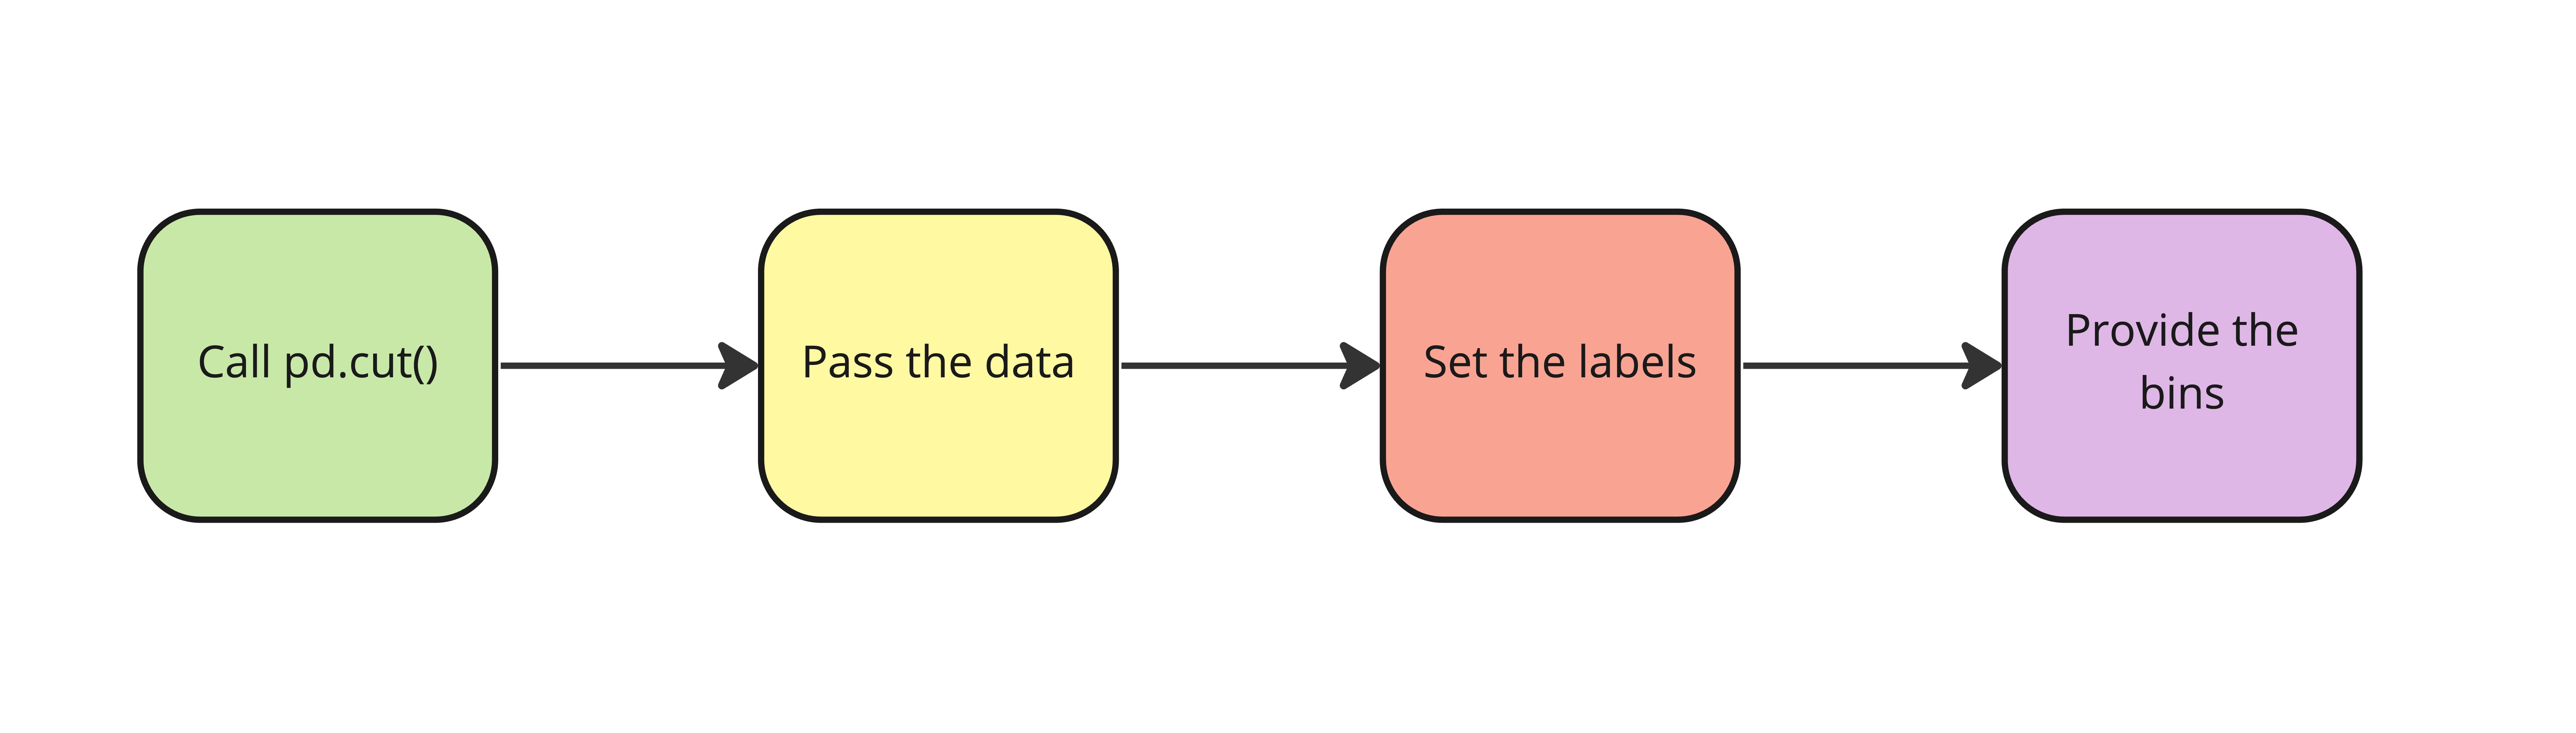
planes["Price_Category"] = pd.cut(planes["Price"],
                                  labels=labels,
                                  bins=bins)
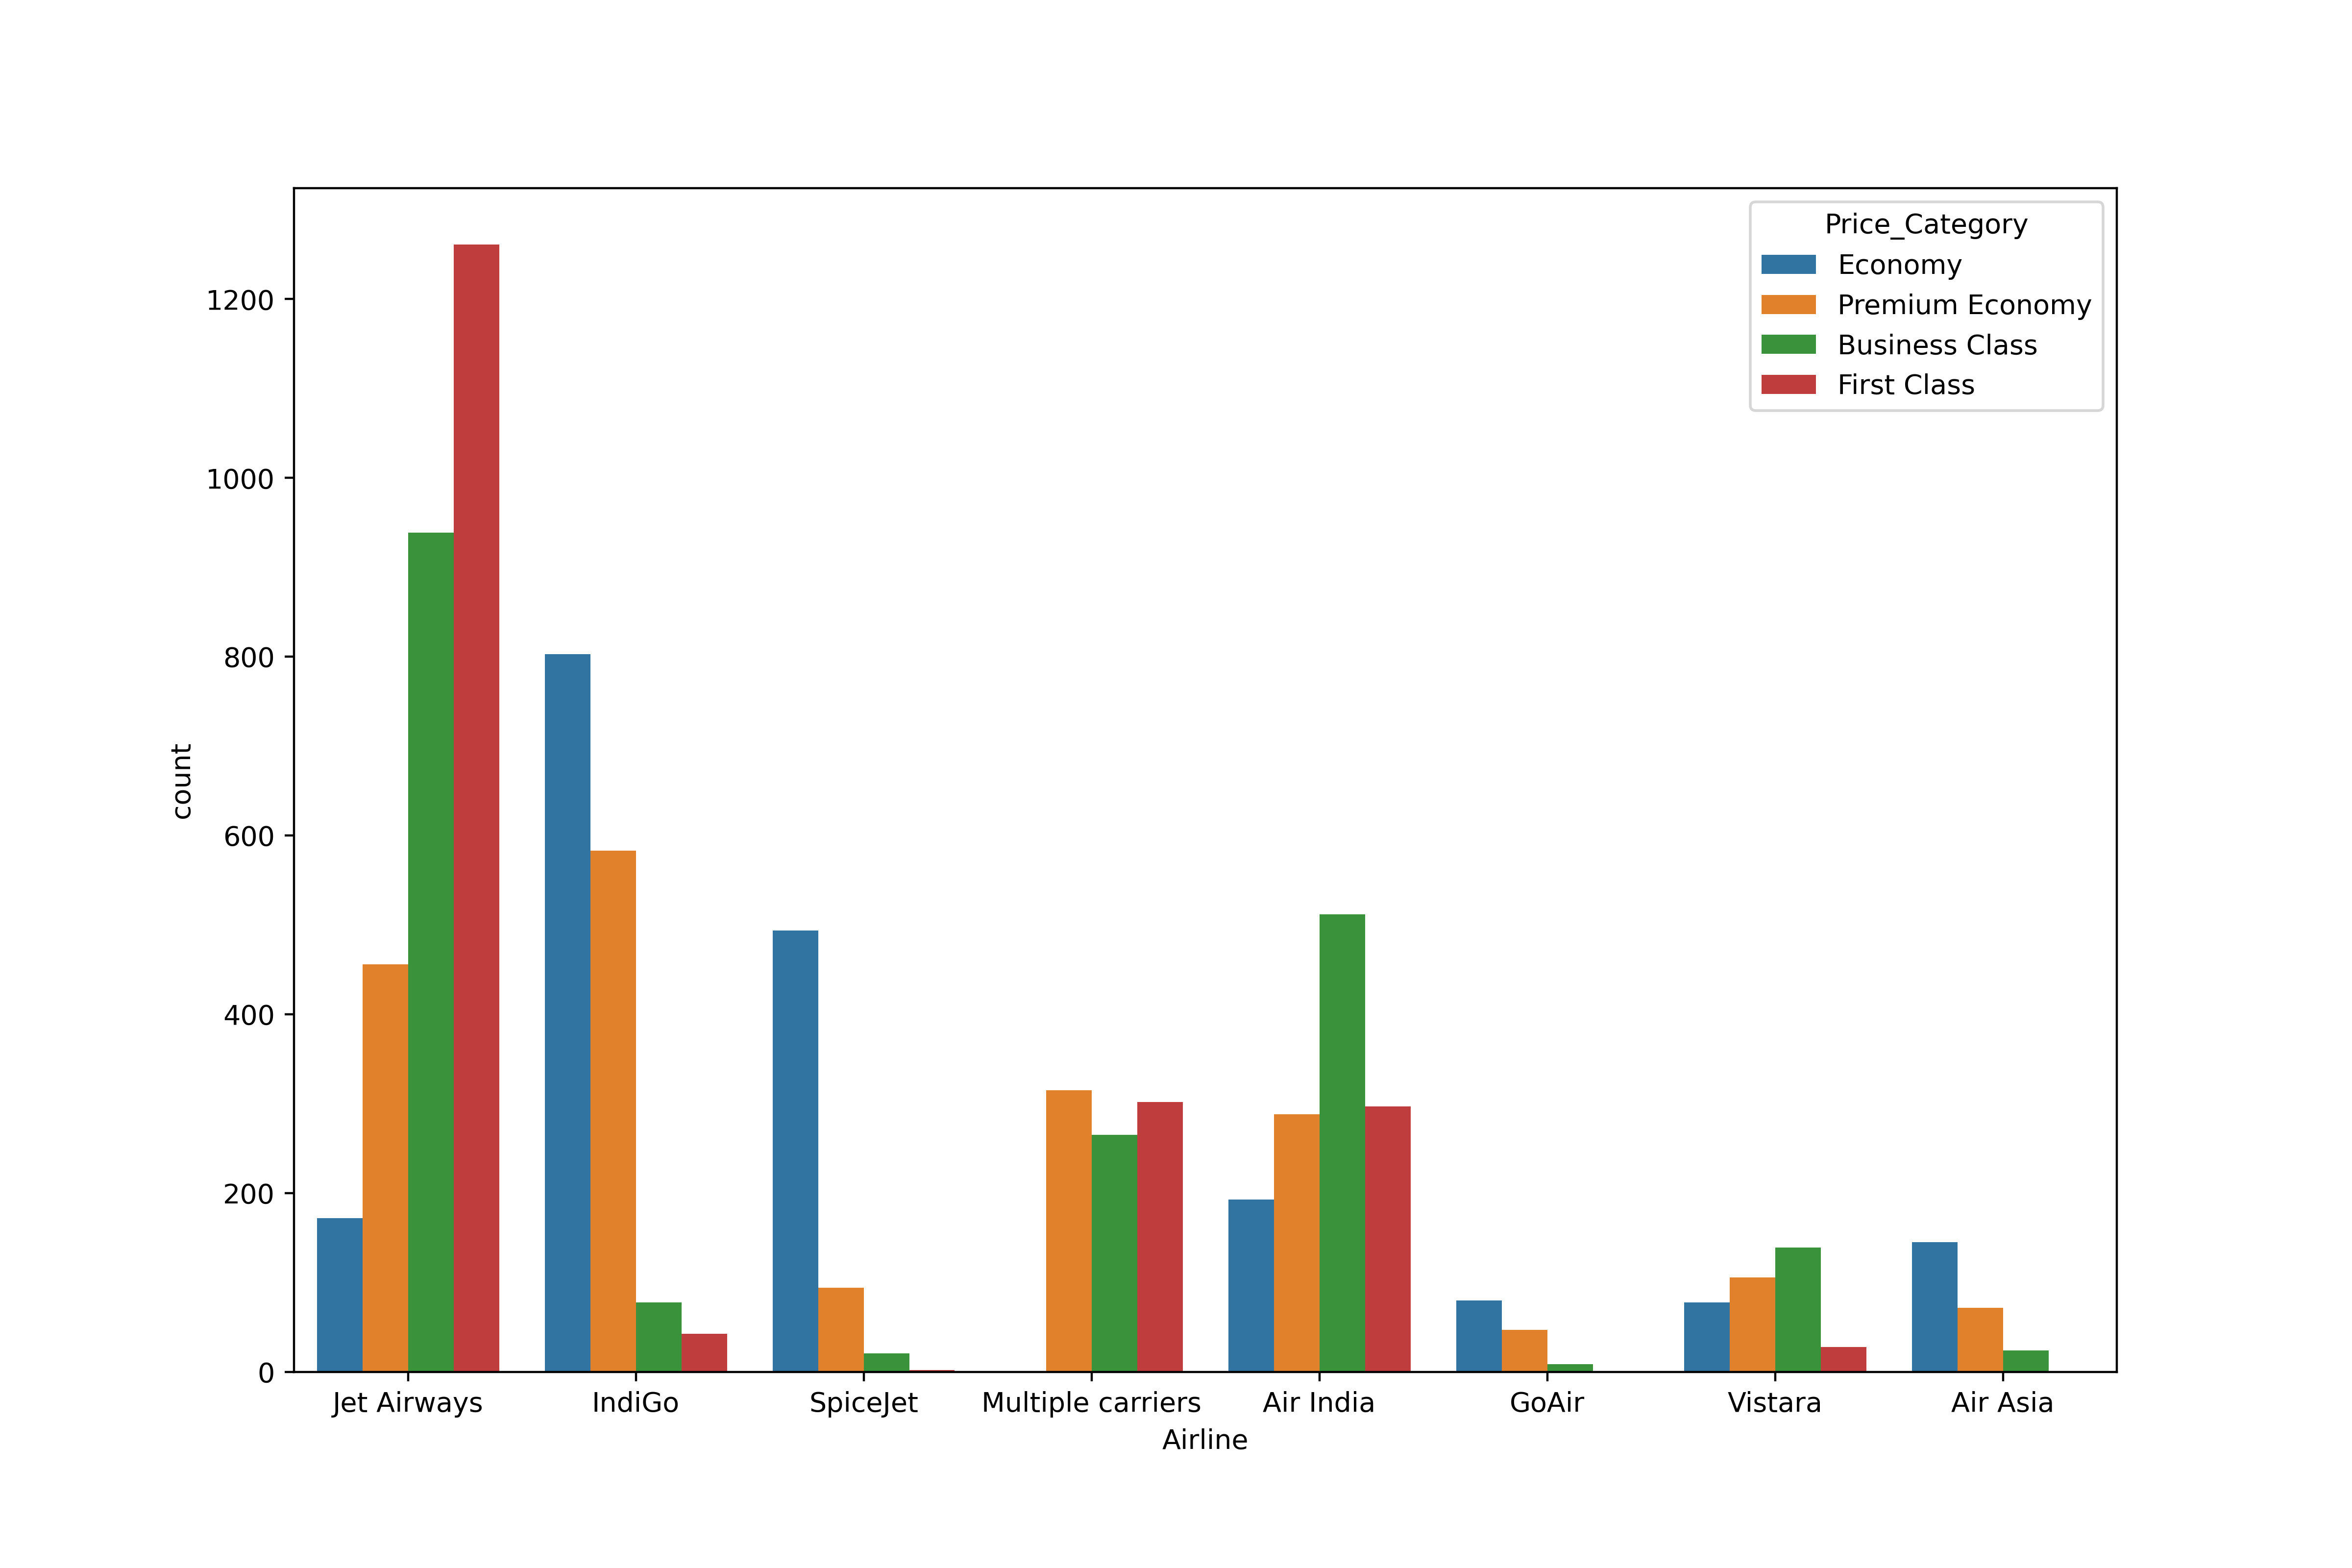
Categoría de precios por aerolínea