Generar hipótesis
Análisis exploratorio de datos en Python

George Boorman
Curriculum Manager, DataCamp
¿Qué sabemos?
¿Qué sabemos?
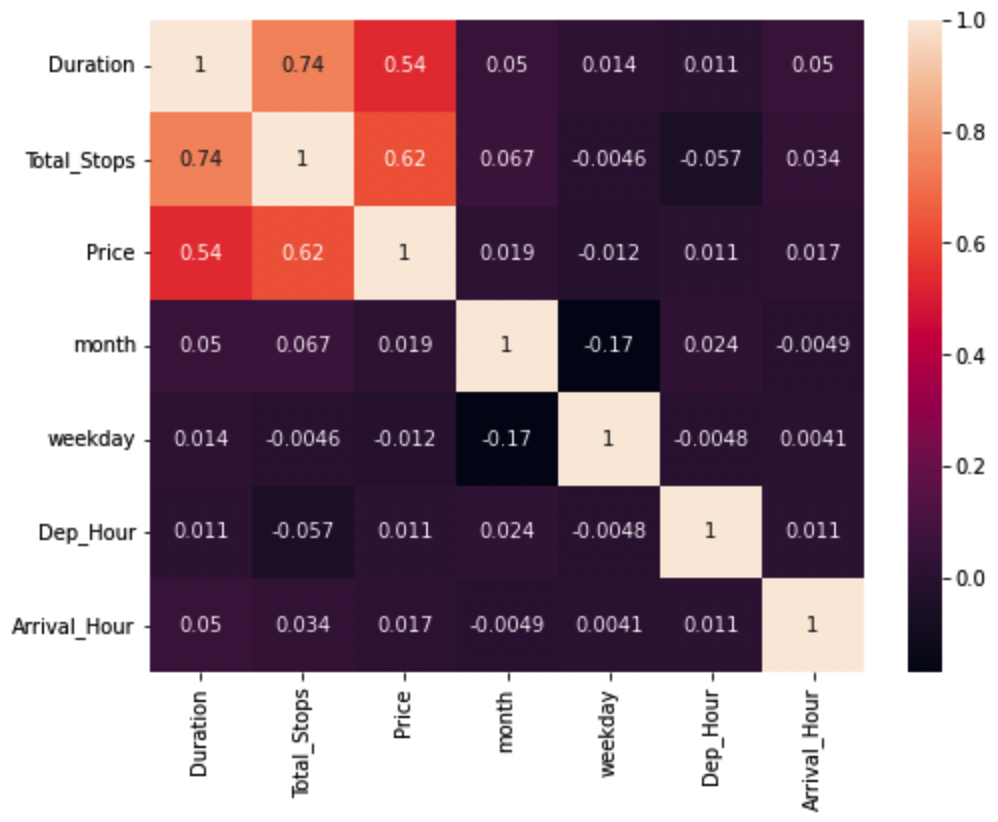
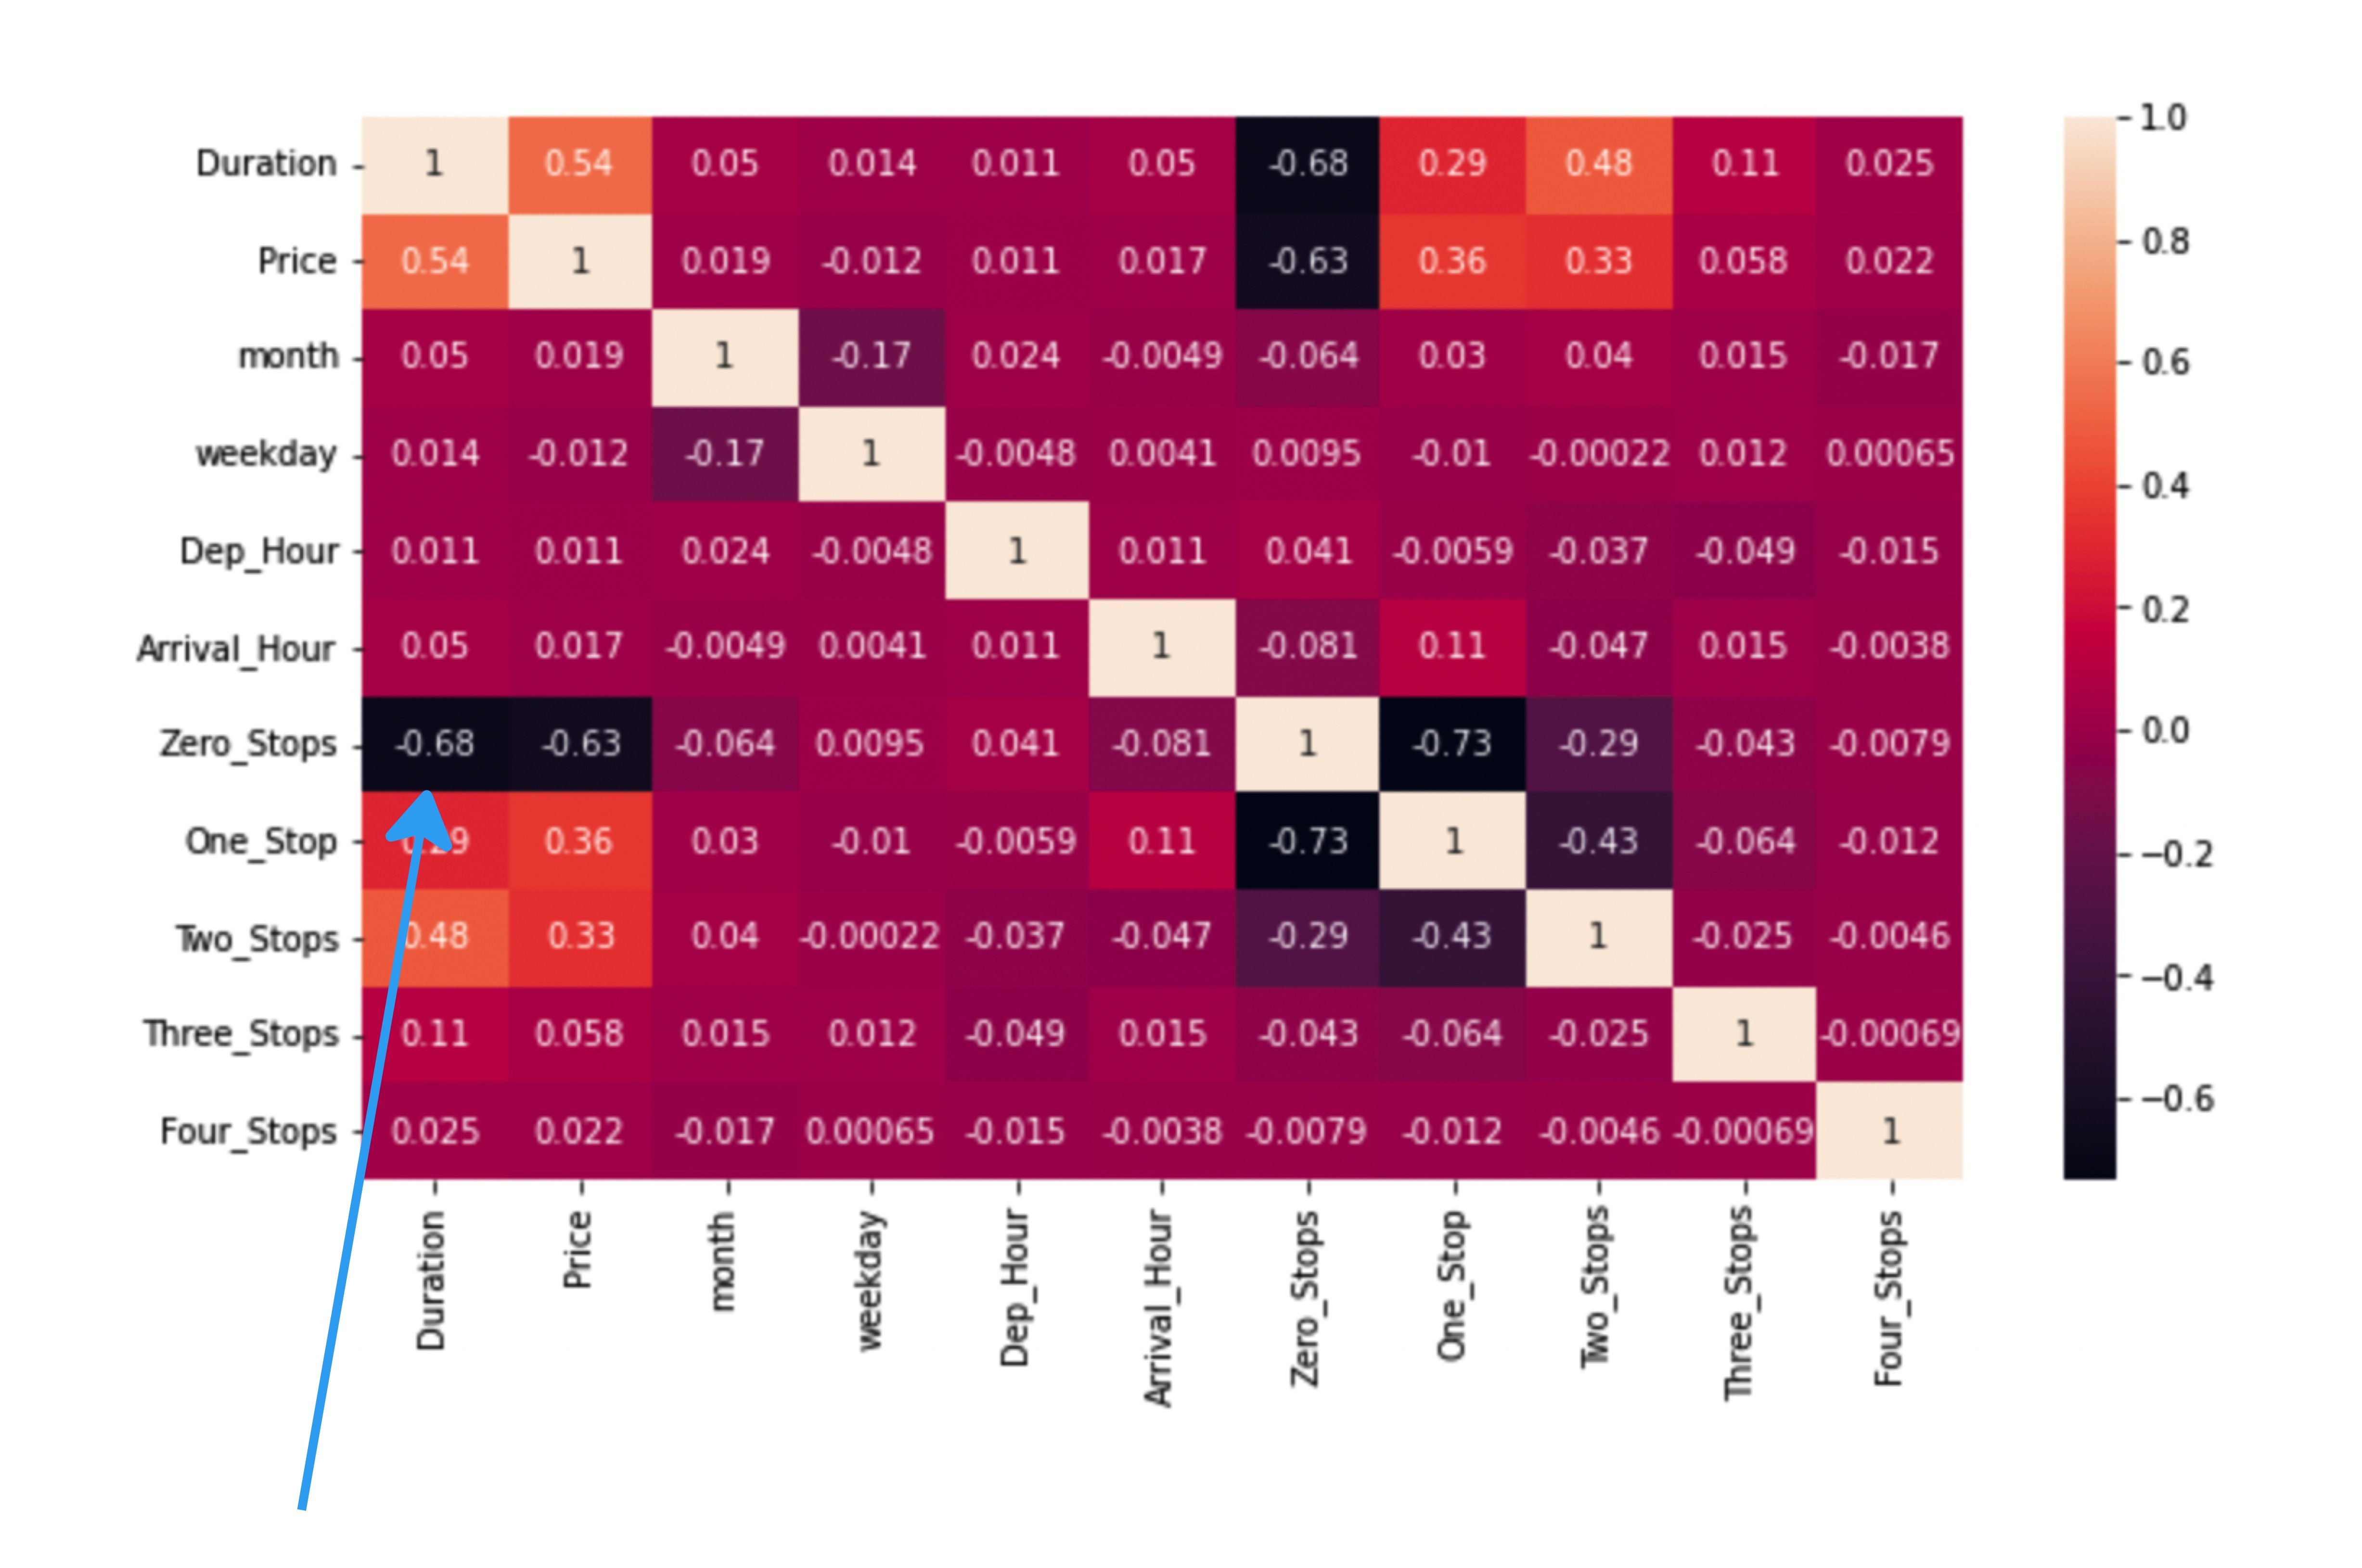
sns.heatmap(planes.corr(numeric_only=True), annot=True)
plt.show()
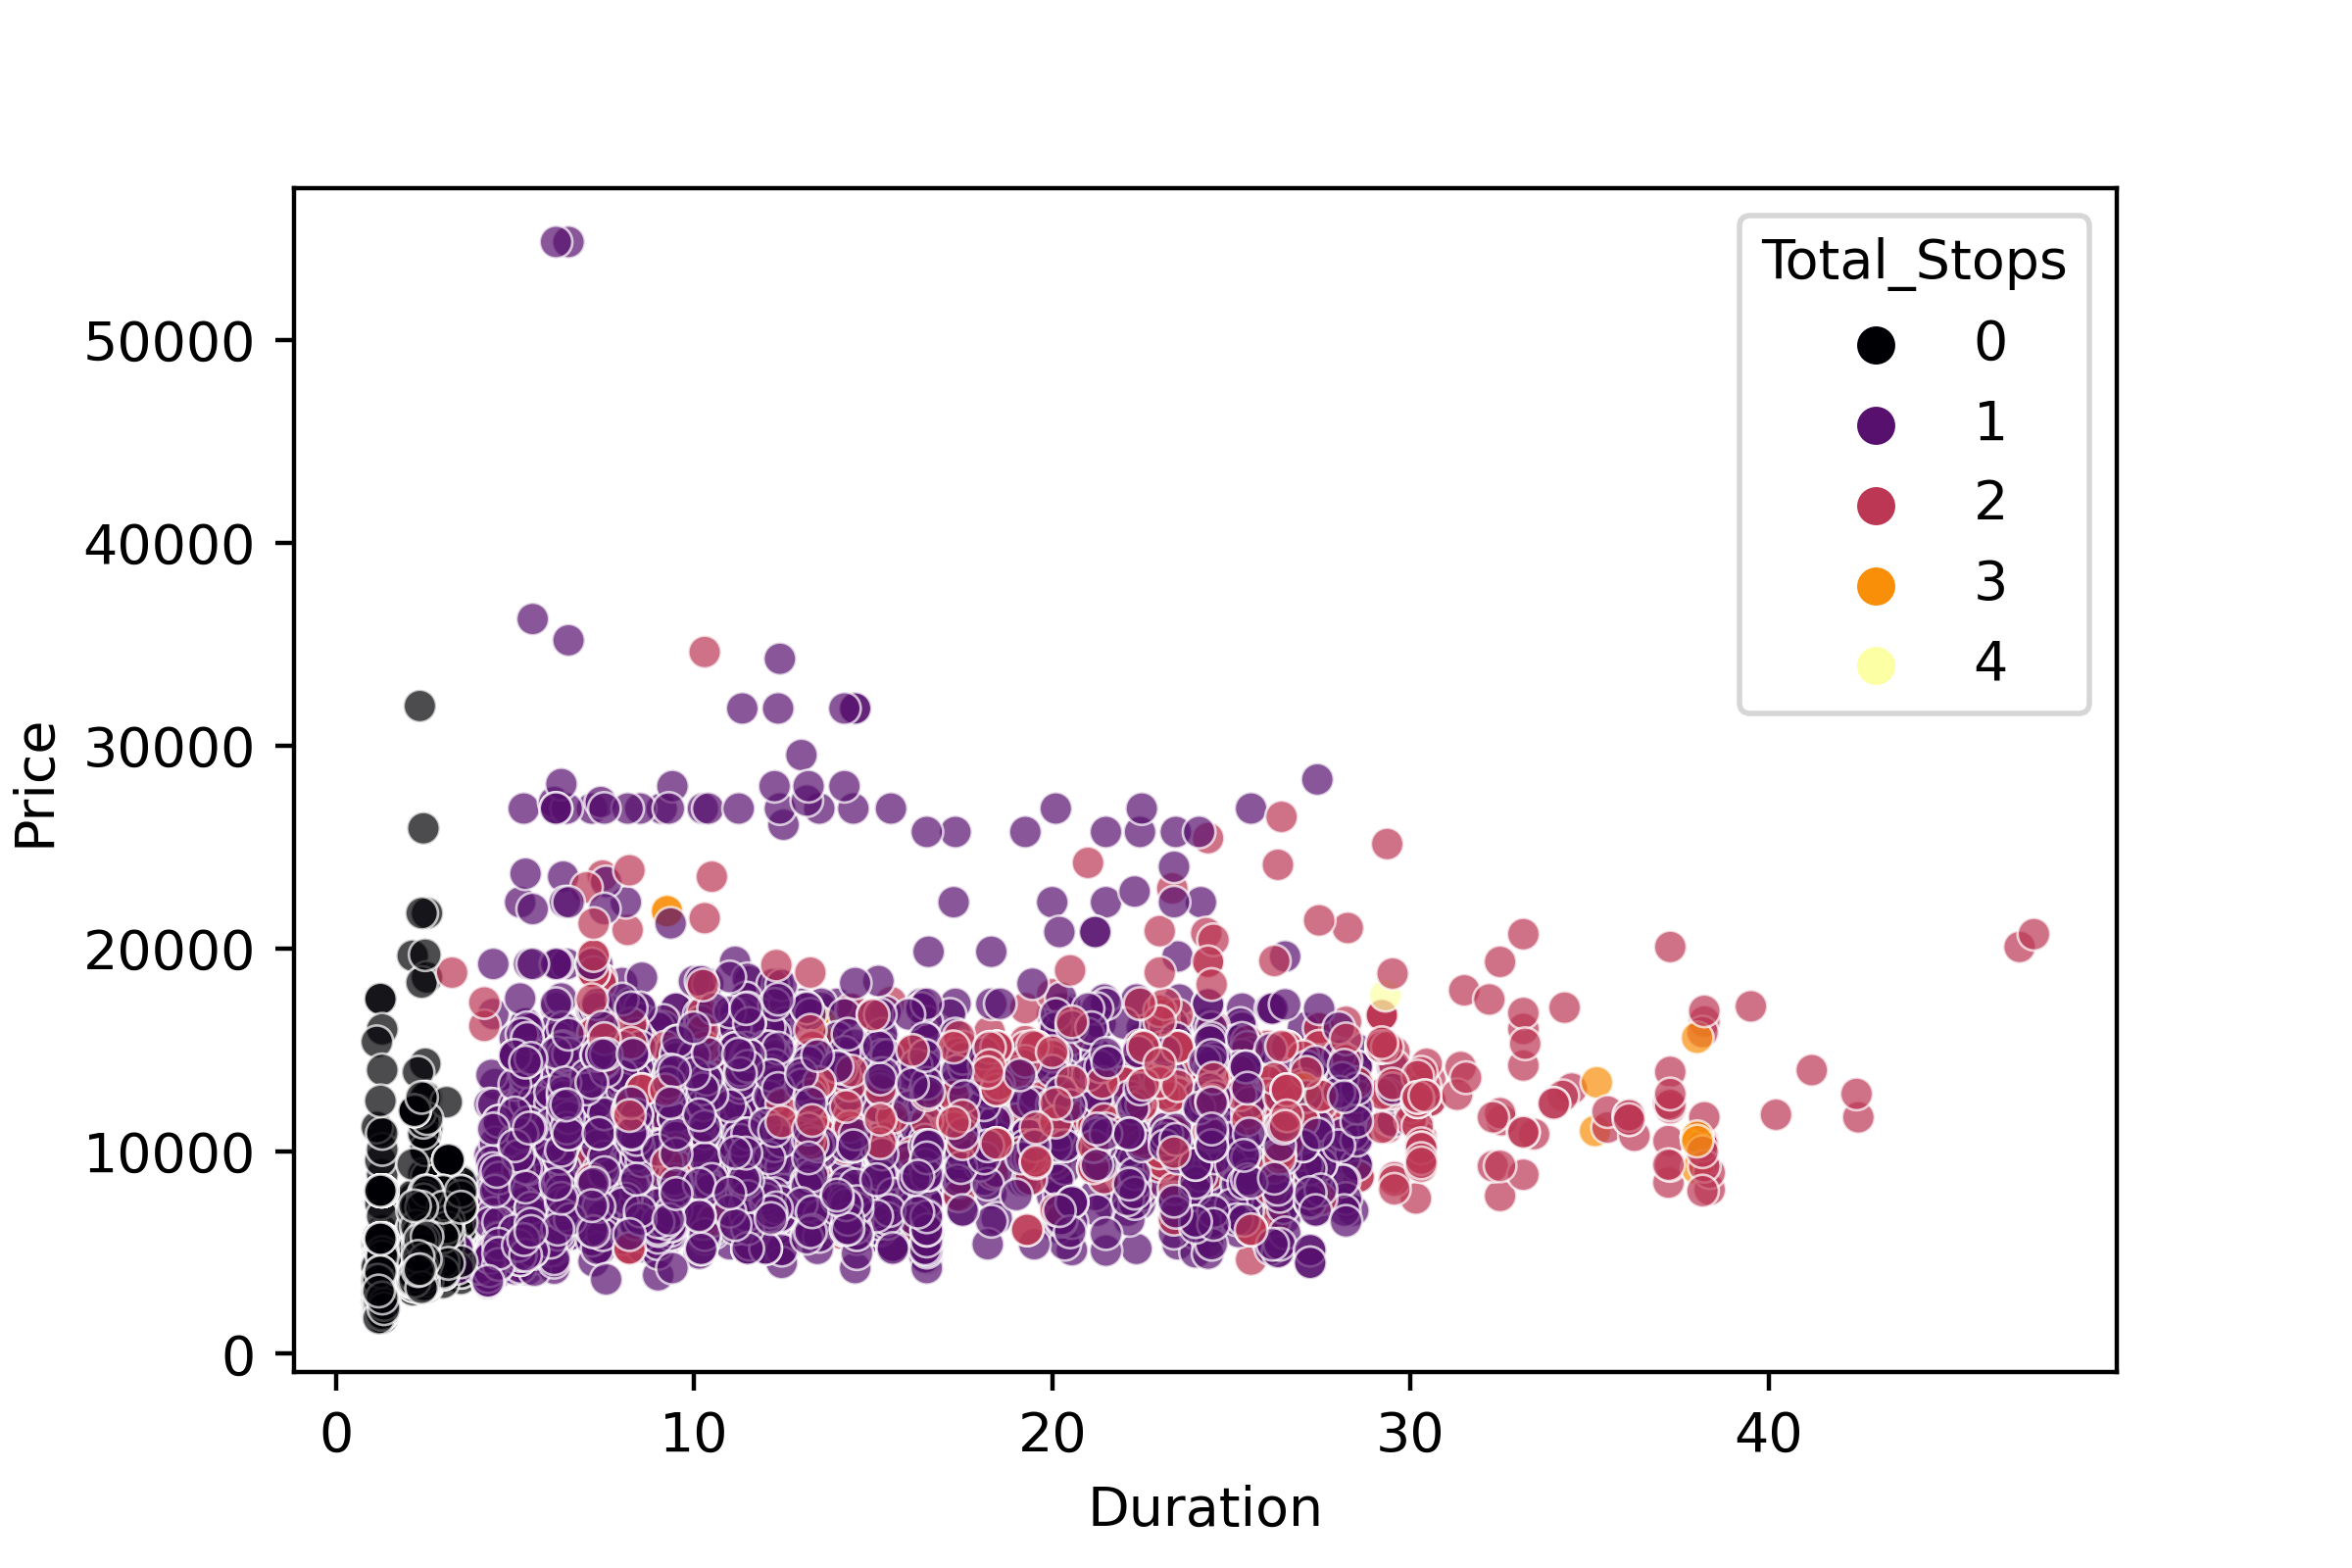
Correlación espuria
sns.scatterplot(data=planes, x="Duration", y="Price", hue="Total_Stops")
plt.show()
¿Cómo lo sabemos?
¿Qué es cierto?

1 Crédito de la imagen: https://unsplash.com/@markuswinkler
Data snooping


Generar hipótesis
Generar hipótesis