Consideraciones para datos categóricos
Análisis exploratorio de datos en Python

George Boorman
Curriculum Manager, DataCamp
¿Por qué realizar un EDA?

1 Crédito de la imagen: https://unsplash.com/@simonesecci
Datos representativos


1 Créditos de la imagen: https://unsplash.com/@cristina_glebova; https://unsplash.com/@nimbus_vulpis
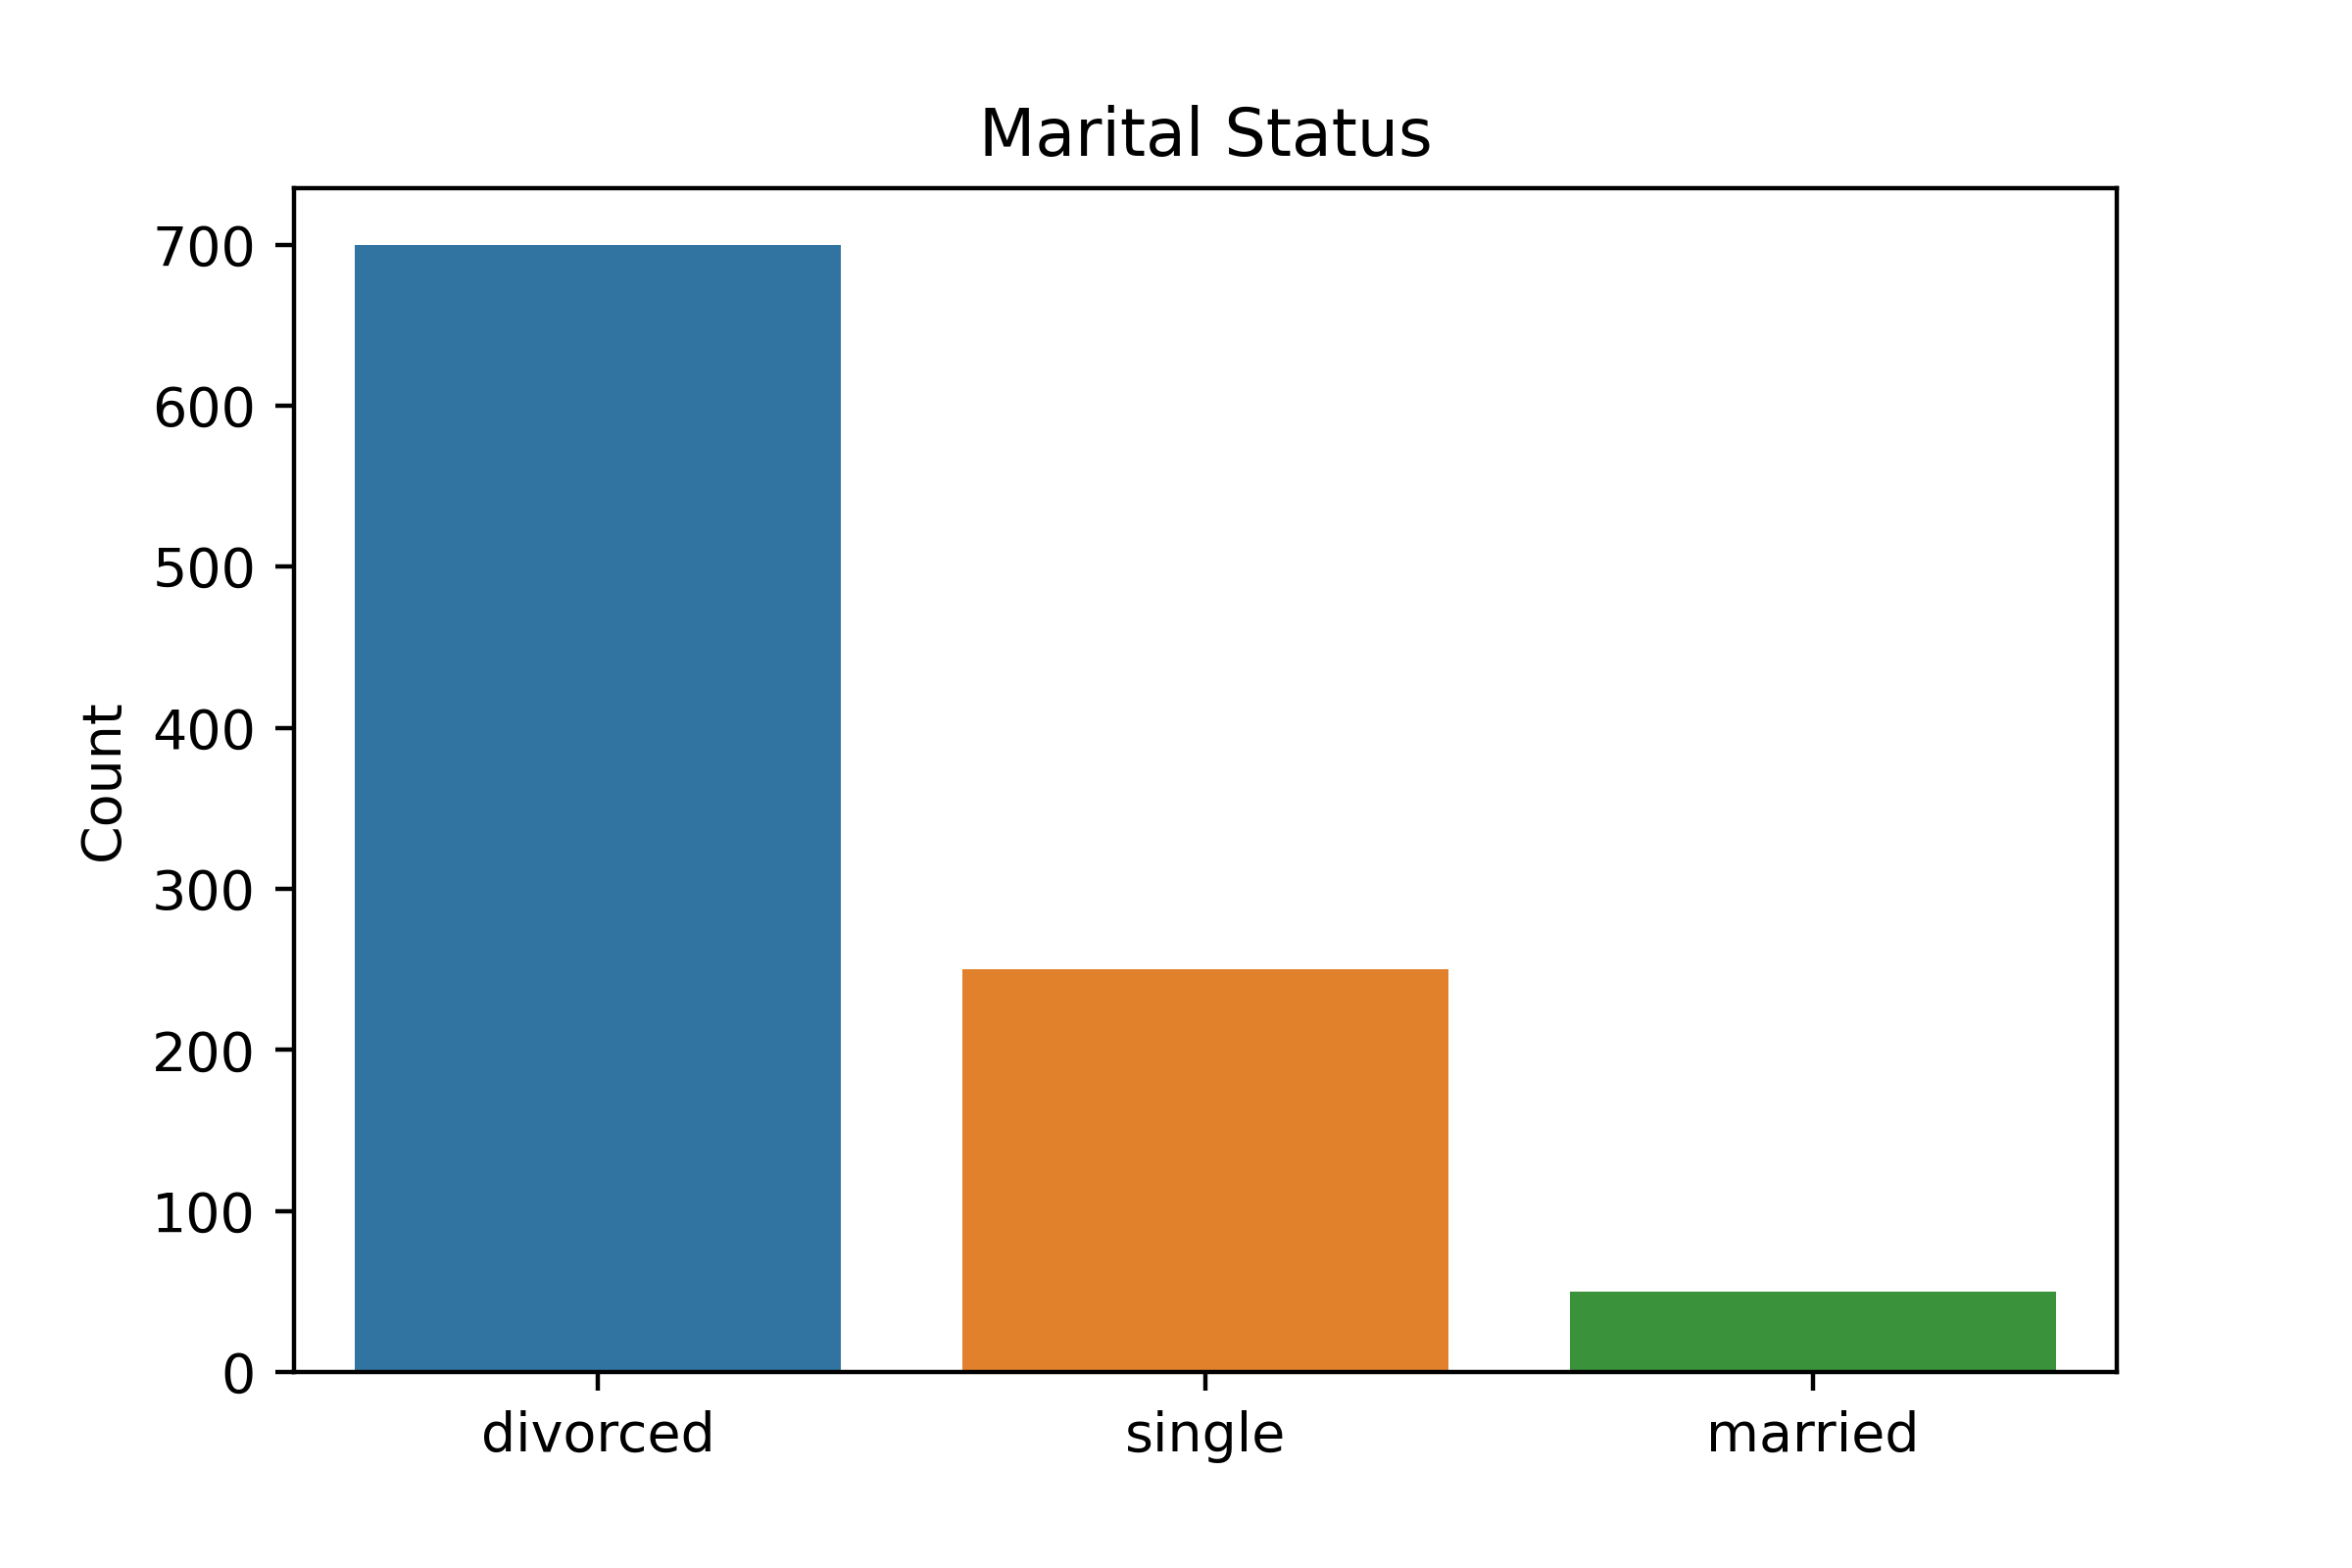
Desequilibrio de clases
Tabulación cruzada
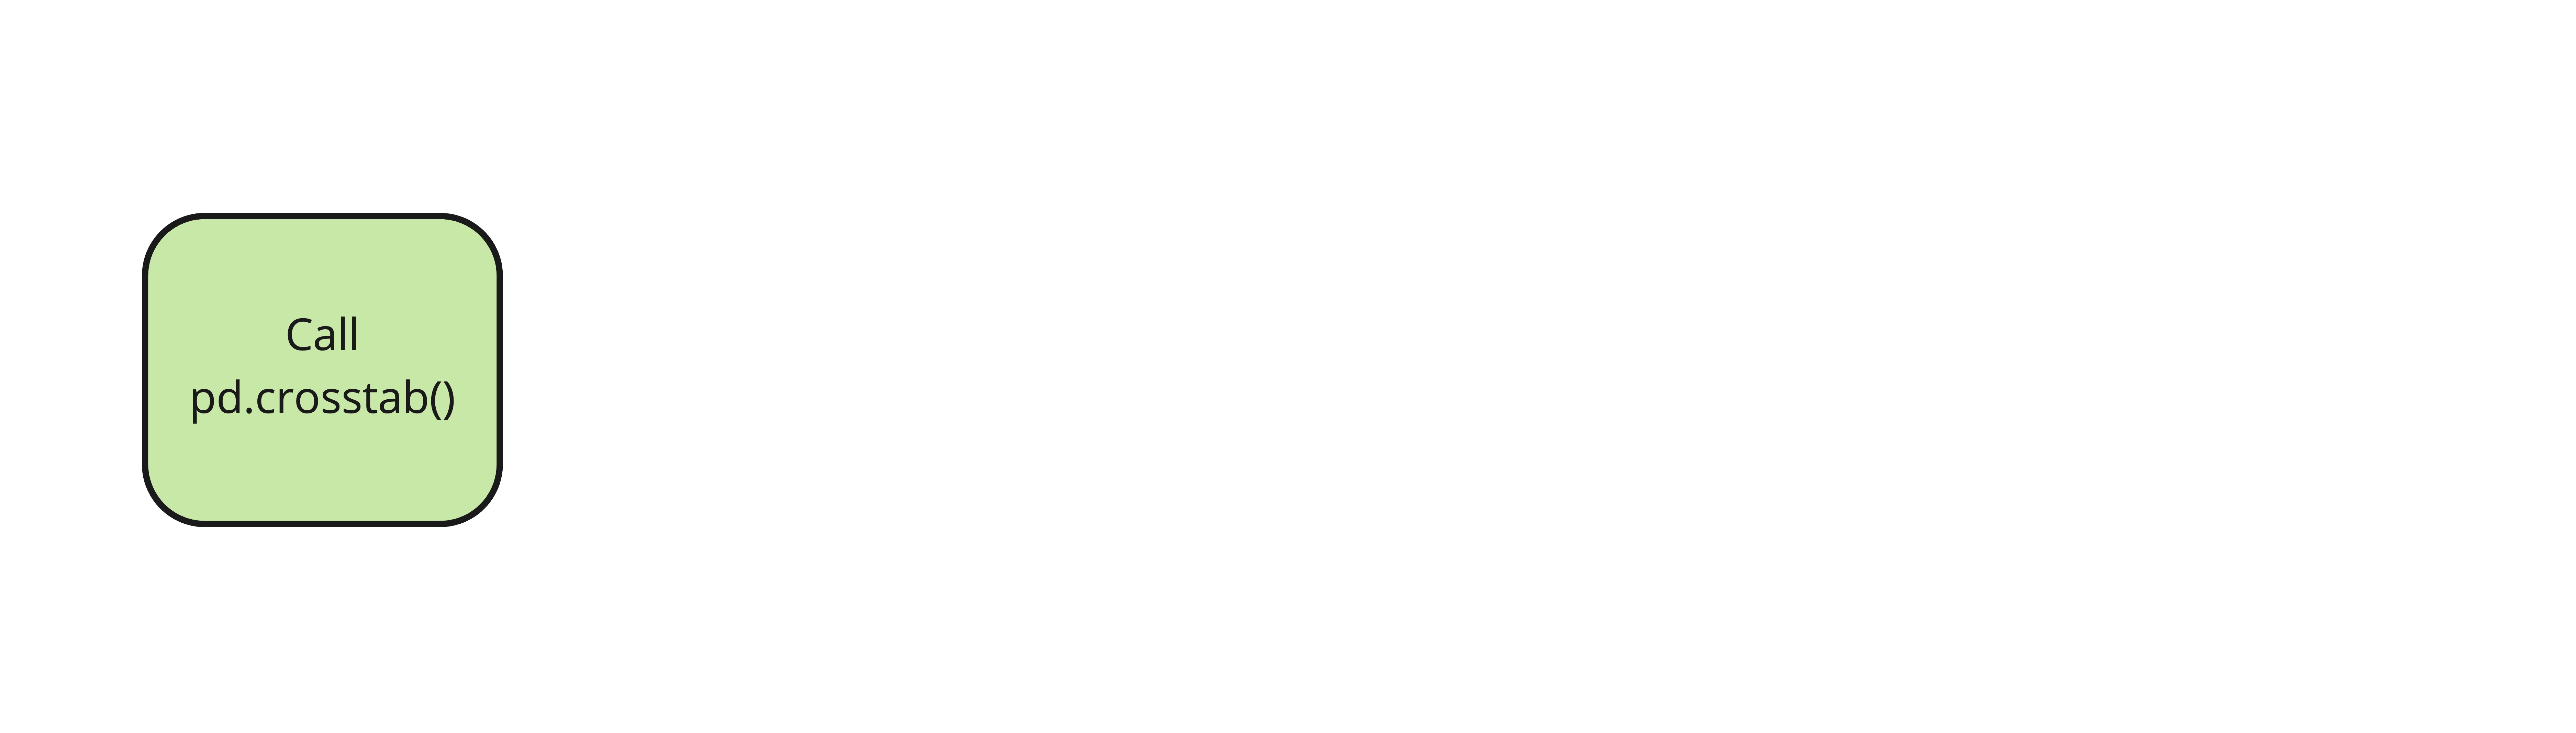
pd.crosstab(
Seleccionar índice
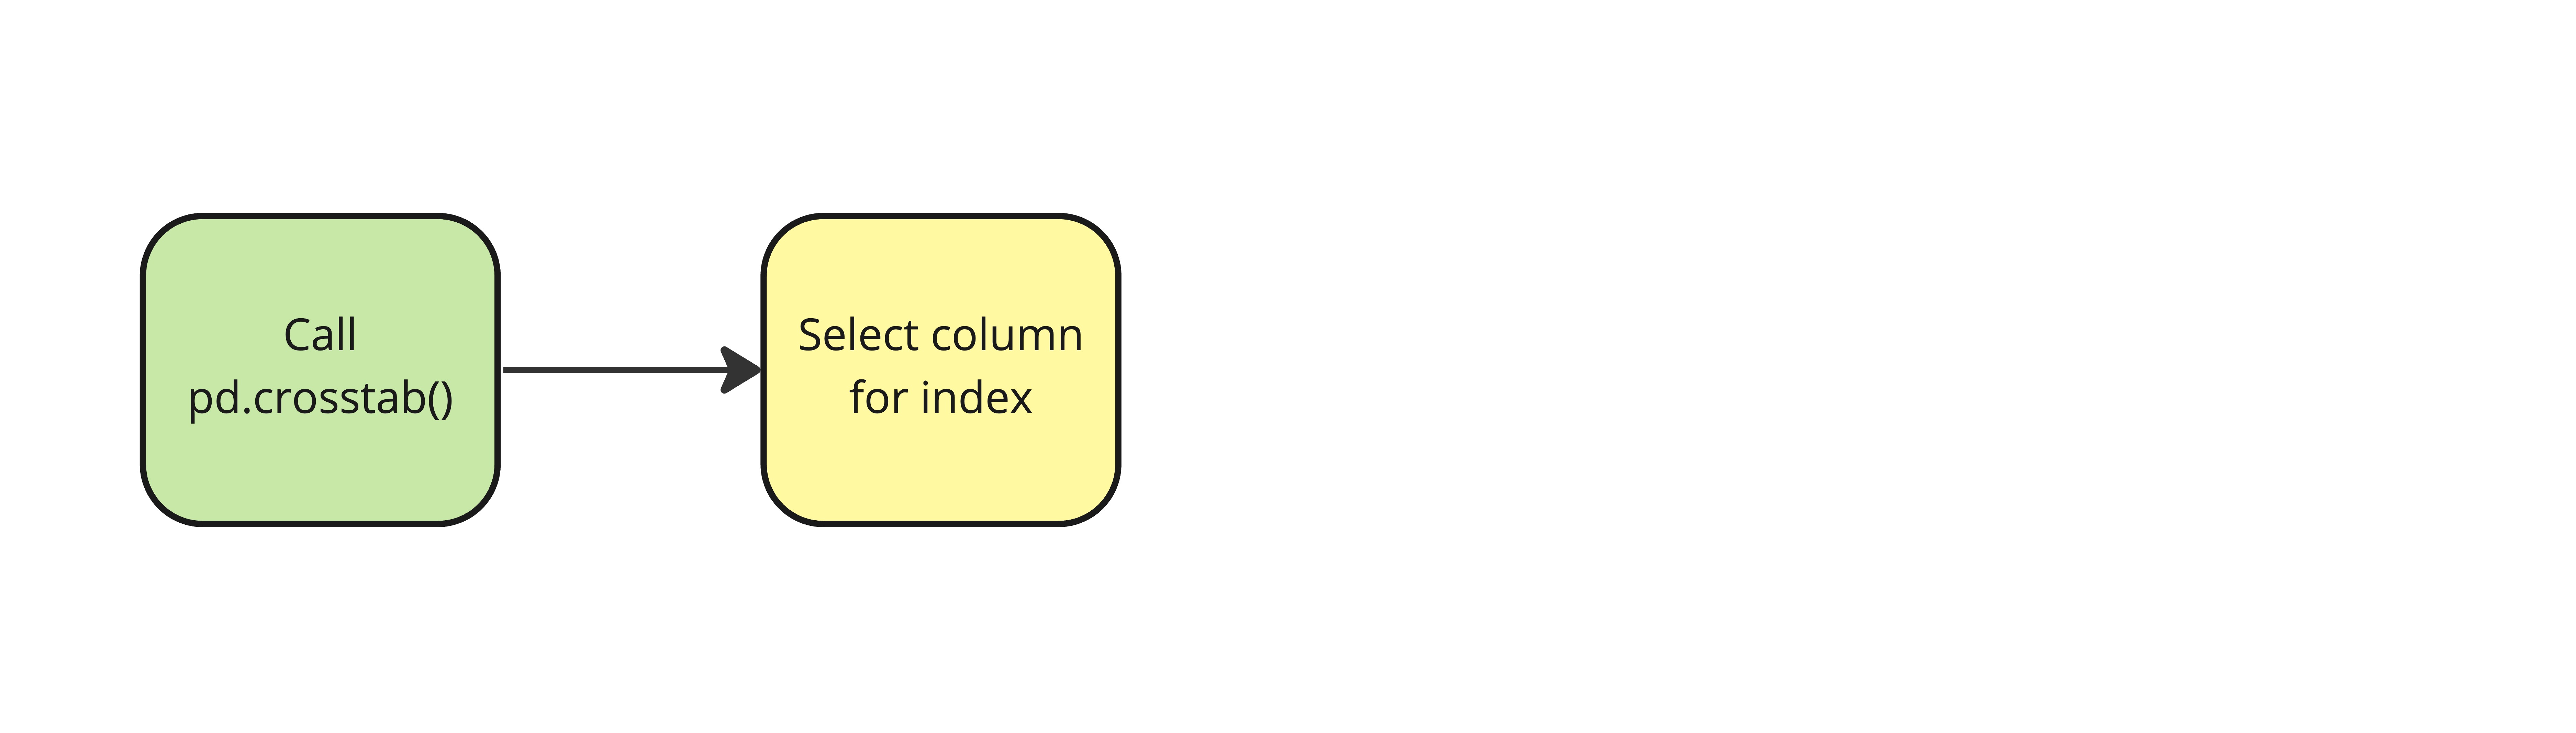
pd.crosstab(planes["Source"],
Seleccionar columnas
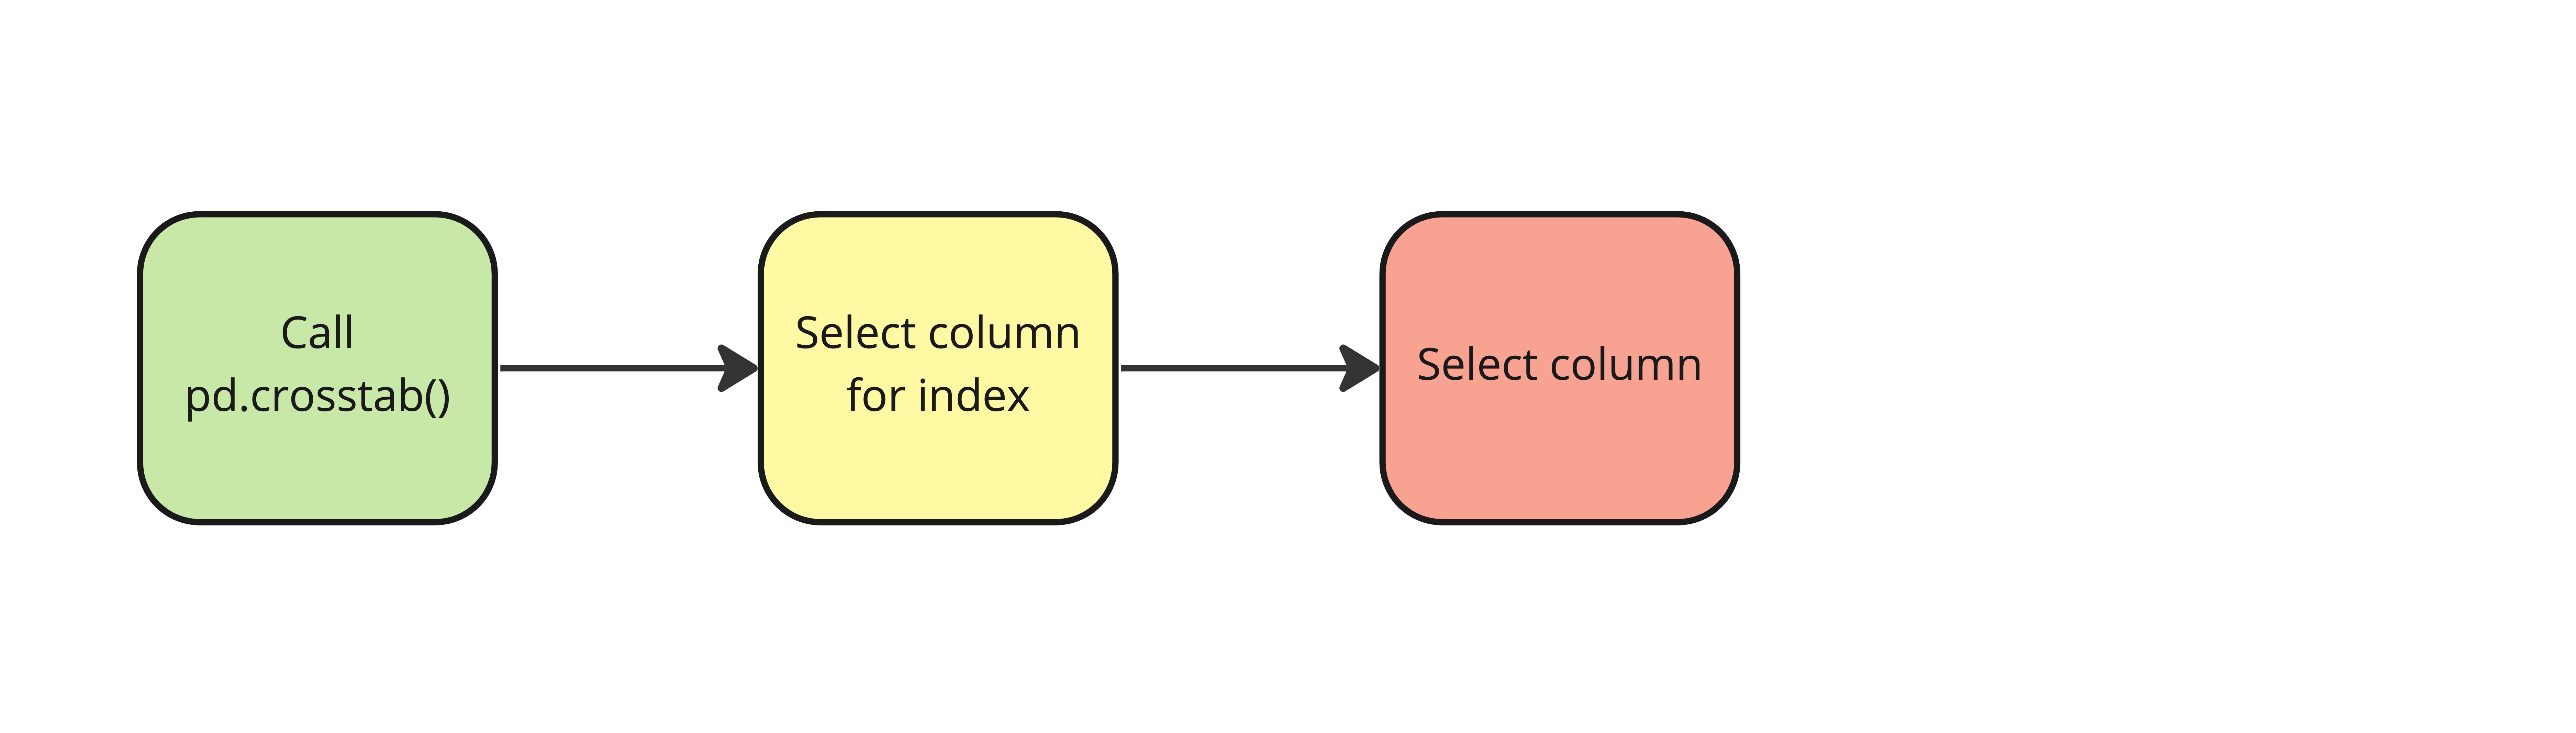
pd.crosstab(planes["Source"], planes["Destination"])

