Data modeling
Power Pivot in Excel

Nick Edwards
Analyst at Roofstock
What is data modeling?

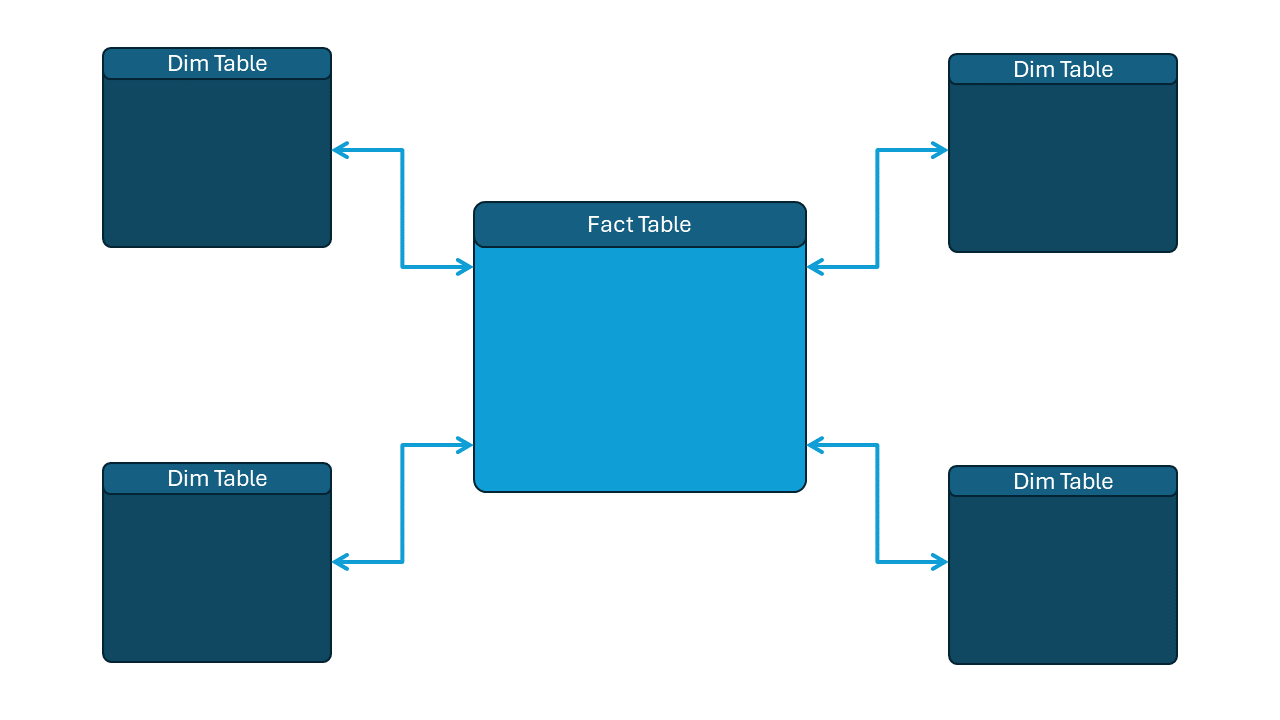
Fact and dimension tables
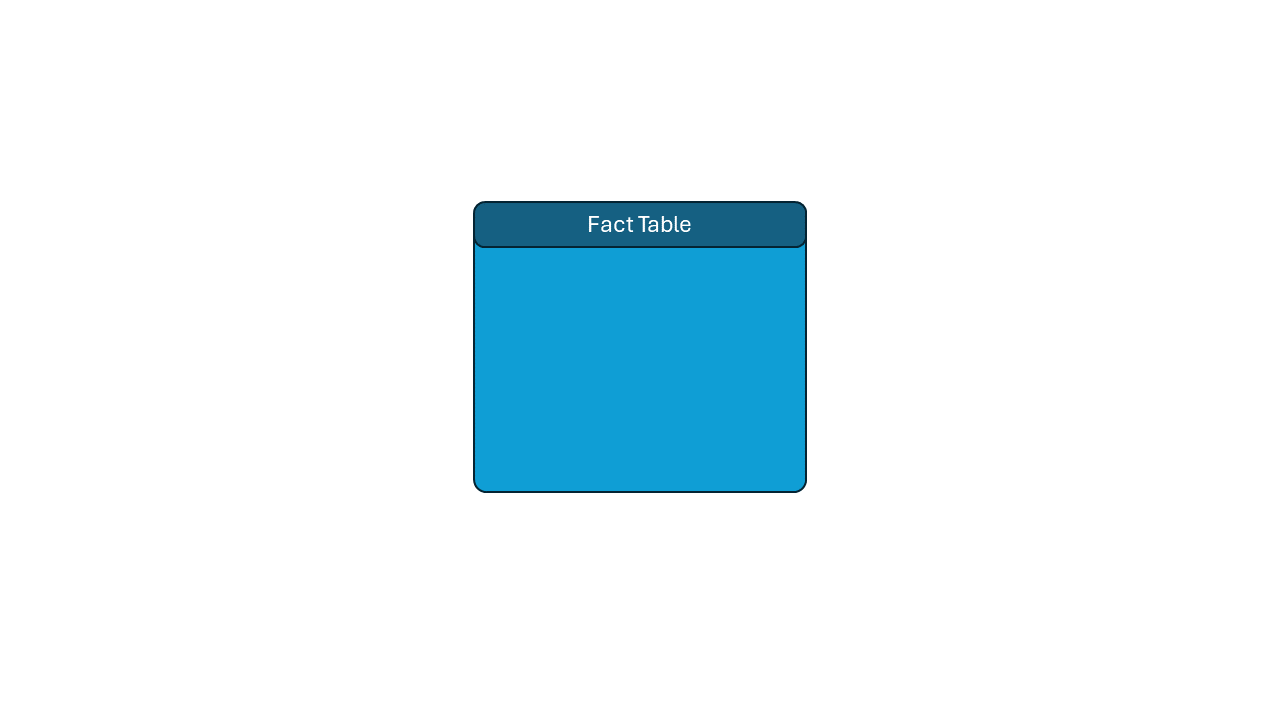
Fact and dimension tables
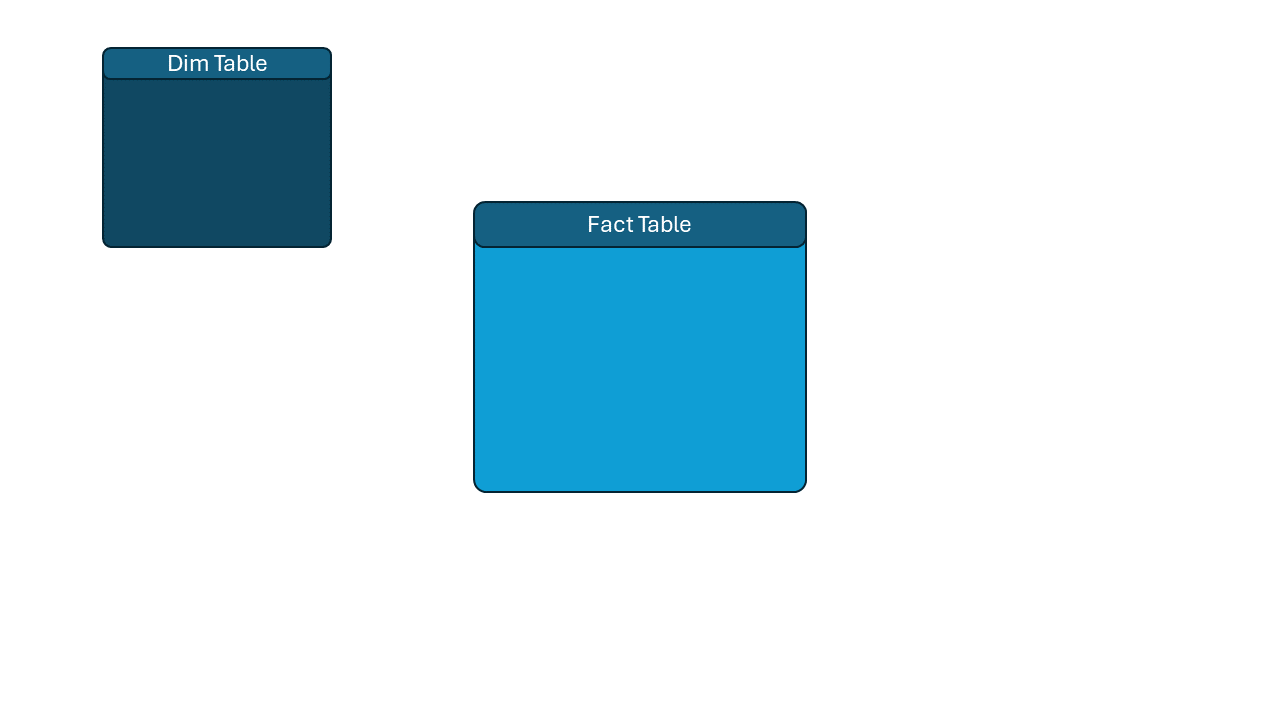
Fact and dimension tables
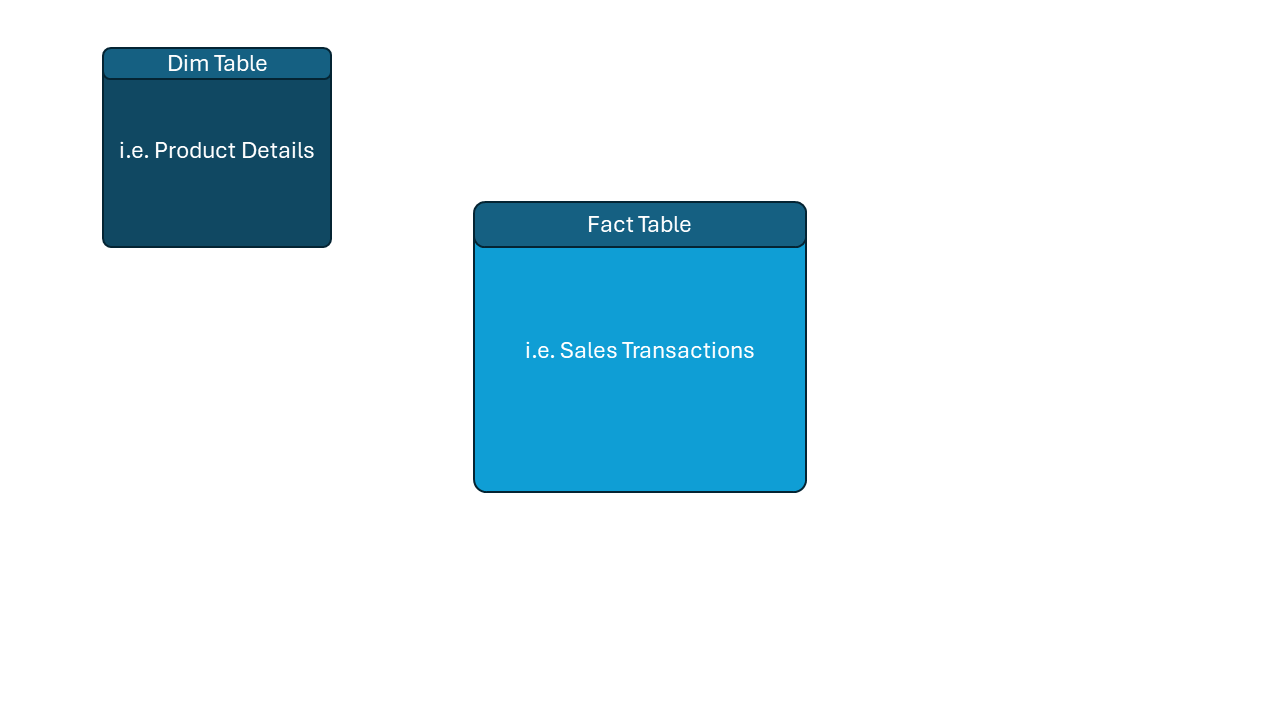
Fact and dimension tables
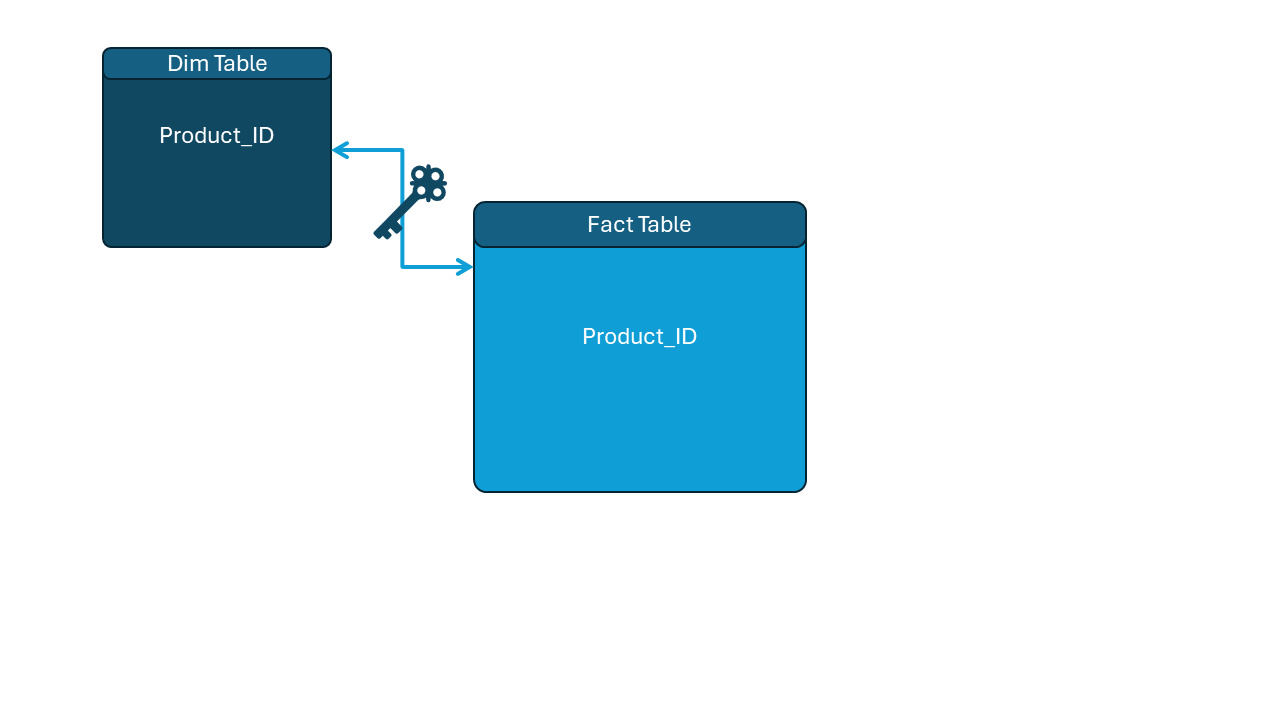
Star schema
Cardinality
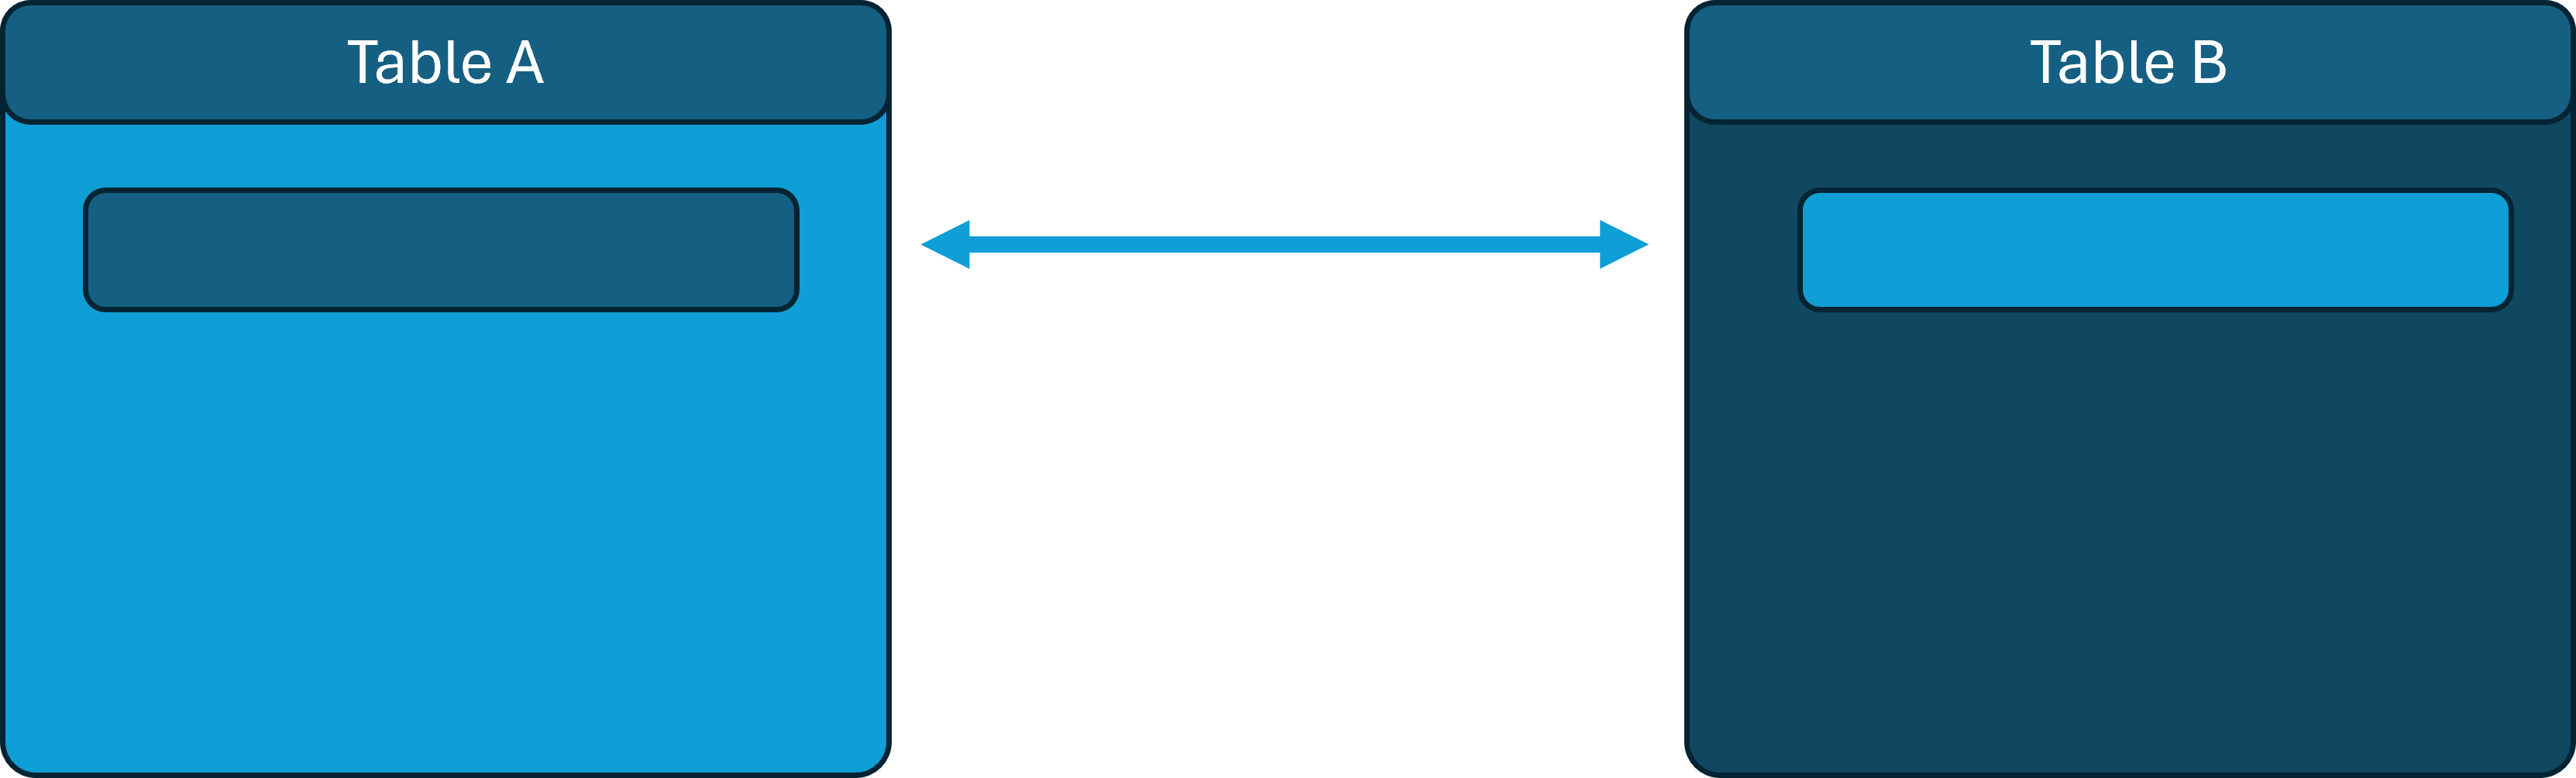
Cardinality - the number of times one row of data from the first table matches with a row of data from a second table.
One-to-one
Cardinality
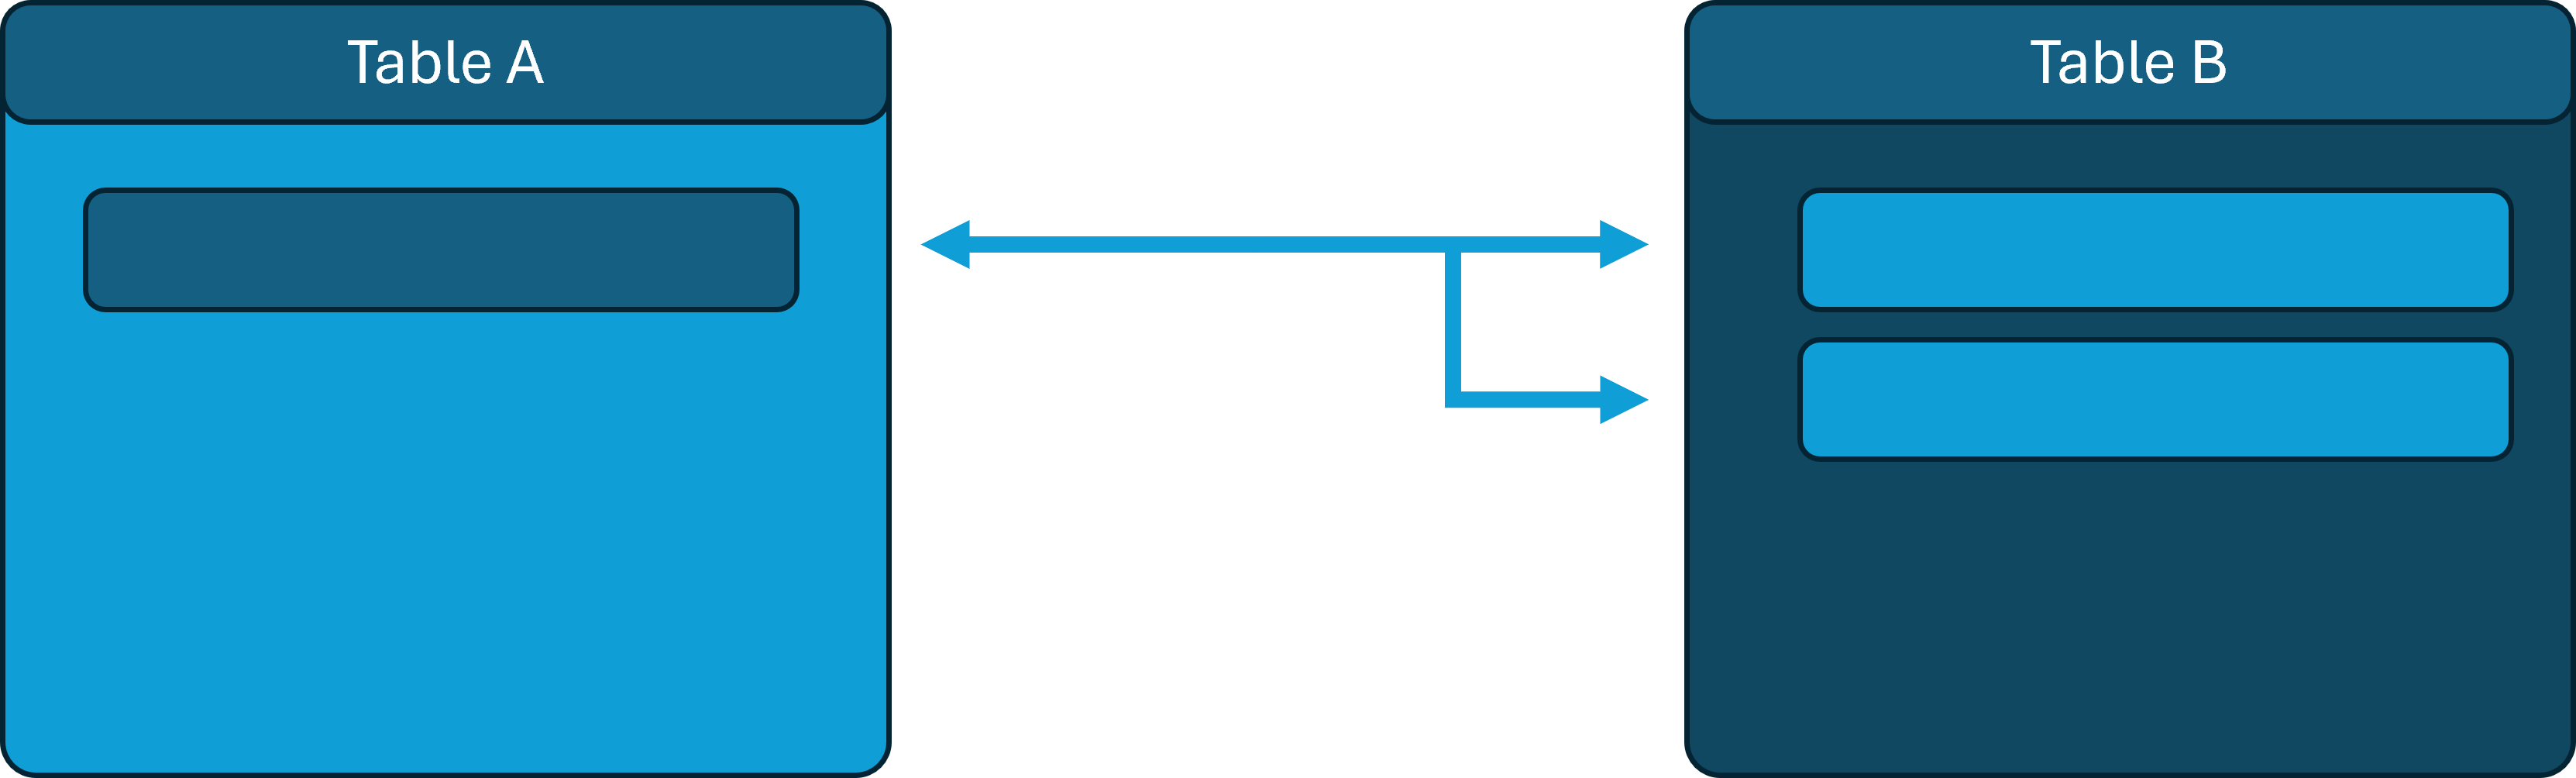
Cardinality - the number of times one row of data from the first table matches with a row of data from a second table.
One-to-many
Cardinality
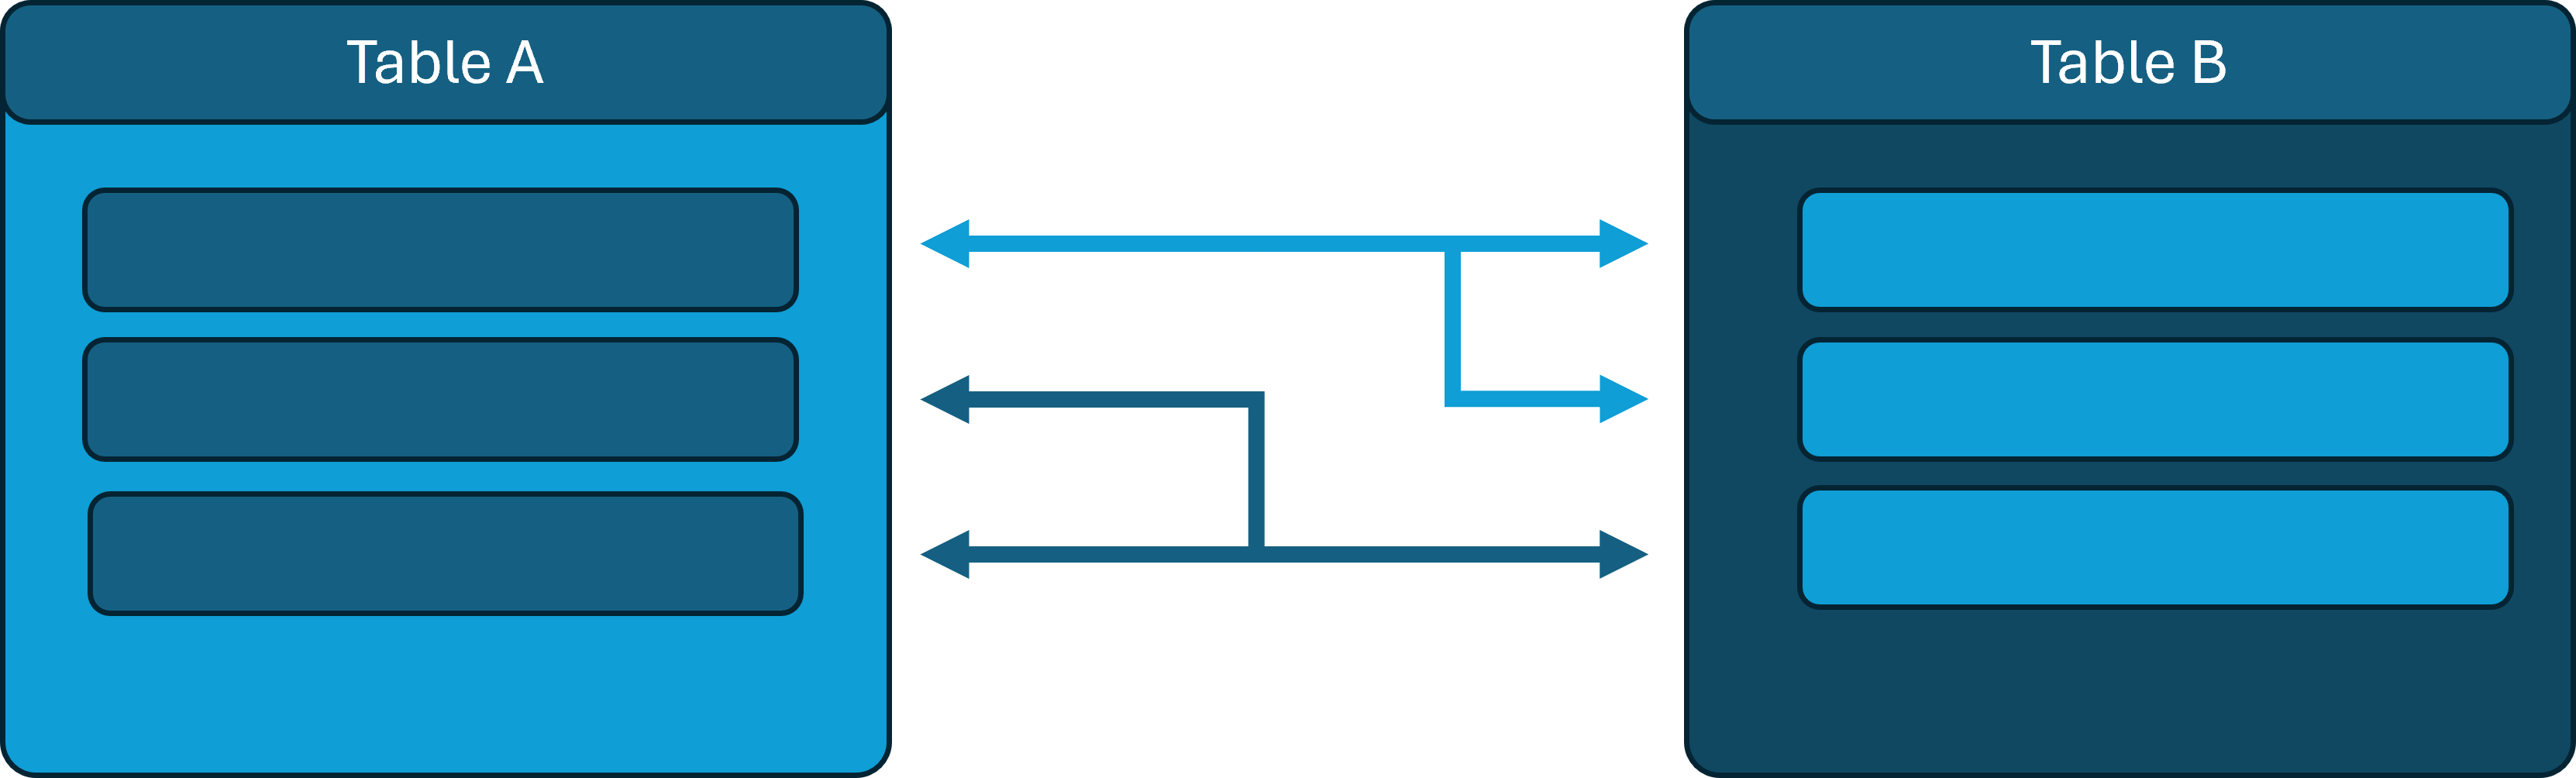
Cardinality - the number of times one row of data from the first table matches with a row of data from a second table.
Many-to-many
Hierarchies
A hierarchy is a way of organizing data into levels of increasing granularity.