Compartir tus visualizaciones con otras personas
Introducción a la visualización de datos con Matplotlib

Ariel Rokem
Data Scientist
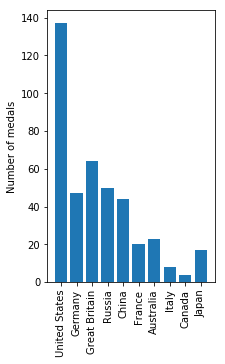
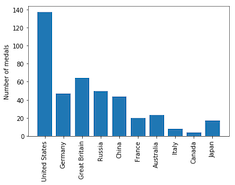
Una figura para compartir
fig, ax = plt.subplots()

ax.bar(medals.index, medals["Gold"])
ax.set_xticklabels(medals.index, rotation=90)
ax.set_ylabel("Number of medals")

plt.show()
Tamaño
fig.set_size_inches([5, 3])
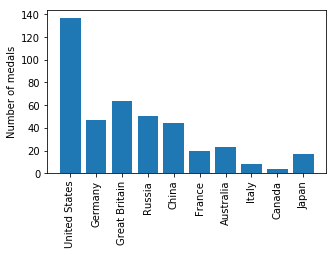
Otra relación de aspecto
fig.set_size_inches([3, 5])