Gráficos de barras
Introducción a Tidyverse

David Robinson
Chief Data Scientist, DataCamp
Diagrama de barras
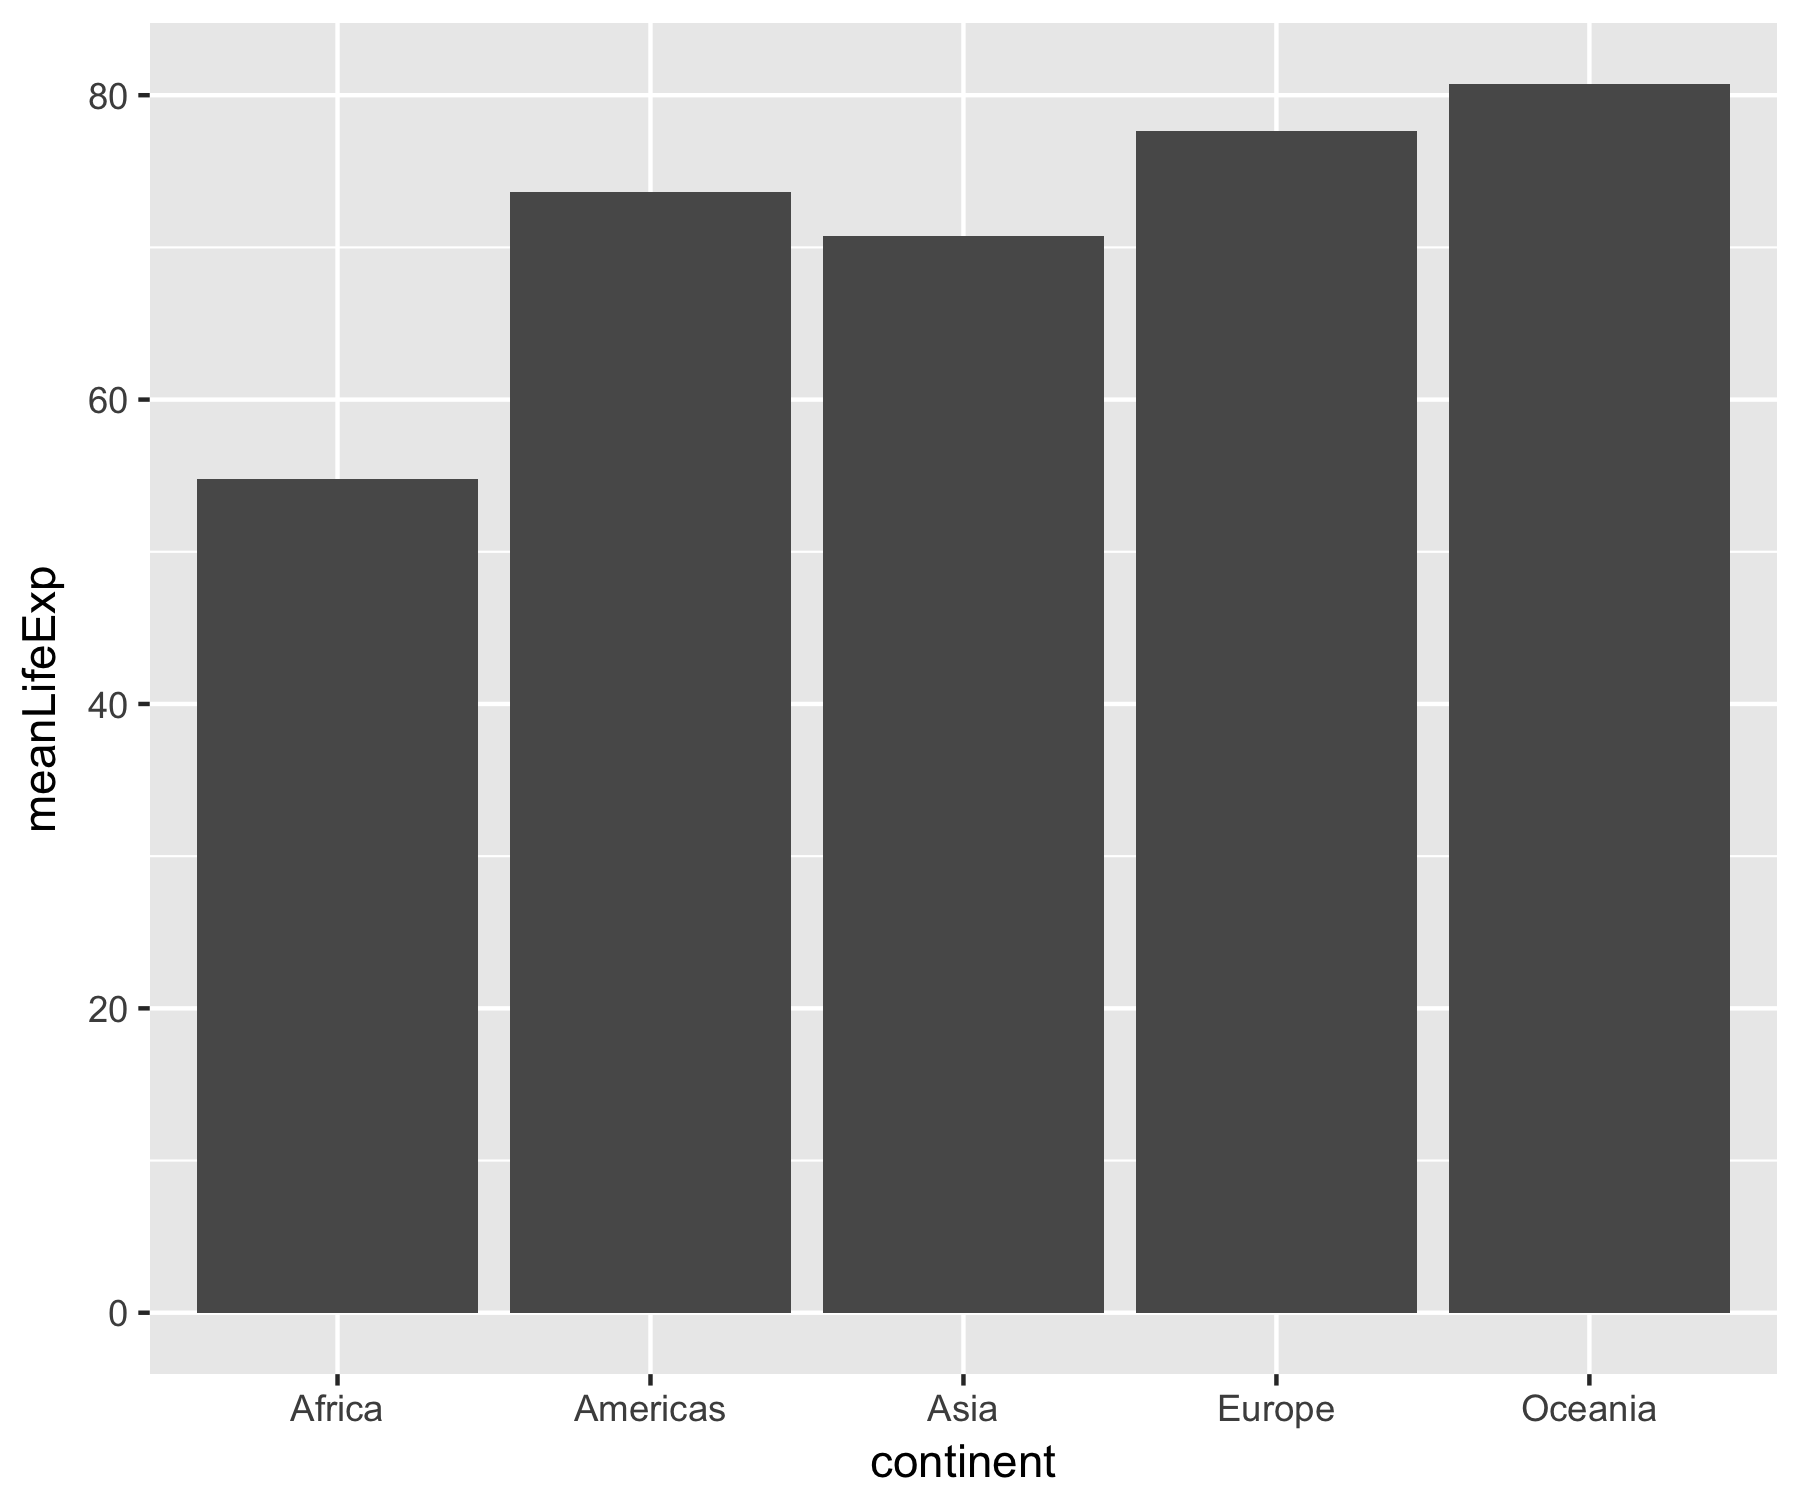
ggplot(by_continent, aes(x = continent, y = meanLifeExp)) +
  geom_col()
Introducción a Tidyverse
David Robinson
Chief Data Scientist, DataCamp
ggplot(by_continent, aes(x = continent, y = meanLifeExp)) +
geom_col()

