El verbo disponer
Introducción a Tidyverse

David Robinson
Chief Data Scientist, DataCamp
El verbo disponer
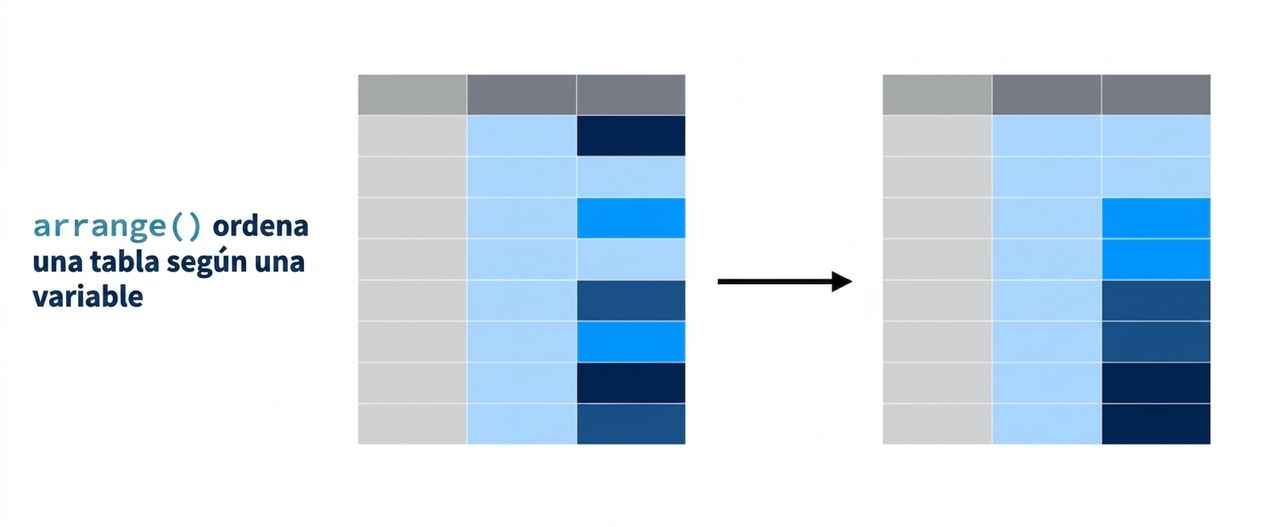
Ordenar con arrange
gapminder %>%
  arrange(gdpPercap)
# A tibble: 1,704 x 6
            country continent  year lifeExp      pop gdpPercap
              <fct>     <fct> <int>   <dbl>    <dbl>     <dbl>
 1 Congo, Dem. Rep.    Africa  2002  44.966 55379852  241.1659
 2 Congo, Dem. Rep.    Africa  2007  46.462 64606759  277.5519
 3          Lesotho    Africa  1952  42.138   748747  298.8462
 4    Guinea-Bissau    Africa  1952  32.500   580653  299.8503
 5 Congo, Dem. Rep.    Africa  1997  42.587 47798986  312.1884
 6          Eritrea    Africa  1952  35.928  1438760  328.9406
 7          Myanmar      Asia  1952  36.319 20092996  331.0000
 8          Lesotho    Africa  1957  45.047   813338  335.9971
 9          Burundi    Africa  1952  39.031  2445618  339.2965
10          Eritrea    Africa  1957  38.047  1542611  344.1619
# ... with 1,694 more rows
Ordenación descendente
gapminder %>%
  arrange(desc(gdpPercap))
# A tibble: 1,704 x 6
     country continent  year lifeExp     pop gdpPercap
       <fct>     <fct> <int>   <dbl>   <dbl>     <dbl>
 1    Kuwait      Asia  1957  58.033  212846 113523.13
 2    Kuwait      Asia  1972  67.712  841934 109347.87
 3    Kuwait      Asia  1952  55.565  160000 108382.35
 4    Kuwait      Asia  1962  60.470  358266  95458.11
 5    Kuwait      Asia  1967  64.624  575003  80894.88
 6    Kuwait      Asia  1977  69.343 1140357  59265.48
 7    Norway    Europe  2007  80.196 4627926  49357.19
 8    Kuwait      Asia  2007  77.588 2505559  47306.99
 9 Singapore      Asia  2007  79.972 4553009  47143.18
10    Norway    Europe  2002  79.050 4535591  44683.98
# ... with 1,694 more rows
Filtrar y luego ordenar
gapminder %>%
  filter(year == 2007) %>%
  arrange(desc(gdpPercap))
# A tibble: 142 x 6
            country continent  year lifeExp       pop gdpPercap
              <fct>     <fct> <int>   <dbl>     <dbl>     <dbl>
 1           Norway    Europe  2007  80.196   4627926  49357.19
 2           Kuwait      Asia  2007  77.588   2505559  47306.99
 3        Singapore      Asia  2007  79.972   4553009  47143.18
 4    United States  Americas  2007  78.242 301139947  42951.65
 5          Ireland    Europe  2007  78.885   4109086  40676.00
 6 Hong Kong, China      Asia  2007  82.208   6980412  39724.98
 7      Switzerland    Europe  2007  81.701   7554661  37506.42
 8      Netherlands    Europe  2007  79.762  16570613  36797.93
 9           Canada  Americas  2007  80.653  33390141  36319.24
10          Iceland    Europe  2007  81.757    301931  36180.79
# ... with 132 more rows
¡Vamos a practicar!
Introducción a Tidyverse

