Crear gráficos de líneas
Introducción a la ciencia de datos con Python

Hillary Green-Lerman
Lead Data Scientist, Looker
La trama se complica

De DataFrame a visualización
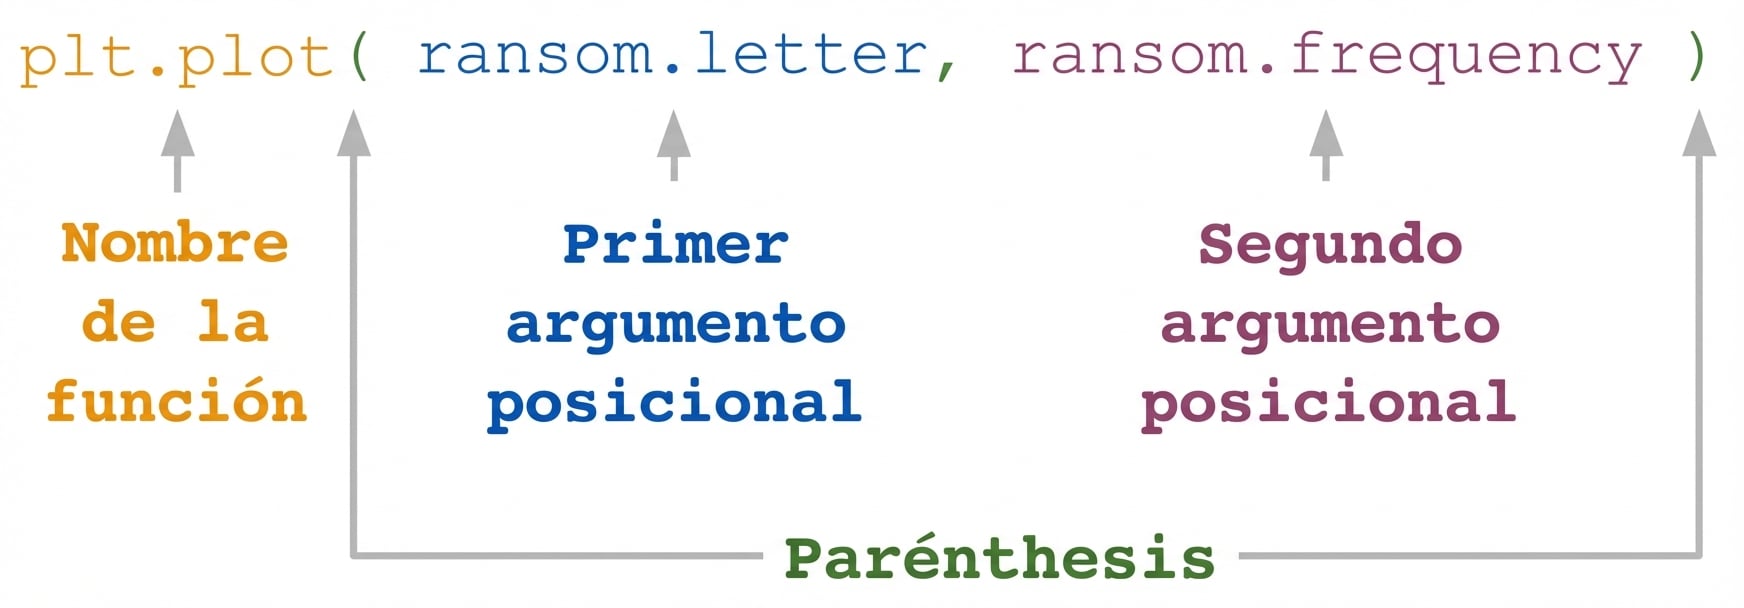
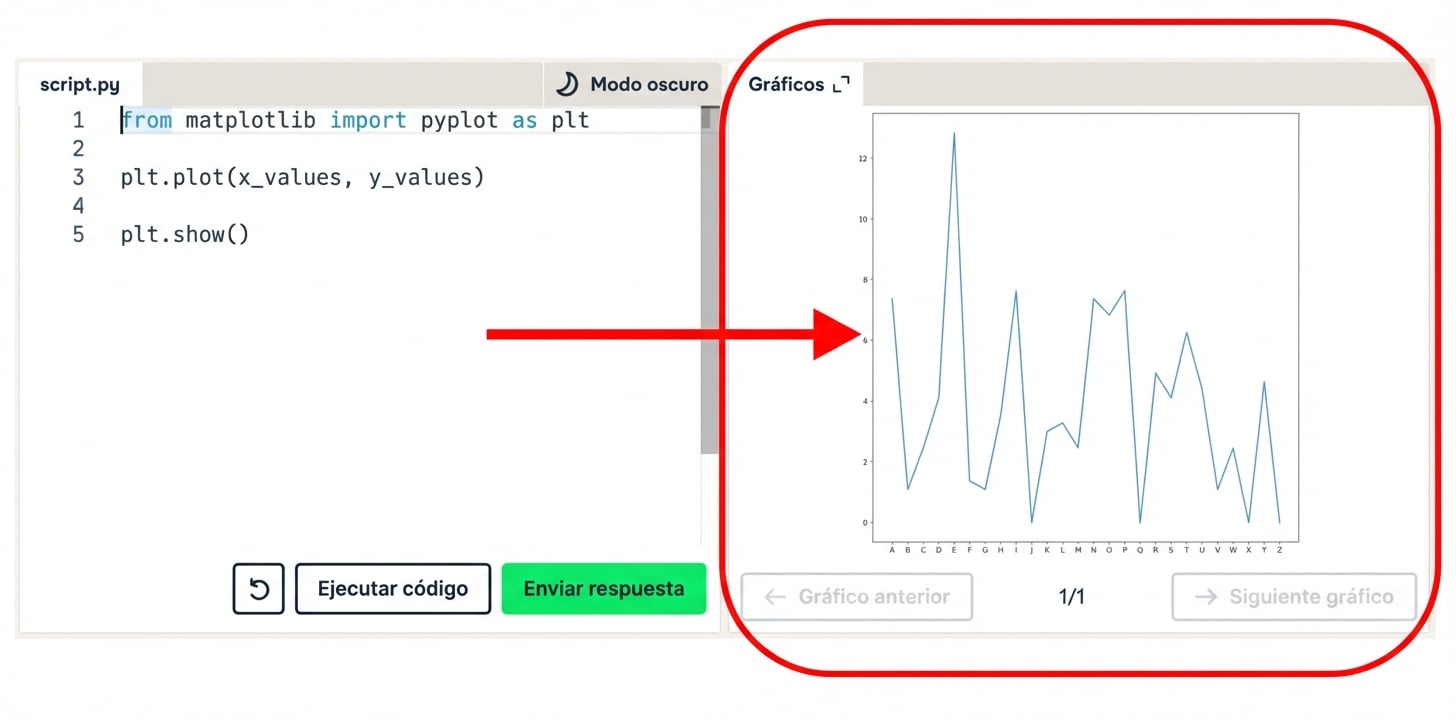
Introducción a Matplotlib
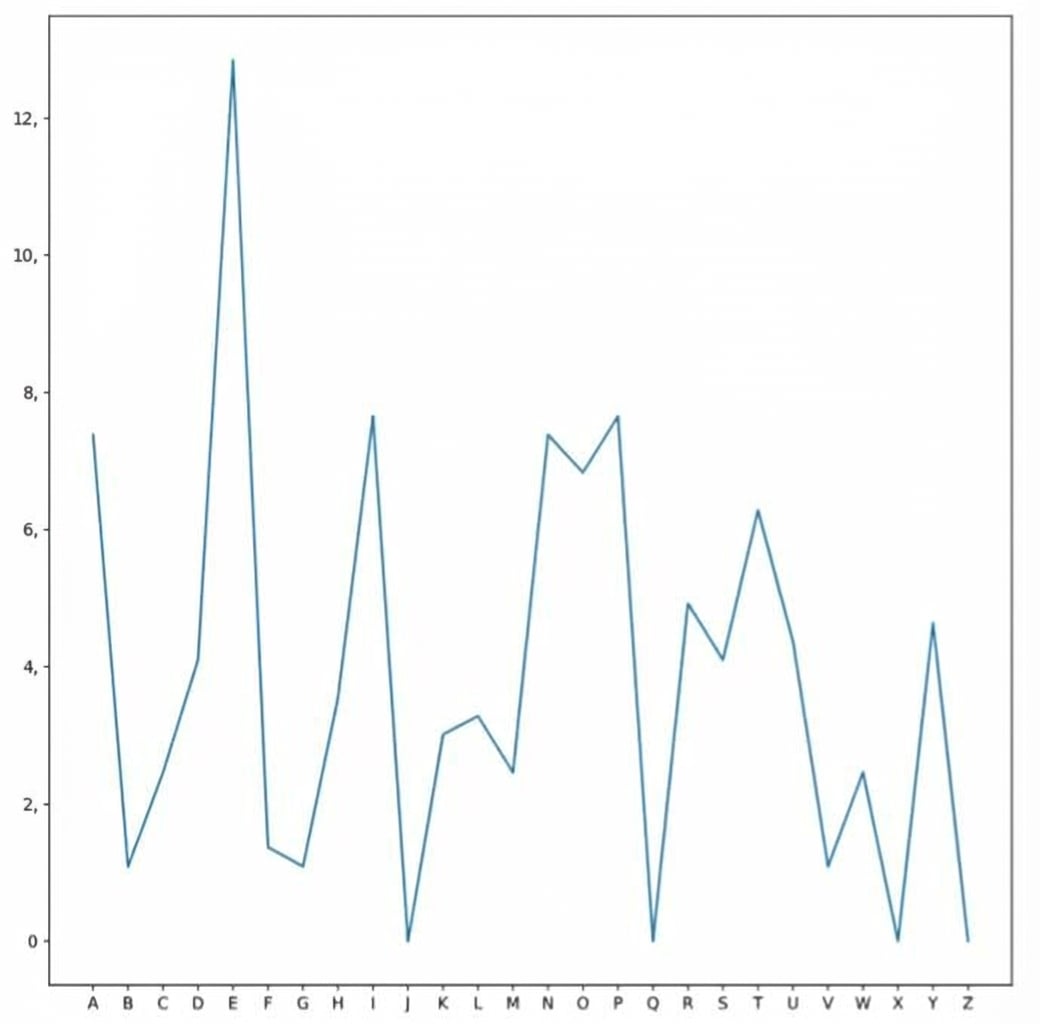
Gráfico de líneas
Mostrar resultados
plt.show()
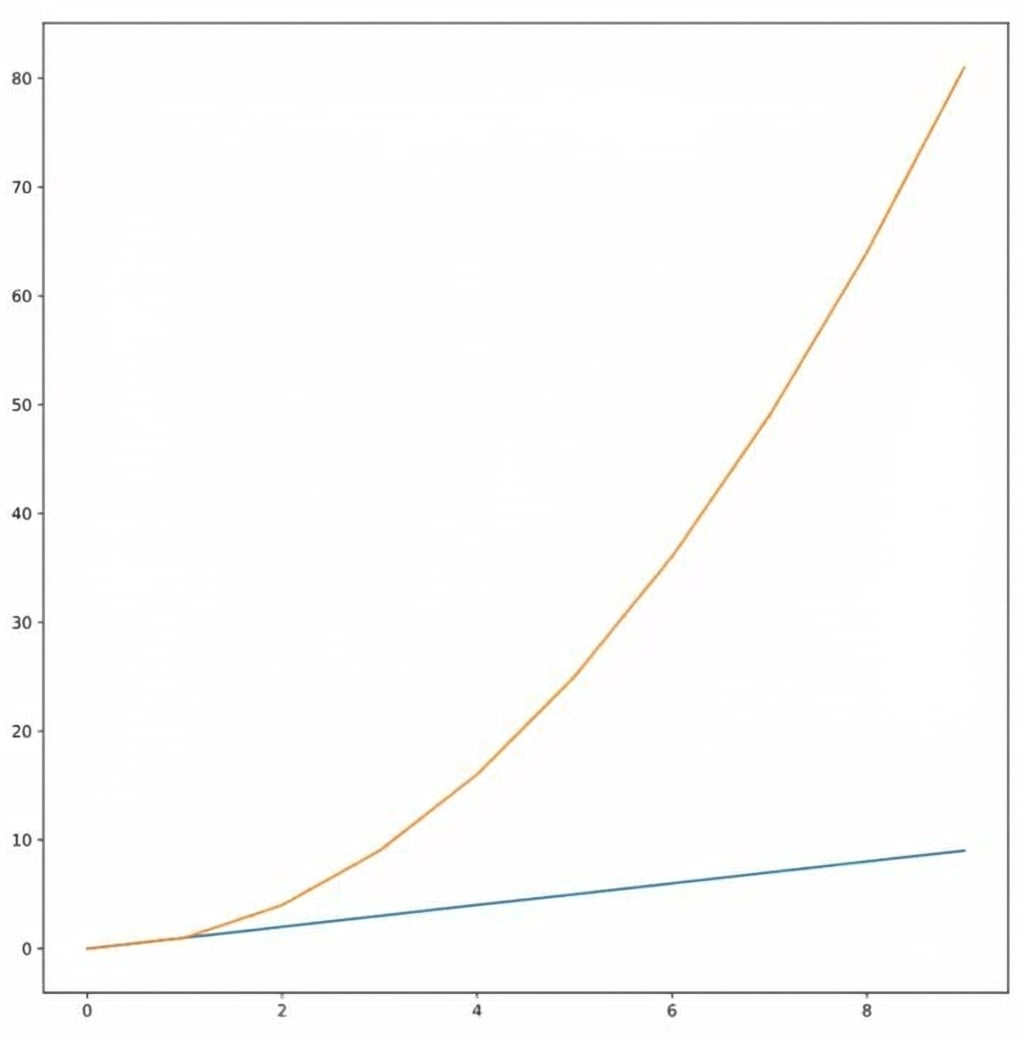
Múltiples líneas