Añadir etiquetas y leyendas
Introducción a la ciencia de datos con Python

Hillary Green-Lerman
Lead Data Scientist, Looker
¿Qué acabamos de trazar?
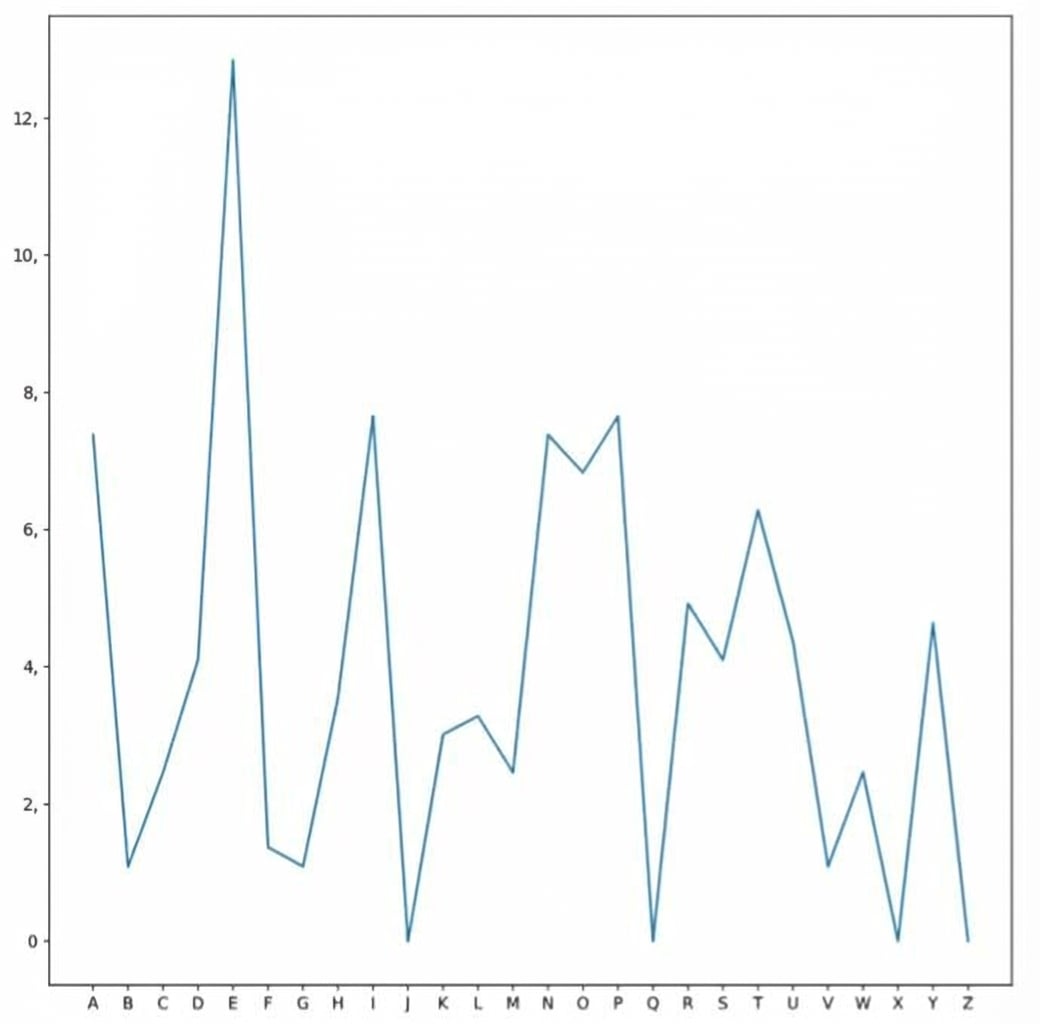
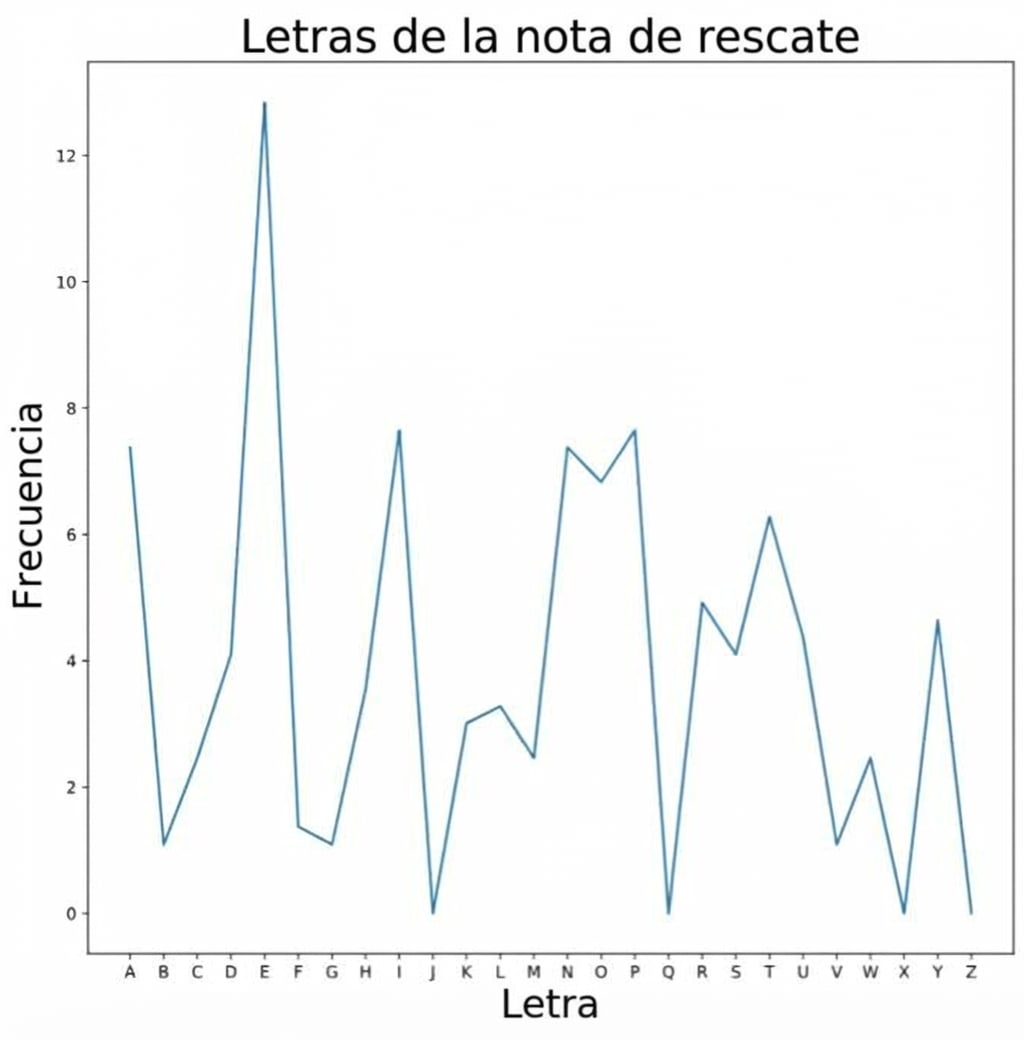
Etiquetas de ejes y título
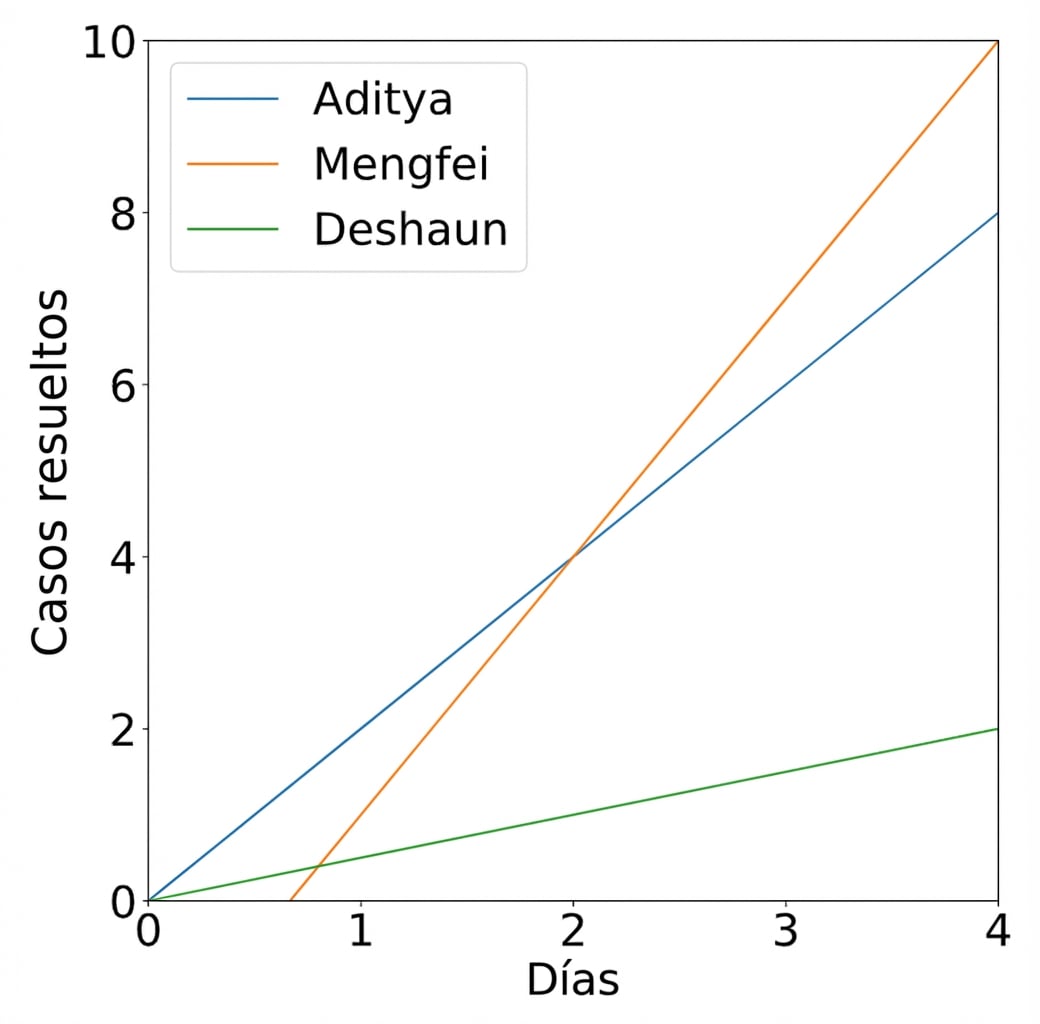
Leyendas
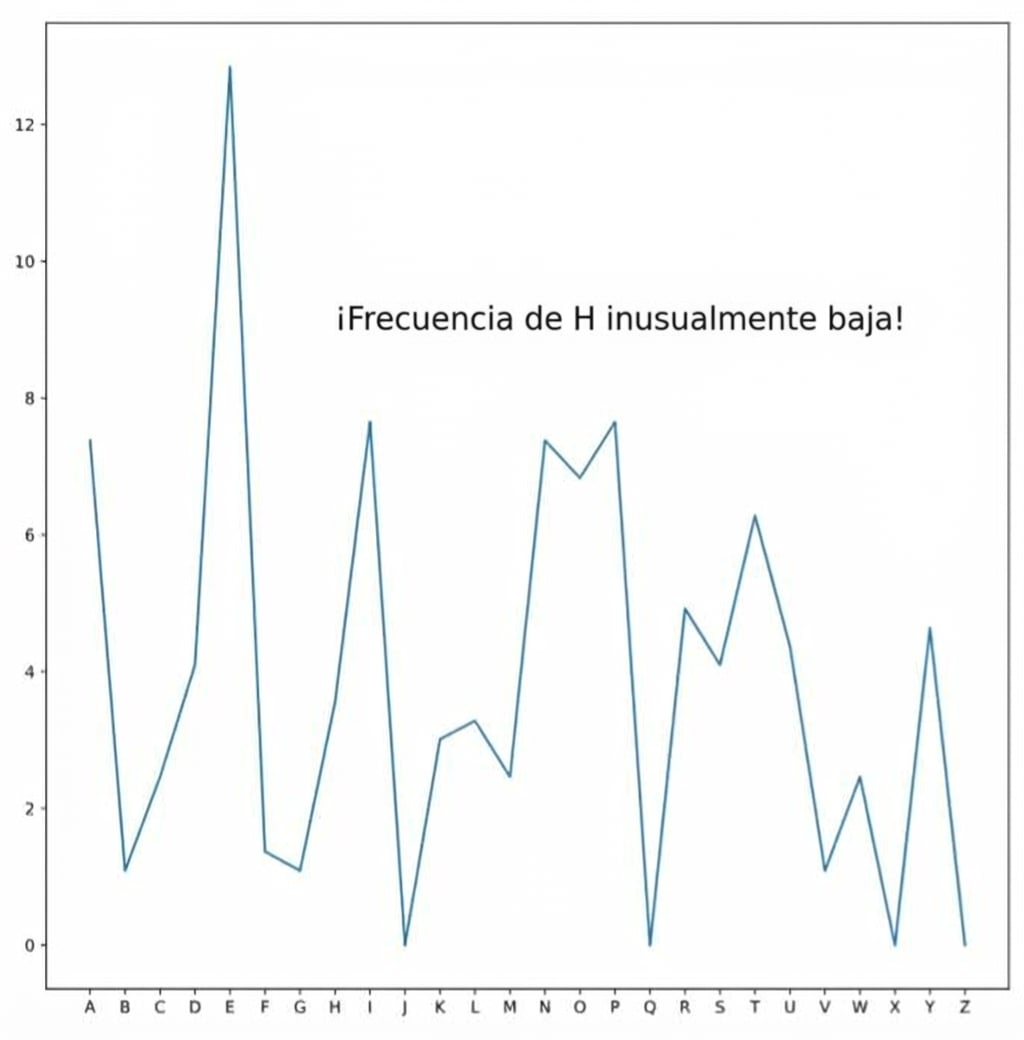
Texto arbitrario
Introducción a la ciencia de datos con Python
Hillary Green-Lerman
Lead Data Scientist, Looker

