¿Qué es pandas?
Introducción a la ciencia de datos con Python

Hillary Green-Lerman
Lead Data Scientist, Looker
¿Qué puede hacer pandas por ti?
- Cargar datos tabulares de varias fuentes
- Buscar filas o columnas concretas
- Calcular estadísticas agregadas
- Combinar datos de varias fuentes
Datos tabulares con pandas
Datos tabulares
+-------------------------------------------------+
|        suspect        |     location    | price |
+-----------------------+-----------------+-------+
| Fred Frequentist      | Petroleum Plaza | 24.95 |
| Ronald Aylmer Fisher  | Clothing Club   | 20.15 |
+-------------------------------------------------+
DataFrame
                suspect        location  price
0      Fred Frequentist  Perolium Plaza  24.95
1  Ronald Aylmer Fisher   Clothing Club  20.15
Archivos CSV
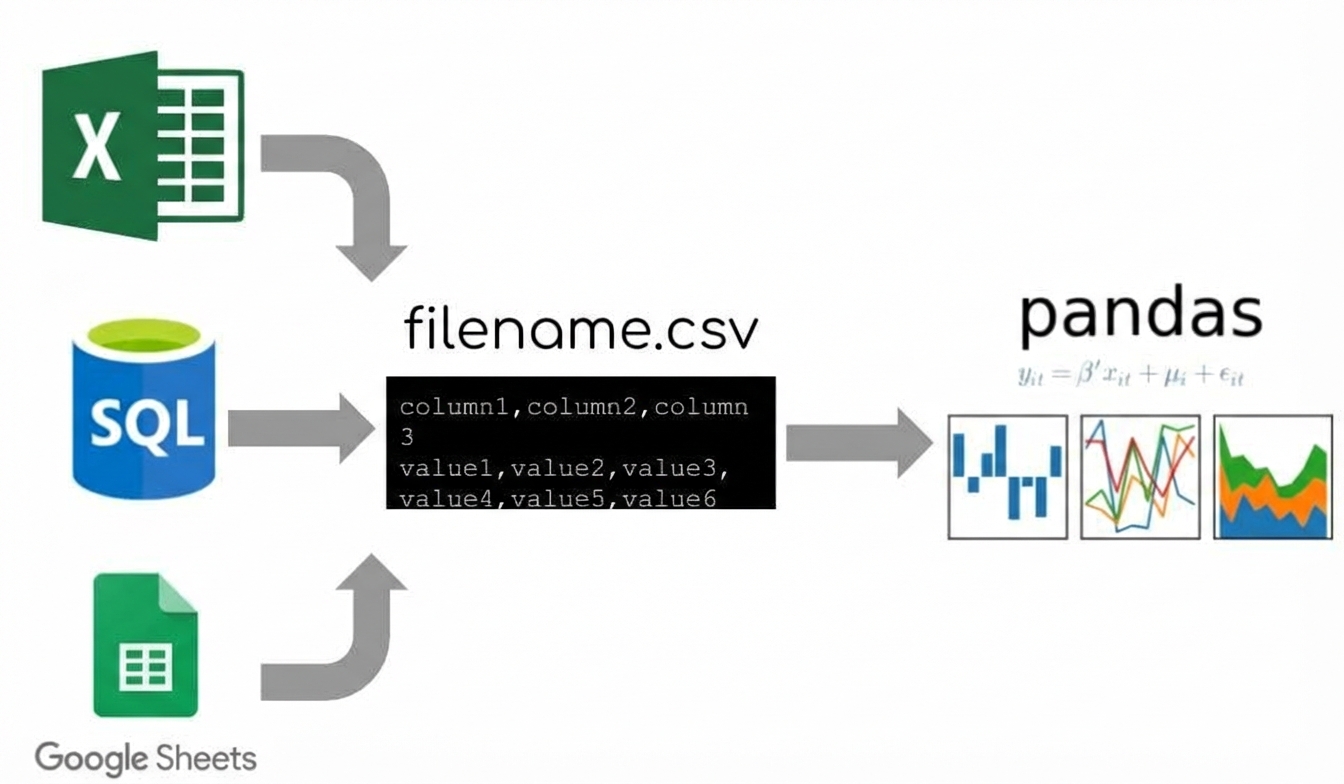
Cargar un CSV
import pandas as pd
df = pd.read_csv('ransom.csv')
Mostrar un DataFrame
df = pd.read_csv('filename.csv')print(df)
                 suspect         location          item  price
0         Kirstine Smith  Petroleum Plaza           gas  24.95
1       Fred Frequentist      Burger Mart         fries   1.95
2           Gertrude Cox      Burger Mart         fries   1.95
3   Ronald Aylmer Fisher    Clothing Club         shirt  14.25
4         Kirstine Smith    Clothing Club         dress  20.15
5       Fred Frequentist   Groceries R Us     cucumbers   2.05
6         Kirstine Smith    Clothing Club         dress  20.15
7           Gertrude Cox  Petroleum Plaza   fizzy drink   1.90
8           Gertrude Cox      Burger Mart         fries   1.95
9   Ronald Aylmer Fisher    Clothing Club         shirt  14.25
10  Ronald Aylmer Fisher  Petroleum Plaza       carwash  13.25
11  Ronald Aylmer Fisher    Clothing Club         shirt  14.25
12        Kirstine Smith  Petroleum Plaza           gas  24.95
13      Fred Frequentist   Groceries R Us          eggs   6.50
14          Gertrude Cox  Petroleum Plaza           gas  24.95
15      Fred Frequentist   Groceries R Us          eggs   6.50
16  Ronald Aylmer Fisher   Groceries R Us          eggs   6.50
17      Fred Frequentist   Groceries R Us        cheese   5.00
Inspeccionar un DataFrame
df.head()
print(df.head())
                 suspect         location          item  price
0         Kirstine Smith  Petroleum Plaza           gas  24.95
1       Fred Frequentist      Burger Mart         fries   1.95
2           Gertrude Cox      Burger Mart         fries   1.95
3   Ronald Aylmer Fisher    Clothing Club         shirt  14.25
4         Kirstine Smith    Clothing Club         dress  20.15
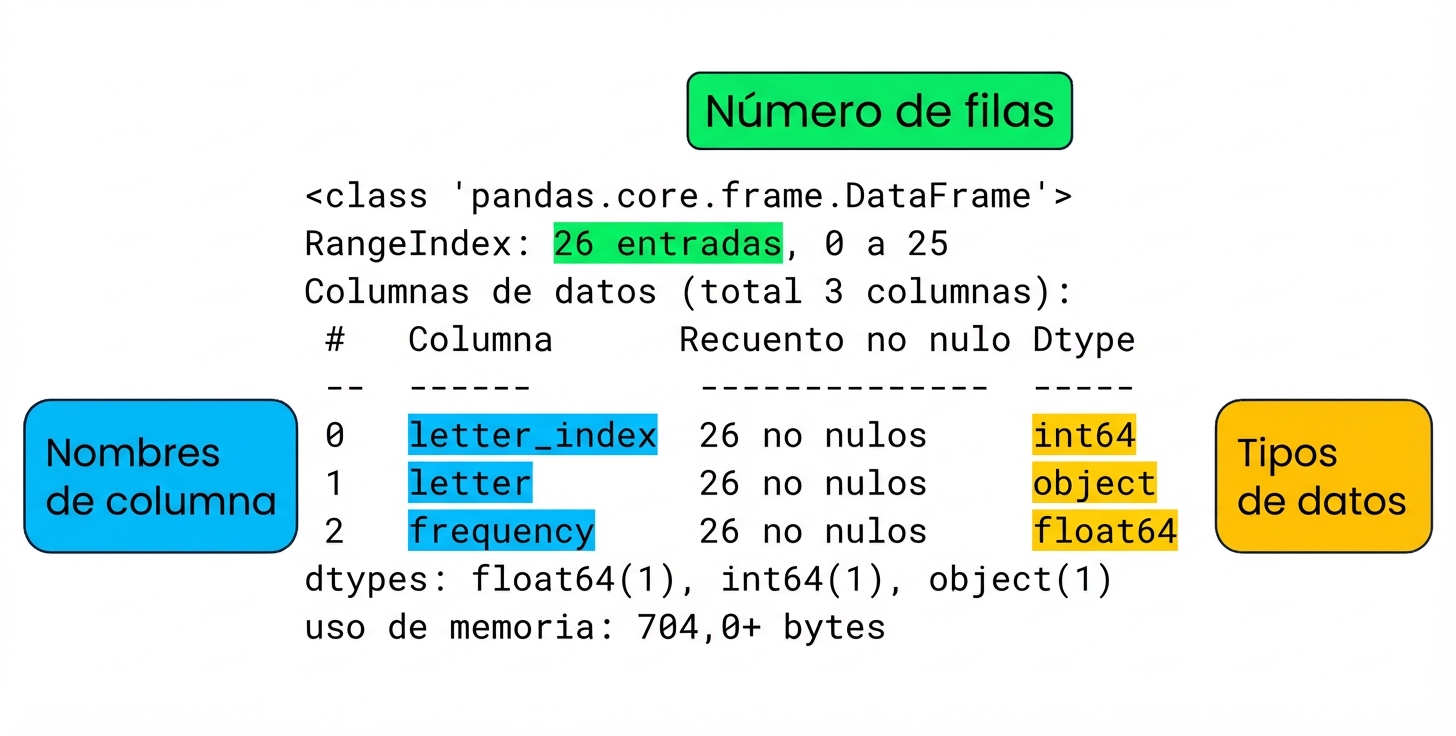
Inspeccionar un DataFrame
df.info()
print(df.info())
<class 'pandas.core.frame.DataFrame'>
RangeIndex: 26 entries, 0 to 25
Data columns (total 3 columns):
 #   Column        Non-Null Count  Dtype
 --  ------        --------------  -----
 0   letter_index  26 non-null     int64
  1   letter        26 non-null     object
 2   frequency     26 non-null     float64
dtypes: float64(1), int64(1), object(1)
memory usage: 704.0+ bytes
Inspeccionar un DataFrame
¡Vamos a practicar!
Introducción a la ciencia de datos con Python

