Crear un diagrama de dispersión
Introducción a la ciencia de datos con Python

Hillary Green-Lerman
Lead Data Scientist, Looker
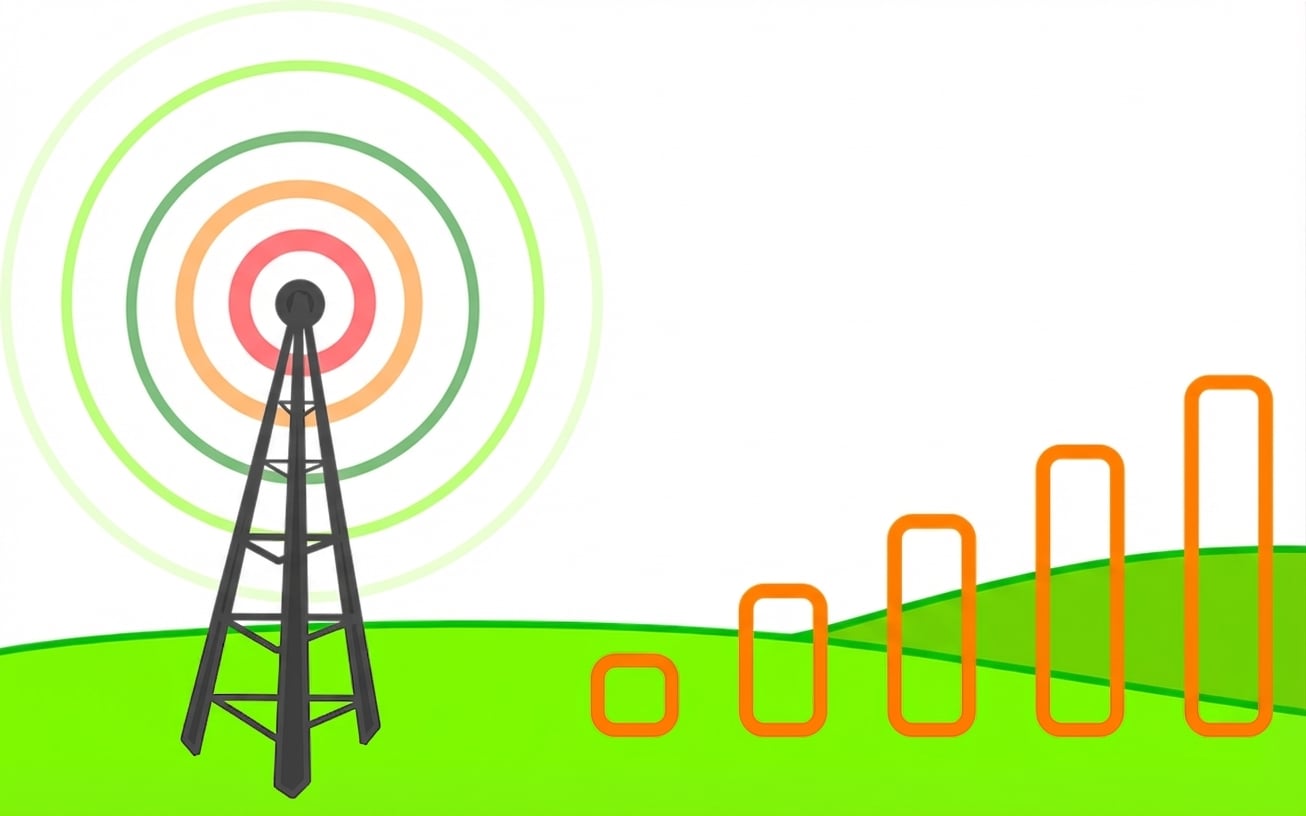
Mapear señales de móvil
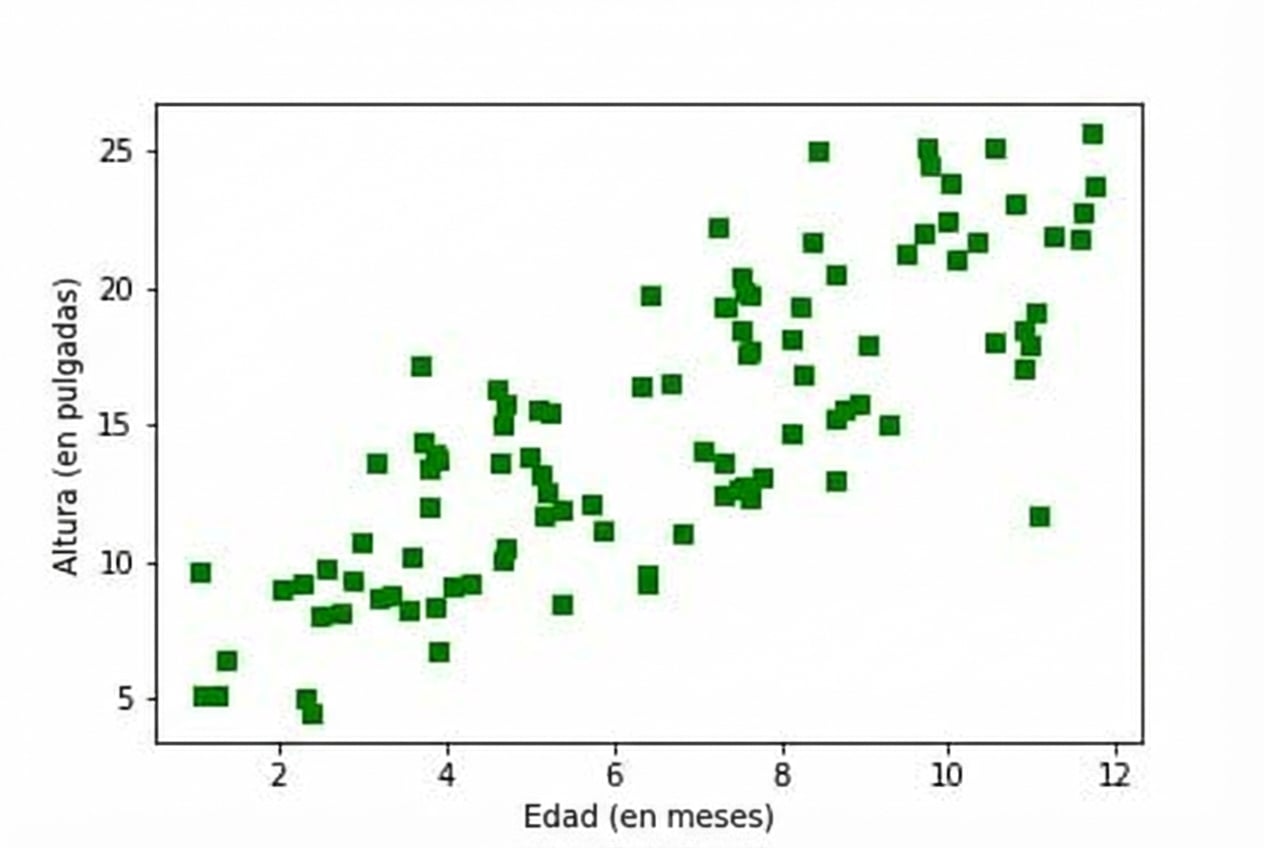
¿Qué es un diagrama de dispersión?
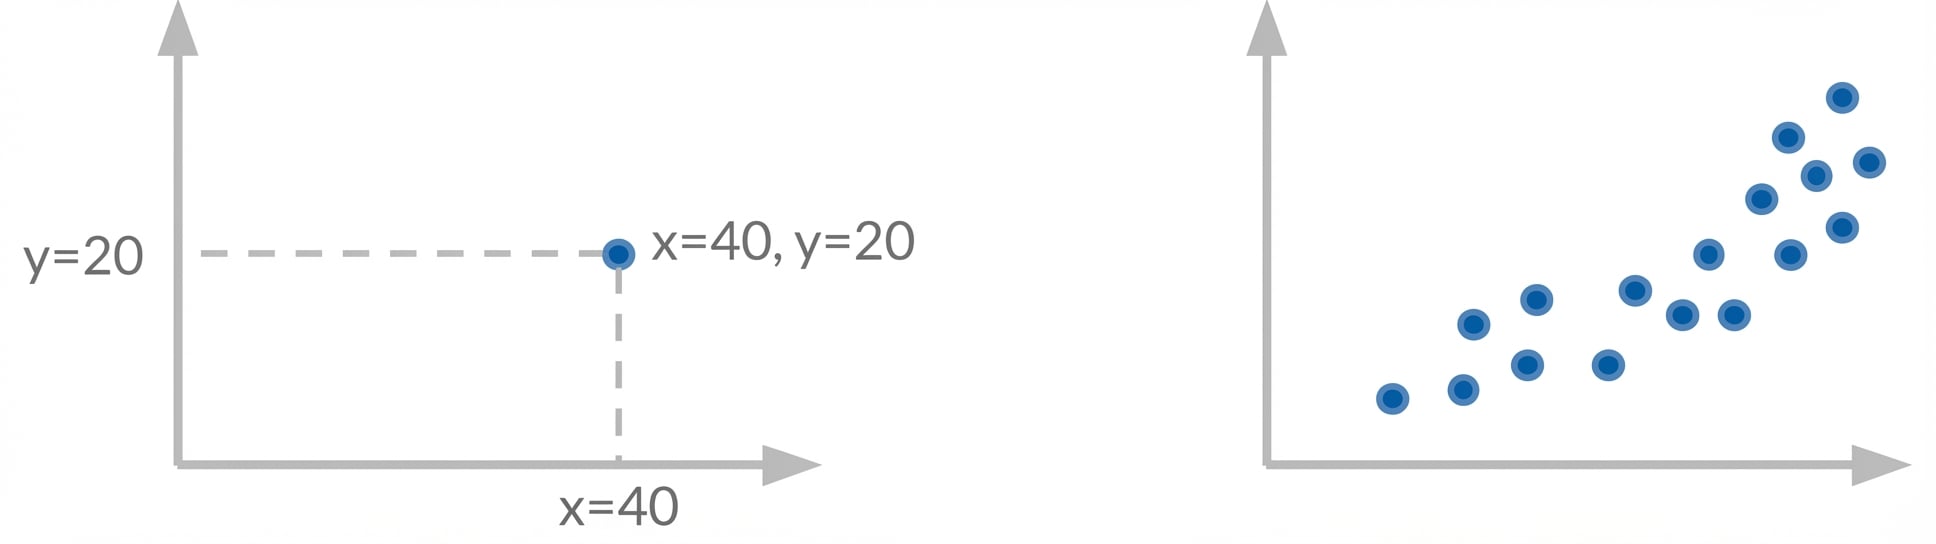
¿Qué es un diagrama de dispersión?
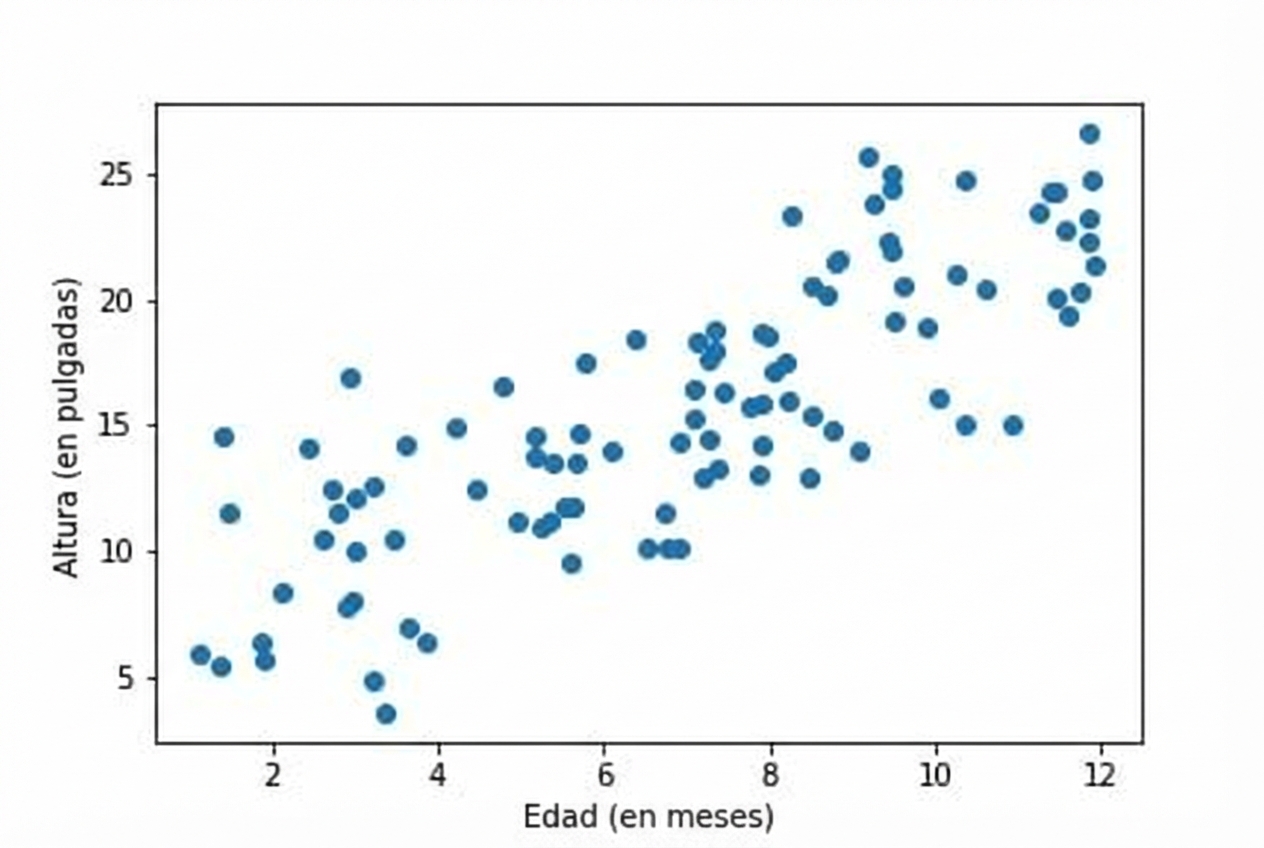
Crear un diagrama de dispersión
Argumentos con nombre
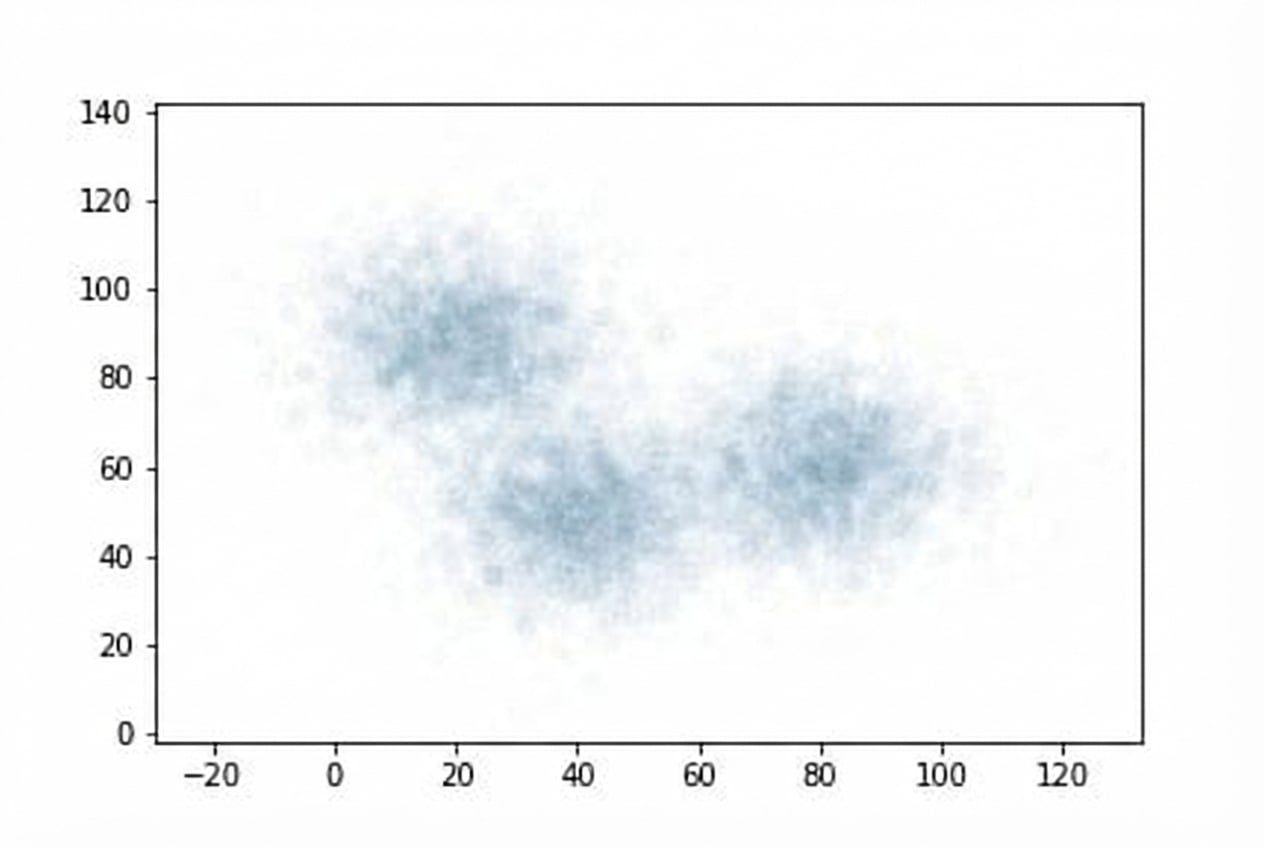
Cambiar la transparencia del marcador
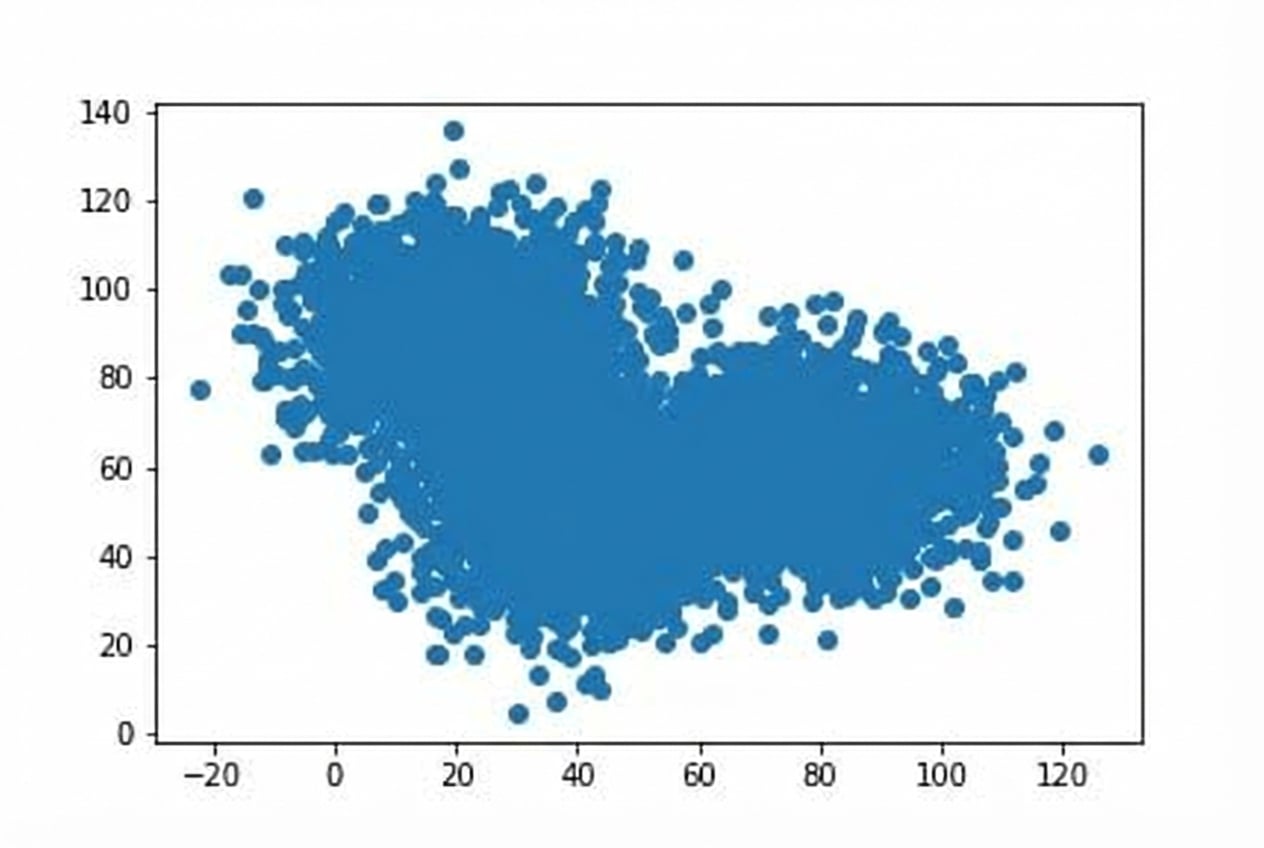
plt.scatter(df.x_data,
            df.y_data,
            alpha=0.1)