Predicting data over time

Machine Learning for Time Series Data in Python

Chris Holdgraf

Fellow, Berkeley Institute for Data Science

Classification vs. Regression

Classification
classification_model.predict(X_test)
array([0, 1, 1, 0])
Regression
regression_model.predict(X_test)
array([0.2, 1.4, 3.6, 0.6])
Machine Learning for Time Series Data in Python

Correlation and regression

  • Regression is similar to calculating correlation, with some key differences
    • Regression: A process that results in a formal model of the data
    • Correlation: A statistic that describes the data. Less information than regression model.
Machine Learning for Time Series Data in Python

Correlation between variables often changes over time

  • Timeseries often have patterns that change over time
  • Two timeseries that seem correlated at one moment may not remain so over time
Machine Learning for Time Series Data in Python

Visualizing relationships between timeseries

fig, axs = plt.subplots(1, 2)

# Make a line plot for each timeseries
axs[0].plot(x, c='k', lw=3, alpha=.2)
axs[0].plot(y)
axs[0].set(xlabel='time', title='X values = time')

# Encode time as color in a scatterplot
axs[1].scatter(x_long, y_long, c=np.arange(len(x_long)), cmap='viridis')
axs[1].set(xlabel='x', ylabel='y', title='Color = time')
Machine Learning for Time Series Data in Python

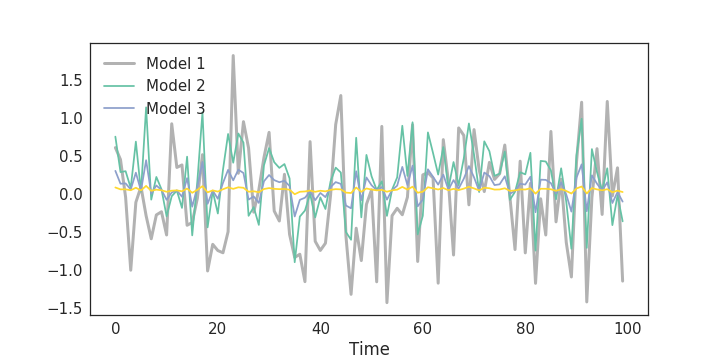
Visualizing two timeseries

Machine Learning for Time Series Data in Python

Regression models with scikit-learn

from sklearn.linear_model import LinearRegression
model = LinearRegression()
model.fit(X, y)
model.predict(X)
Machine Learning for Time Series Data in Python

Visualize predictions with scikit-learn

alphas = [.1, 1e2, 1e3]
ax.plot(y_test, color='k', alpha=.3, lw=3)
for ii, alpha in enumerate(alphas):
    y_predicted = Ridge(alpha=alpha).fit(X_train, y_train).predict(X_test)
    ax.plot(y_predicted, c=cmap(ii / len(alphas)))
ax.legend(['True values', 'Model 1', 'Model 2', 'Model 3'])
ax.set(xlabel="Time")
Machine Learning for Time Series Data in Python

Visualize predictions with scikit-learn

Machine Learning for Time Series Data in Python

Scoring regression models

  • Two most common methods:
    • Correlation ($r$)
    • Coefficient of Determination ($R^2$)
Machine Learning for Time Series Data in Python

Coefficient of Determination ($R^2$)

  • The value of $R^2$ is bounded on the top by 1, and can be infinitely low
  • Values closer to 1 mean the model does a better job of predicting outputs

$$ 1 - \frac{error(model)}{variance(testdata)} $$

Machine Learning for Time Series Data in Python

$R^2$ in scikit-learn

from sklearn.metrics import r2_score
print(r2_score(y_predicted, y_test))
0.08
Machine Learning for Time Series Data in Python

Let's practice!

Machine Learning for Time Series Data in Python

Preparing Video For Download...