Cleaning and improving your data
Machine Learning for Time Series Data in Python

Chris Holdgraf
Fellow, Berkeley Institute for Data Science
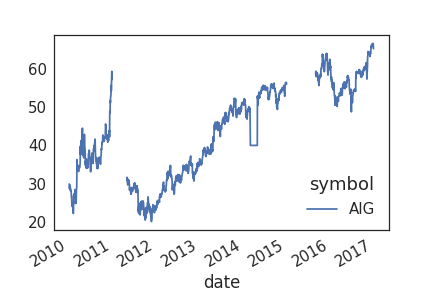
What messy data looks like
Visualizing the interpolated data
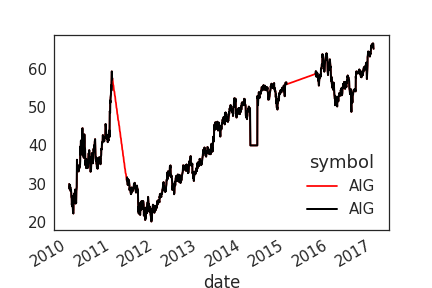
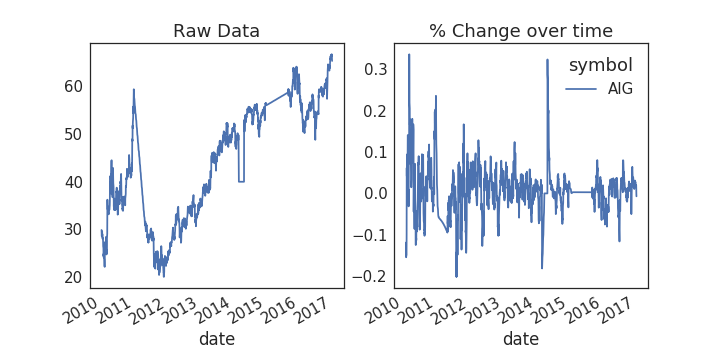
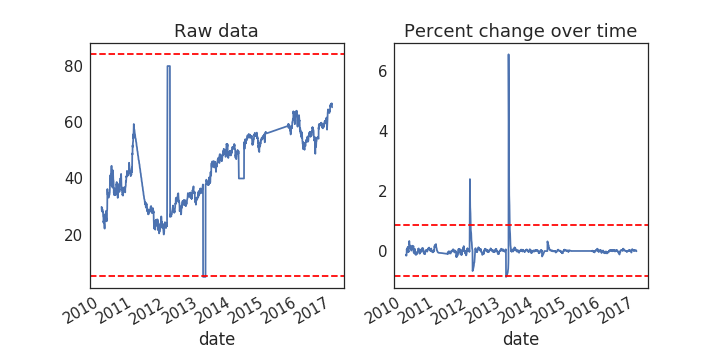
Applying this to our data
# Plot the raw data
fig, axs = plt.subplots(1, 2, figsize=(10, 5))
ax = prices.plot(ax=axs[0])

# Calculate % change and plot
ax = prices.rolling(window=20).aggregate(percent_change).plot(ax=axs[1])
ax.legend_.set_visible(False)
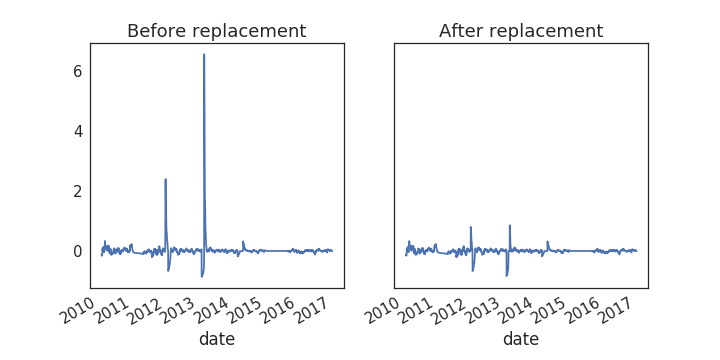
Visualizing outlier thresholds
Visualize the results
fig, axs = plt.subplots(1, 2, figsize=(10, 5))
prices_outlier_centered.plot(ax=axs[0])
prices_outlier_fixed.plot(ax=axs[1])