Stationarity and stability
Machine Learning for Time Series Data in Python

Chris Holdgraf
Fellow, Berkeley Institute for Data Science
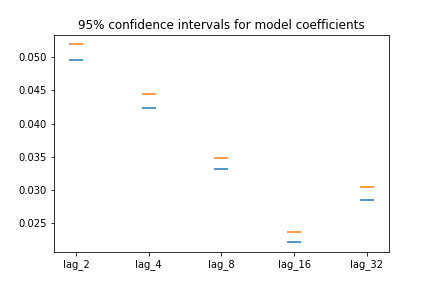
Plotting the bootstrapped coefficients
fig, ax = plt.subplots()
ax.scatter(many_shifts.columns, percentiles[0], marker='_', s=200)
ax.scatter(many_shifts.columns, percentiles[1], marker='_', s=200)
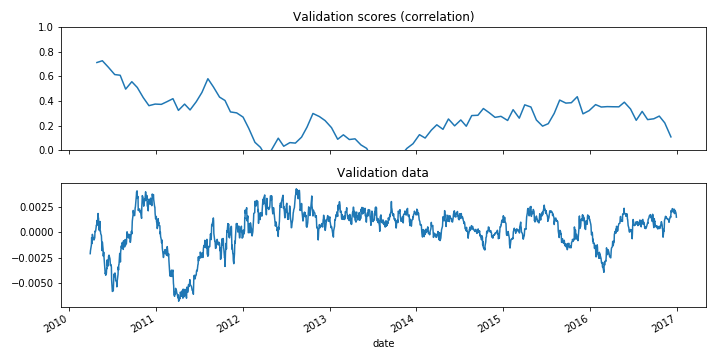
Visualizing model scores
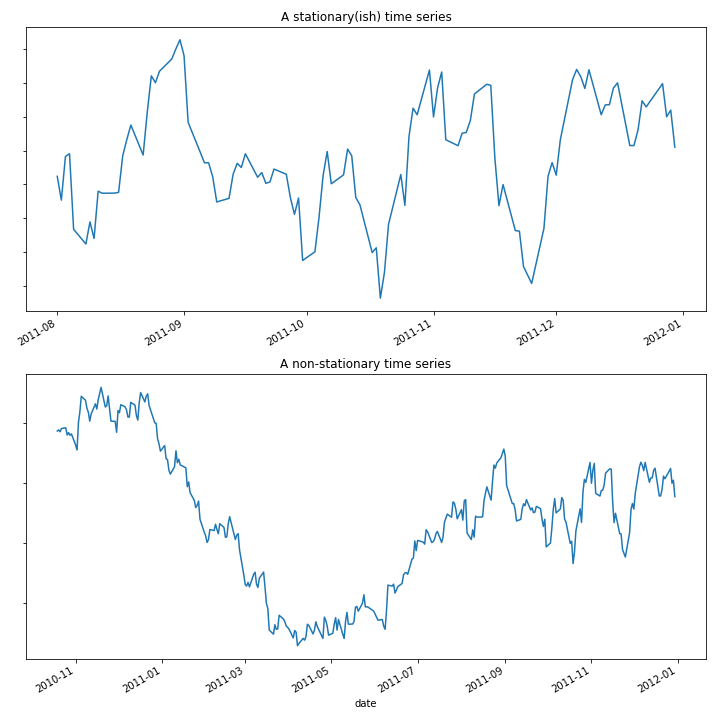
Non-stationary signals


