Time-delayed features and auto-regressive models

Machine Learning for Time Series Data in Python

Chris Holdgraf

Fellow, Berkeley Institute for Data Science

The past is useful

  • Timeseries data almost always have information that is shared between timepoints
  • Information in the past can help predict what happens in the future
  • Often the features best-suited to predict a timeseries are previous values of the same timeseries.
Machine Learning for Time Series Data in Python

A note on smoothness and auto-correlation

  • A common question to ask of a timeseries: how smooth is the data.
  • AKA, how correlated is a timepoint with its neighboring timepoints (called autocorrelation).
  • The amount of auto-correlation in data will impact your models.
Machine Learning for Time Series Data in Python

Creating time-lagged features

  • Let's see how we could build a model that uses values in the past as input features.
  • We can use this to assess how auto-correlated our signal is (and lots of other stuff too)
Machine Learning for Time Series Data in Python

Time-shifting data with Pandas

print(df)
         df 
    0   0.0
    1   1.0 
    2   2.0 
    3   3.0 
    4   4.0 
# Shift a DataFrame/Series by 3 index values towards the past
print(df.shift(3))
         df
    0   NaN
    1   NaN
    2   NaN
    3   0.0
    4   1.0
Machine Learning for Time Series Data in Python

Creating a time-shifted DataFrame

# data is a pandas Series containing time series data
data = pd.Series(...)

# Shifts
shifts = [0, 1, 2, 3, 4, 5, 6, 7]

# Create a dictionary of time-shifted data
many_shifts = {'lag_{}'.format(ii): data.shift(ii) for ii in shifts}

# Convert them into a dataframe
many_shifts = pd.DataFrame(many_shifts)
Machine Learning for Time Series Data in Python

Fitting a model with time-shifted features

# Fit the model using these input features 
model = Ridge() 
model.fit(many_shifts, data)
Machine Learning for Time Series Data in Python

Interpreting the auto-regressive model coefficients

# Visualize the fit model coefficients
fig, ax = plt.subplots()
ax.bar(many_shifts.columns, model.coef_)
ax.set(xlabel='Coefficient name', ylabel='Coefficient value')

# Set formatting so it looks nice
plt.setp(ax.get_xticklabels(), rotation=45, horizontalalignment='right')
Machine Learning for Time Series Data in Python

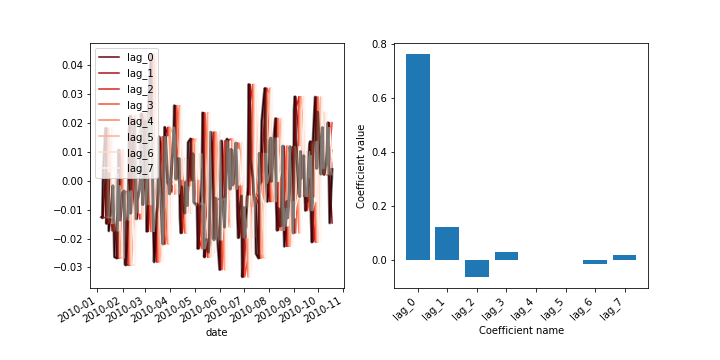
Visualizing coefficients for a rough signal

Machine Learning for Time Series Data in Python

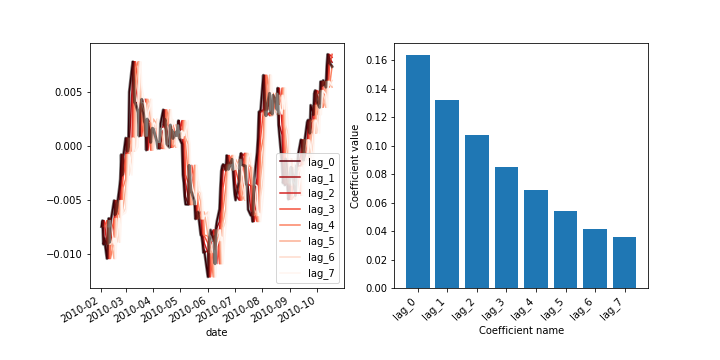
Visualizing coefficients for a smooth signal

Machine Learning for Time Series Data in Python

Let's practice!

Machine Learning for Time Series Data in Python

Preparing Video For Download...