Regression
Machine Learning with PySpark

Andrew Collier
Data Scientist, Fathom Data
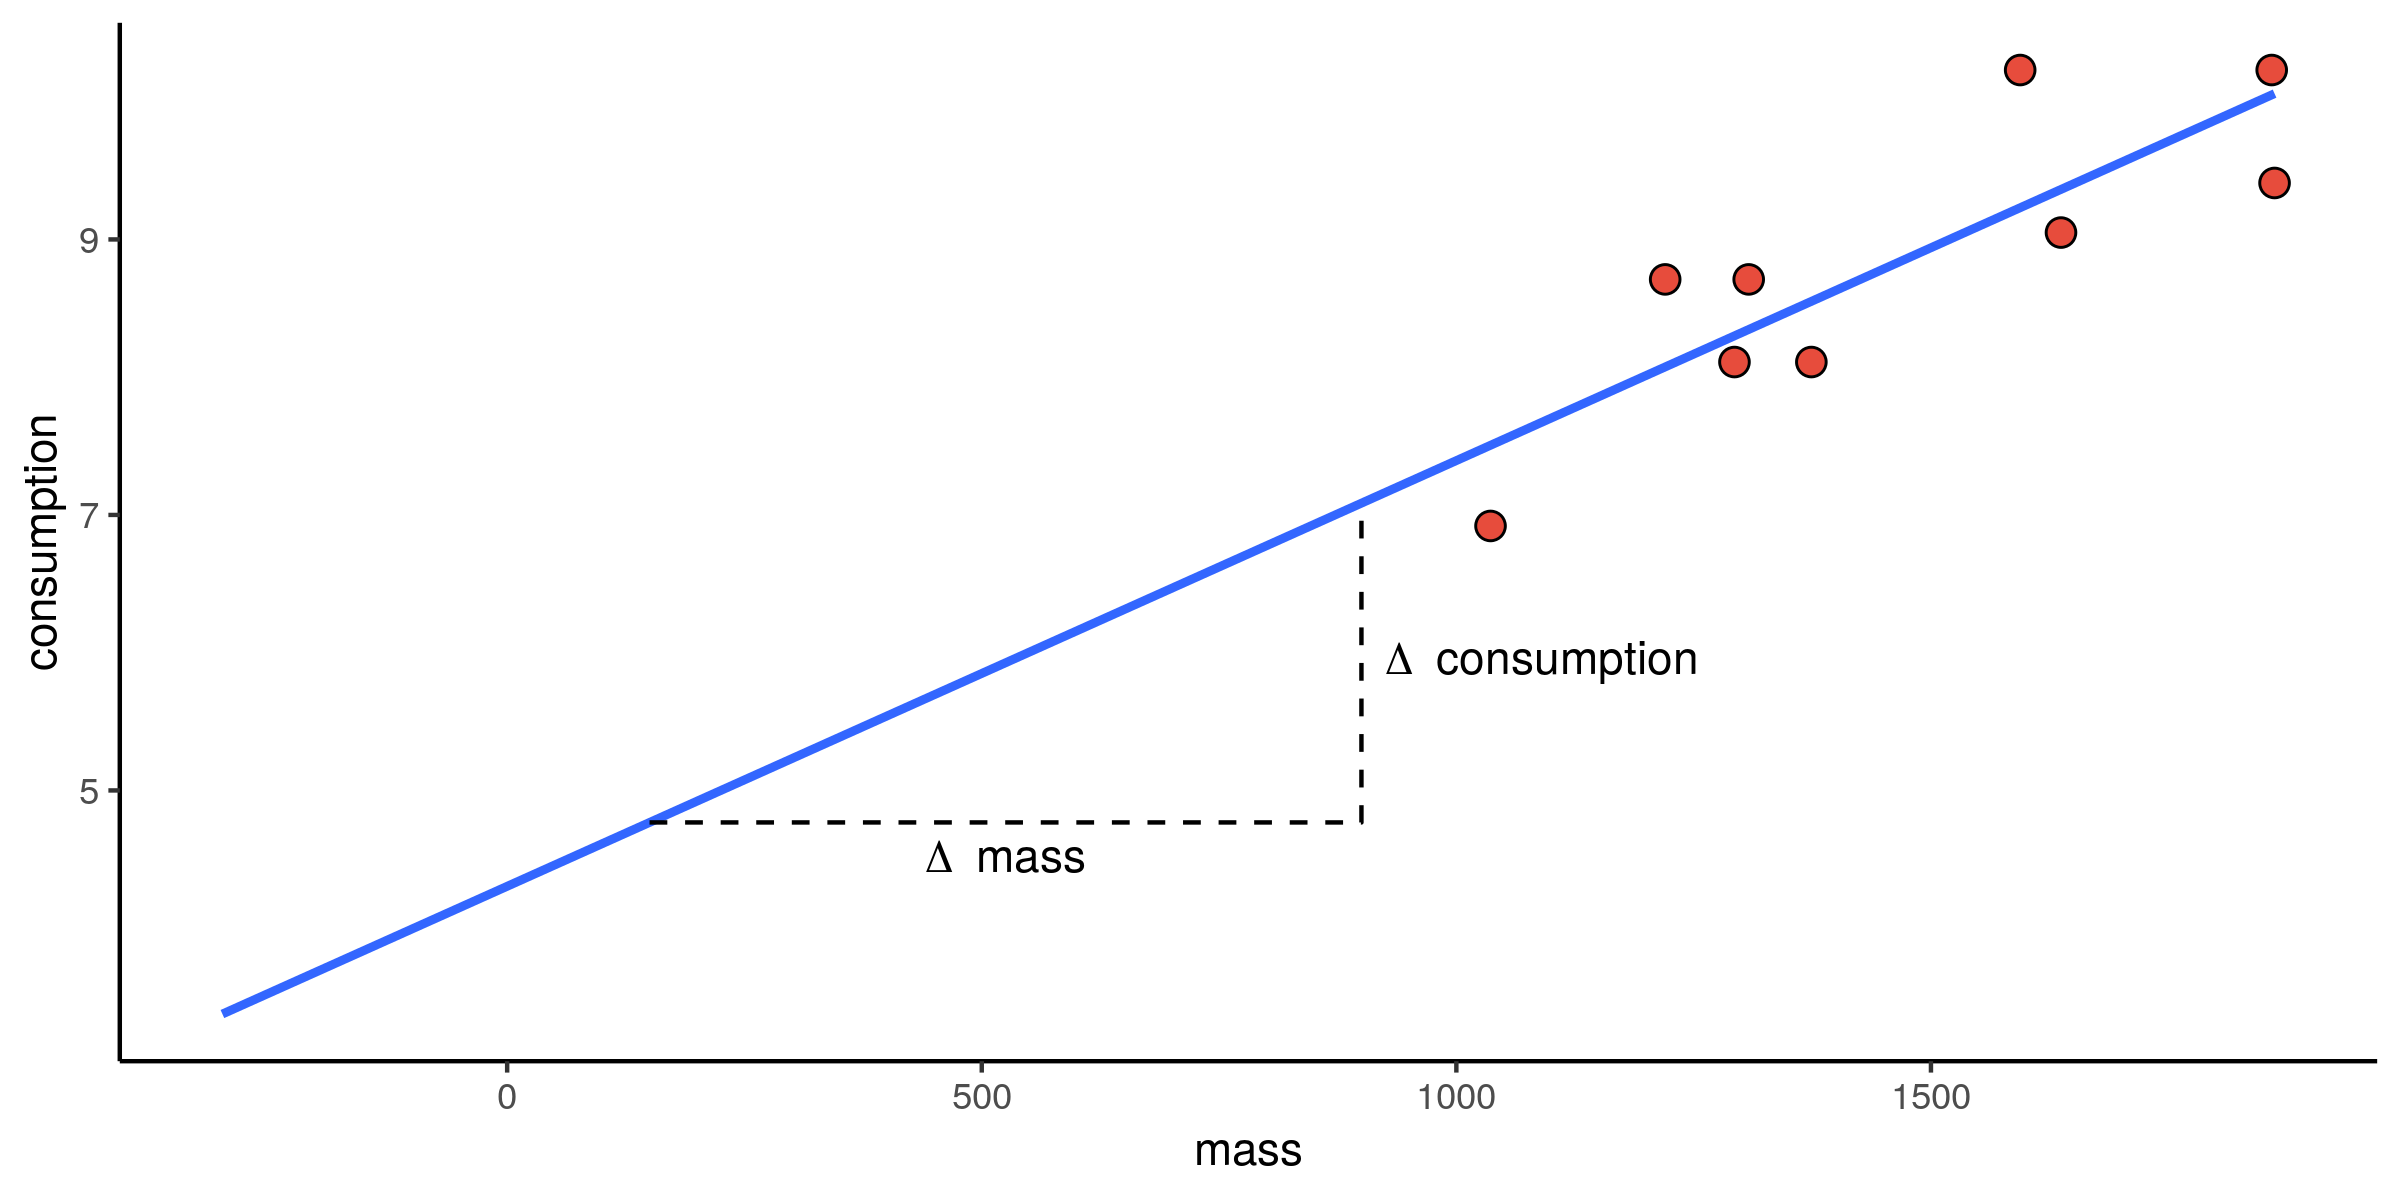
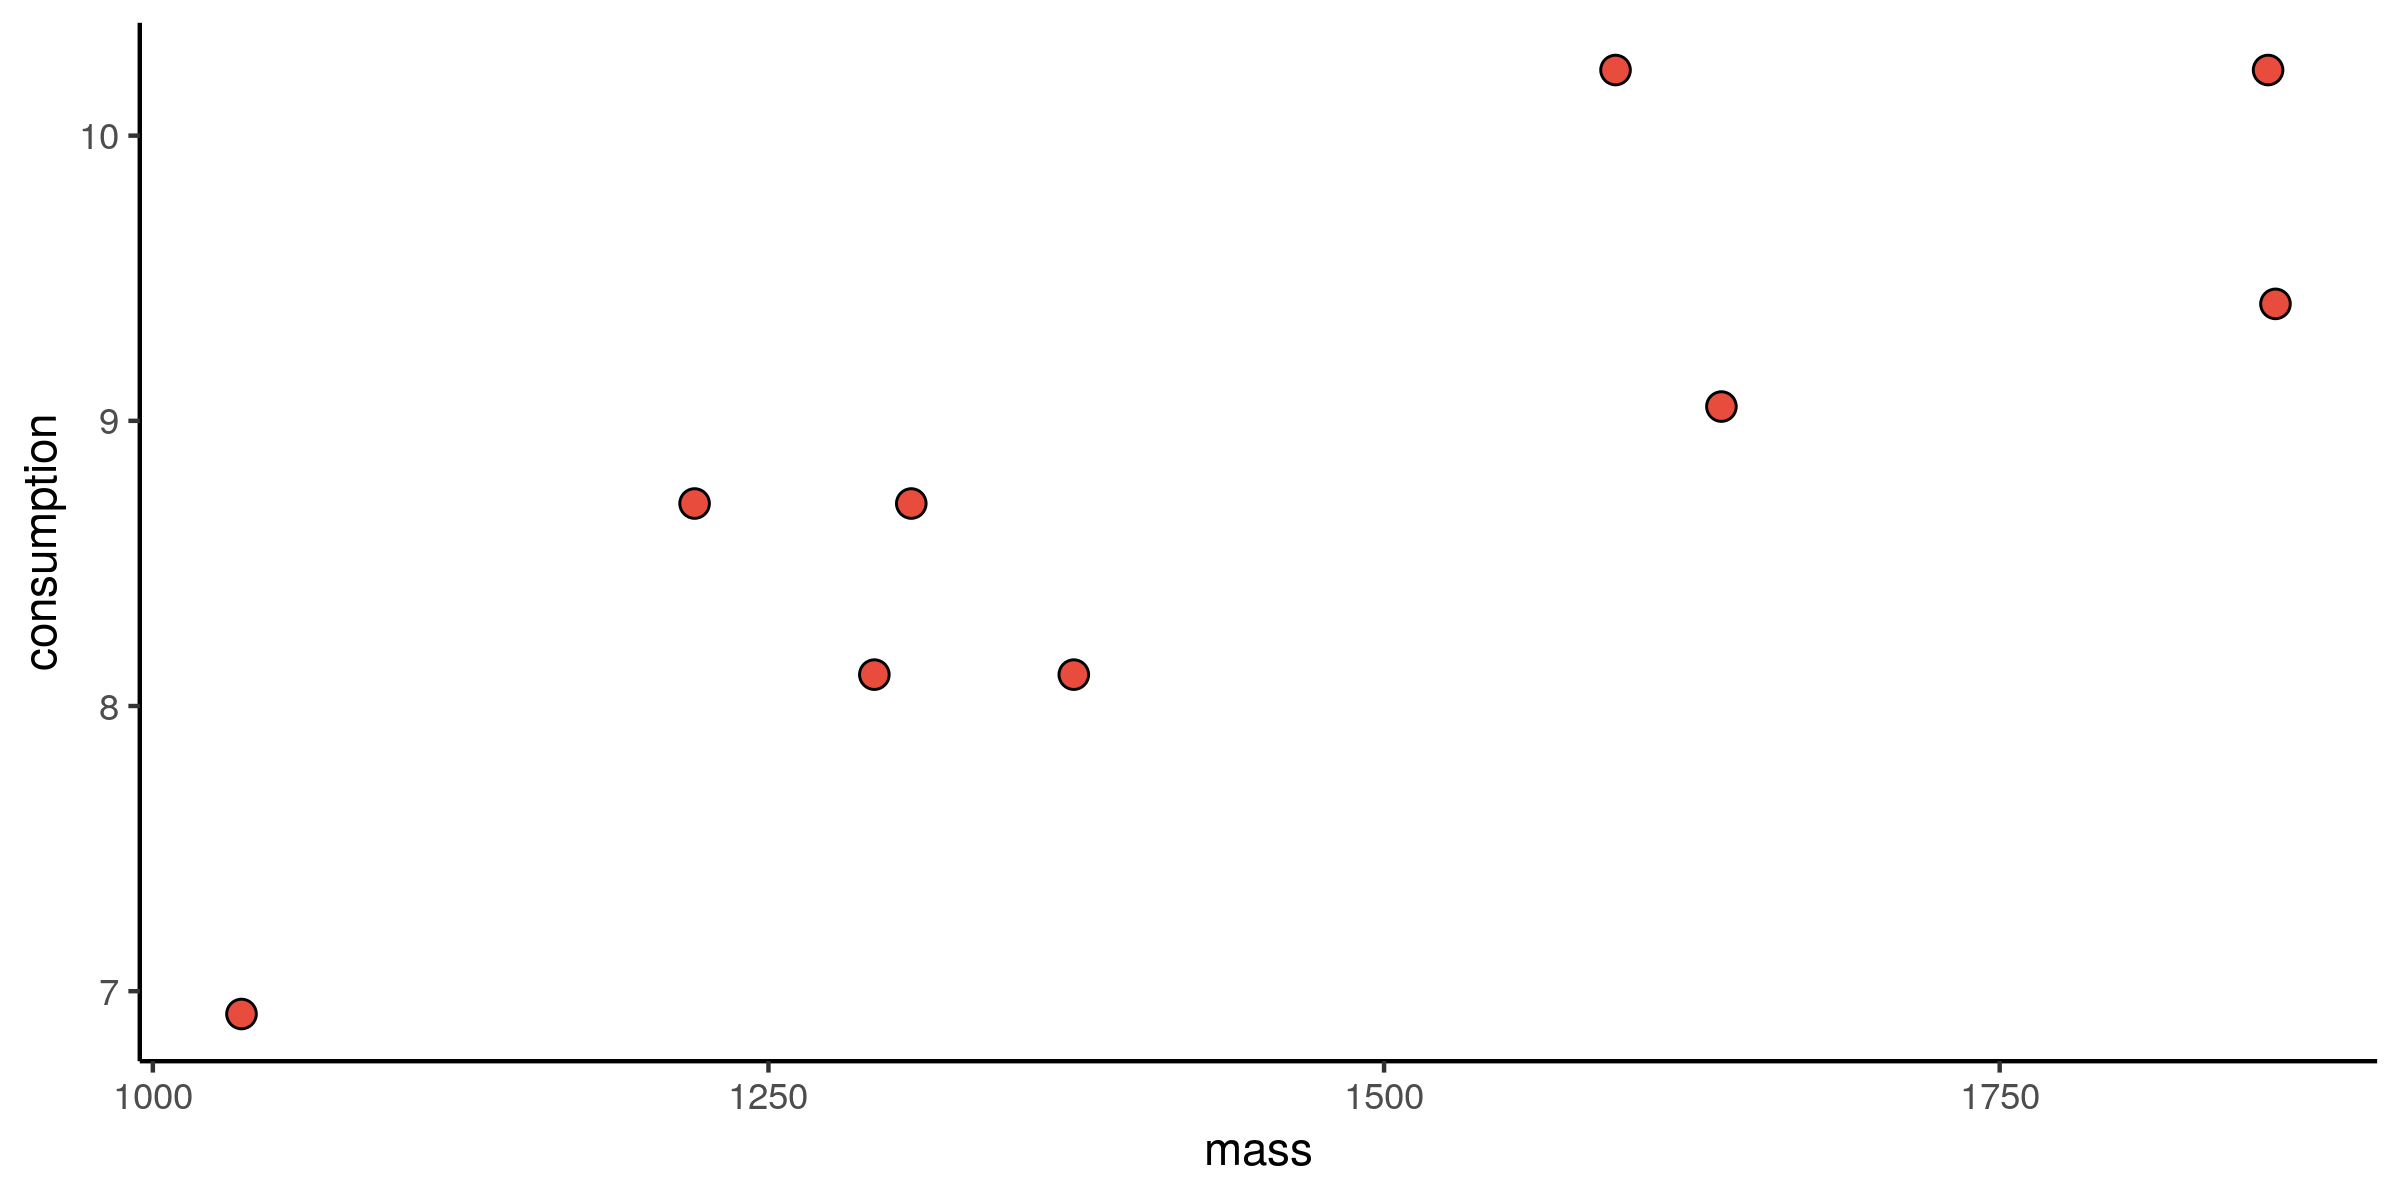
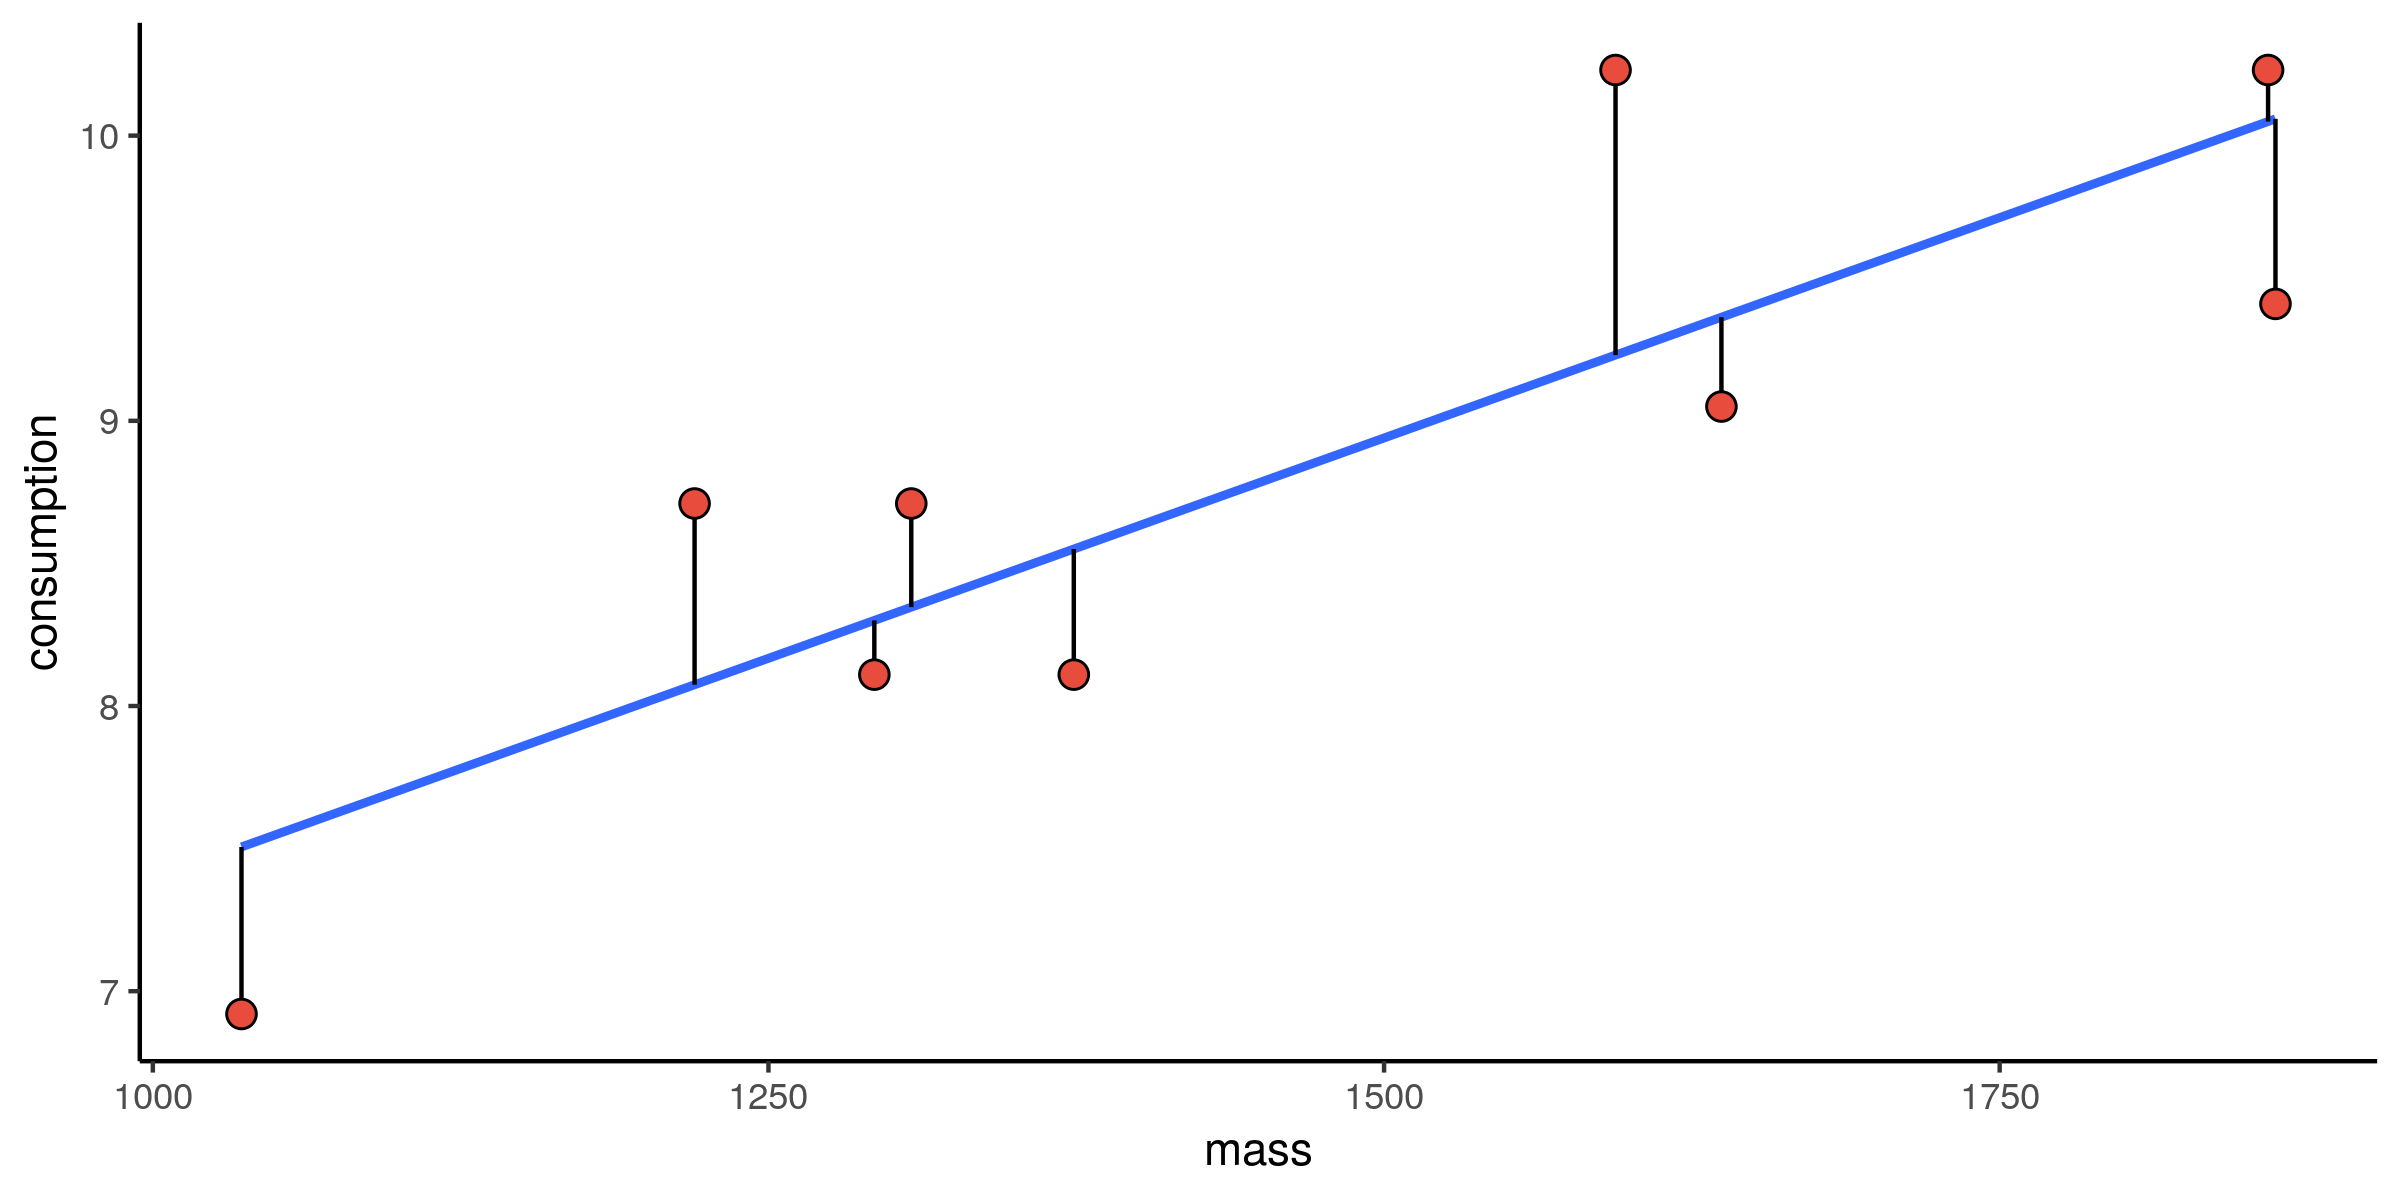
Consumption versus mass: scatter
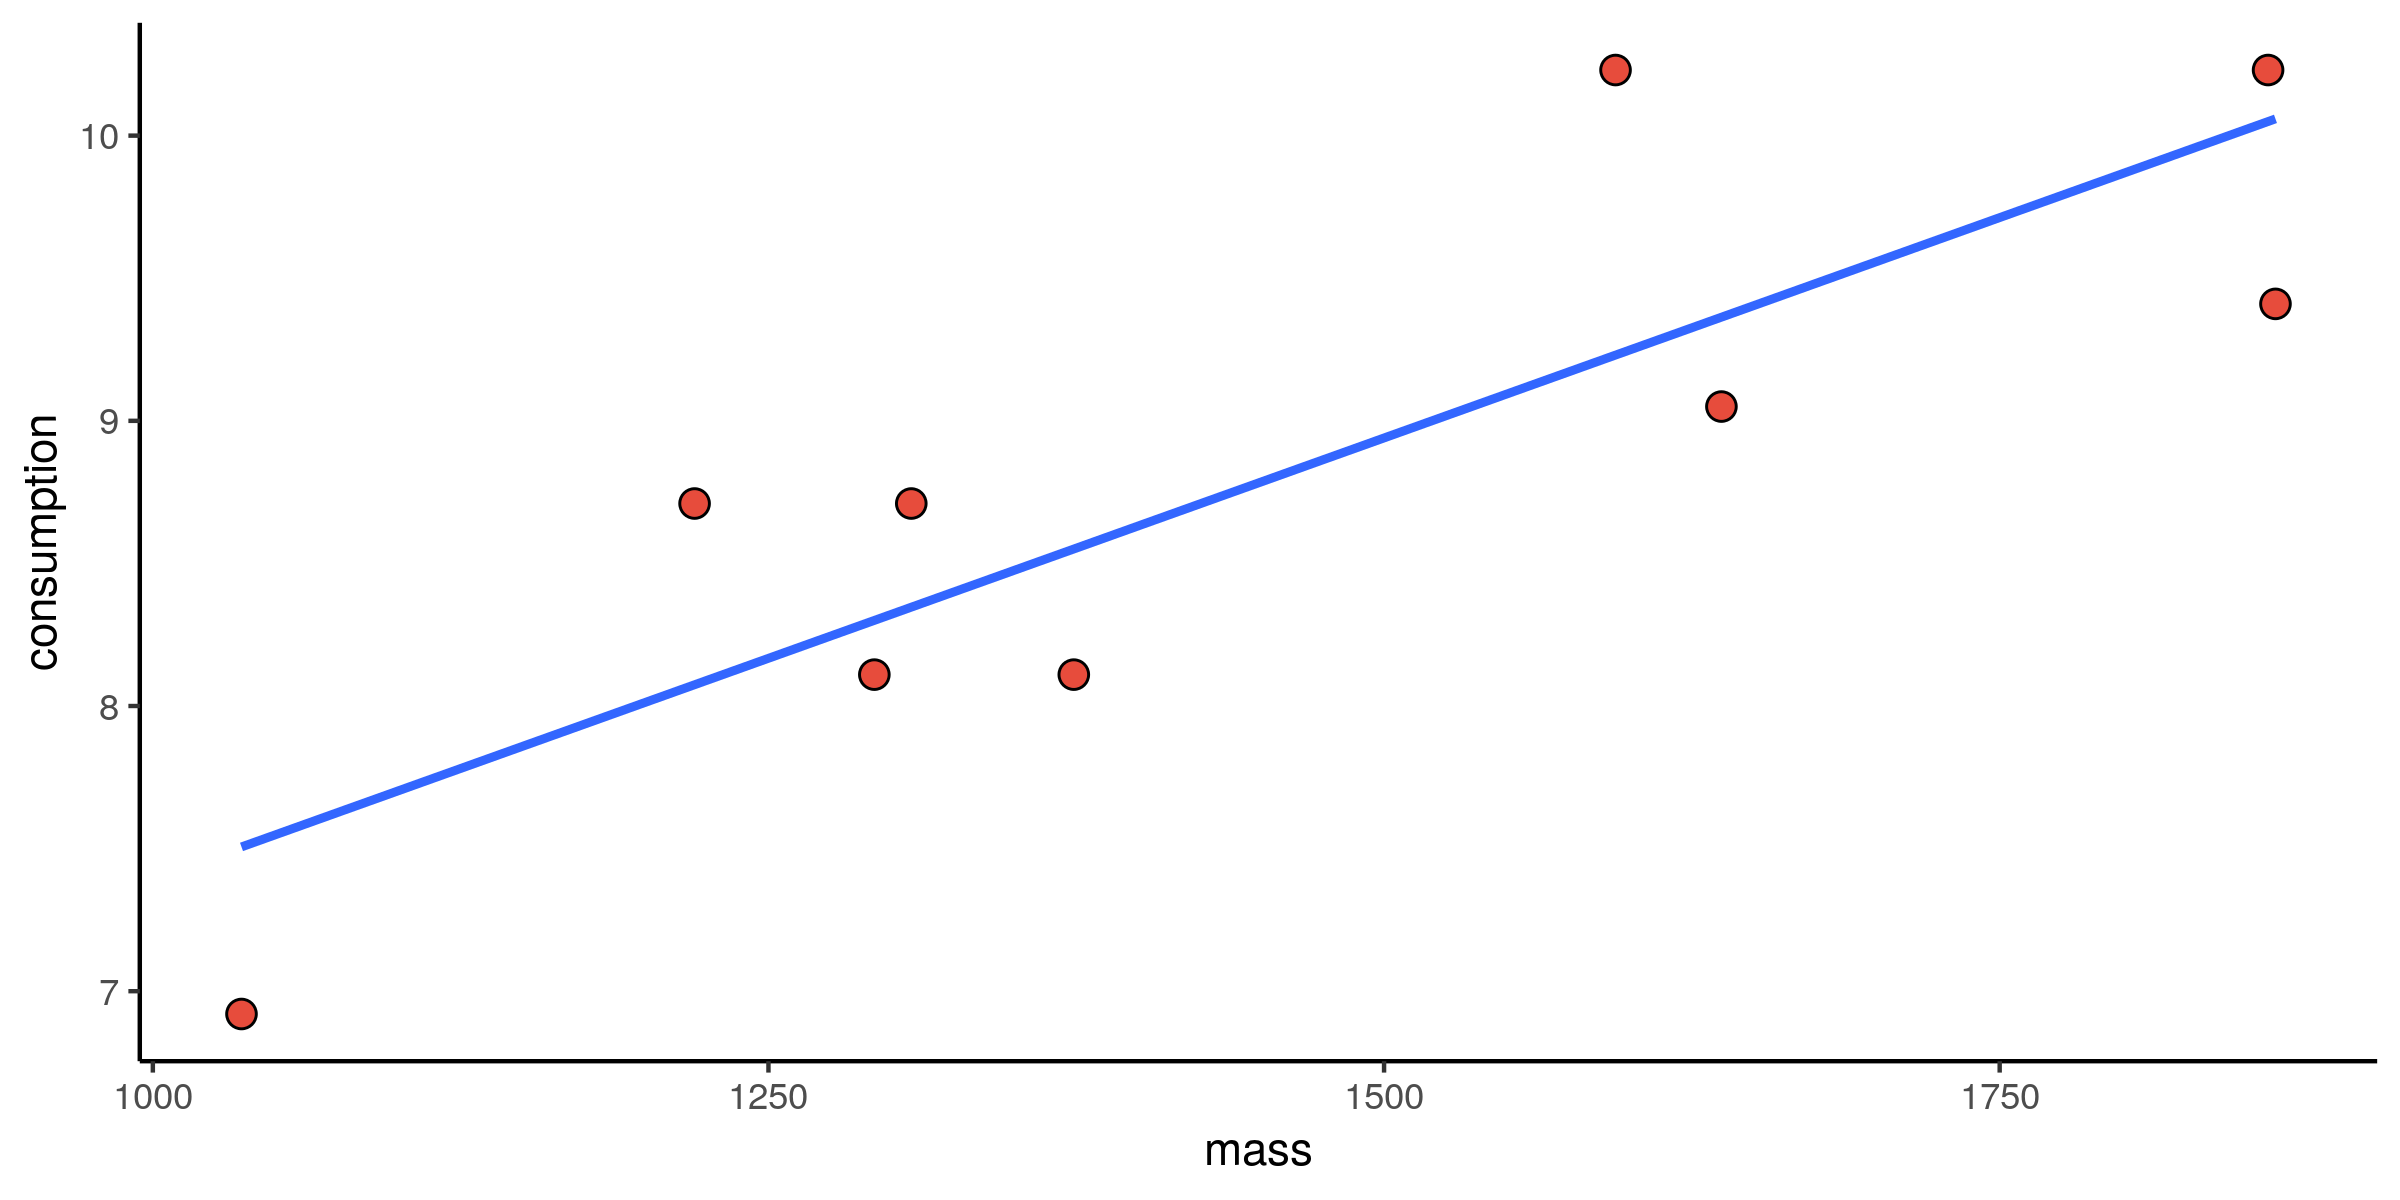
Consumption versus mass: fit
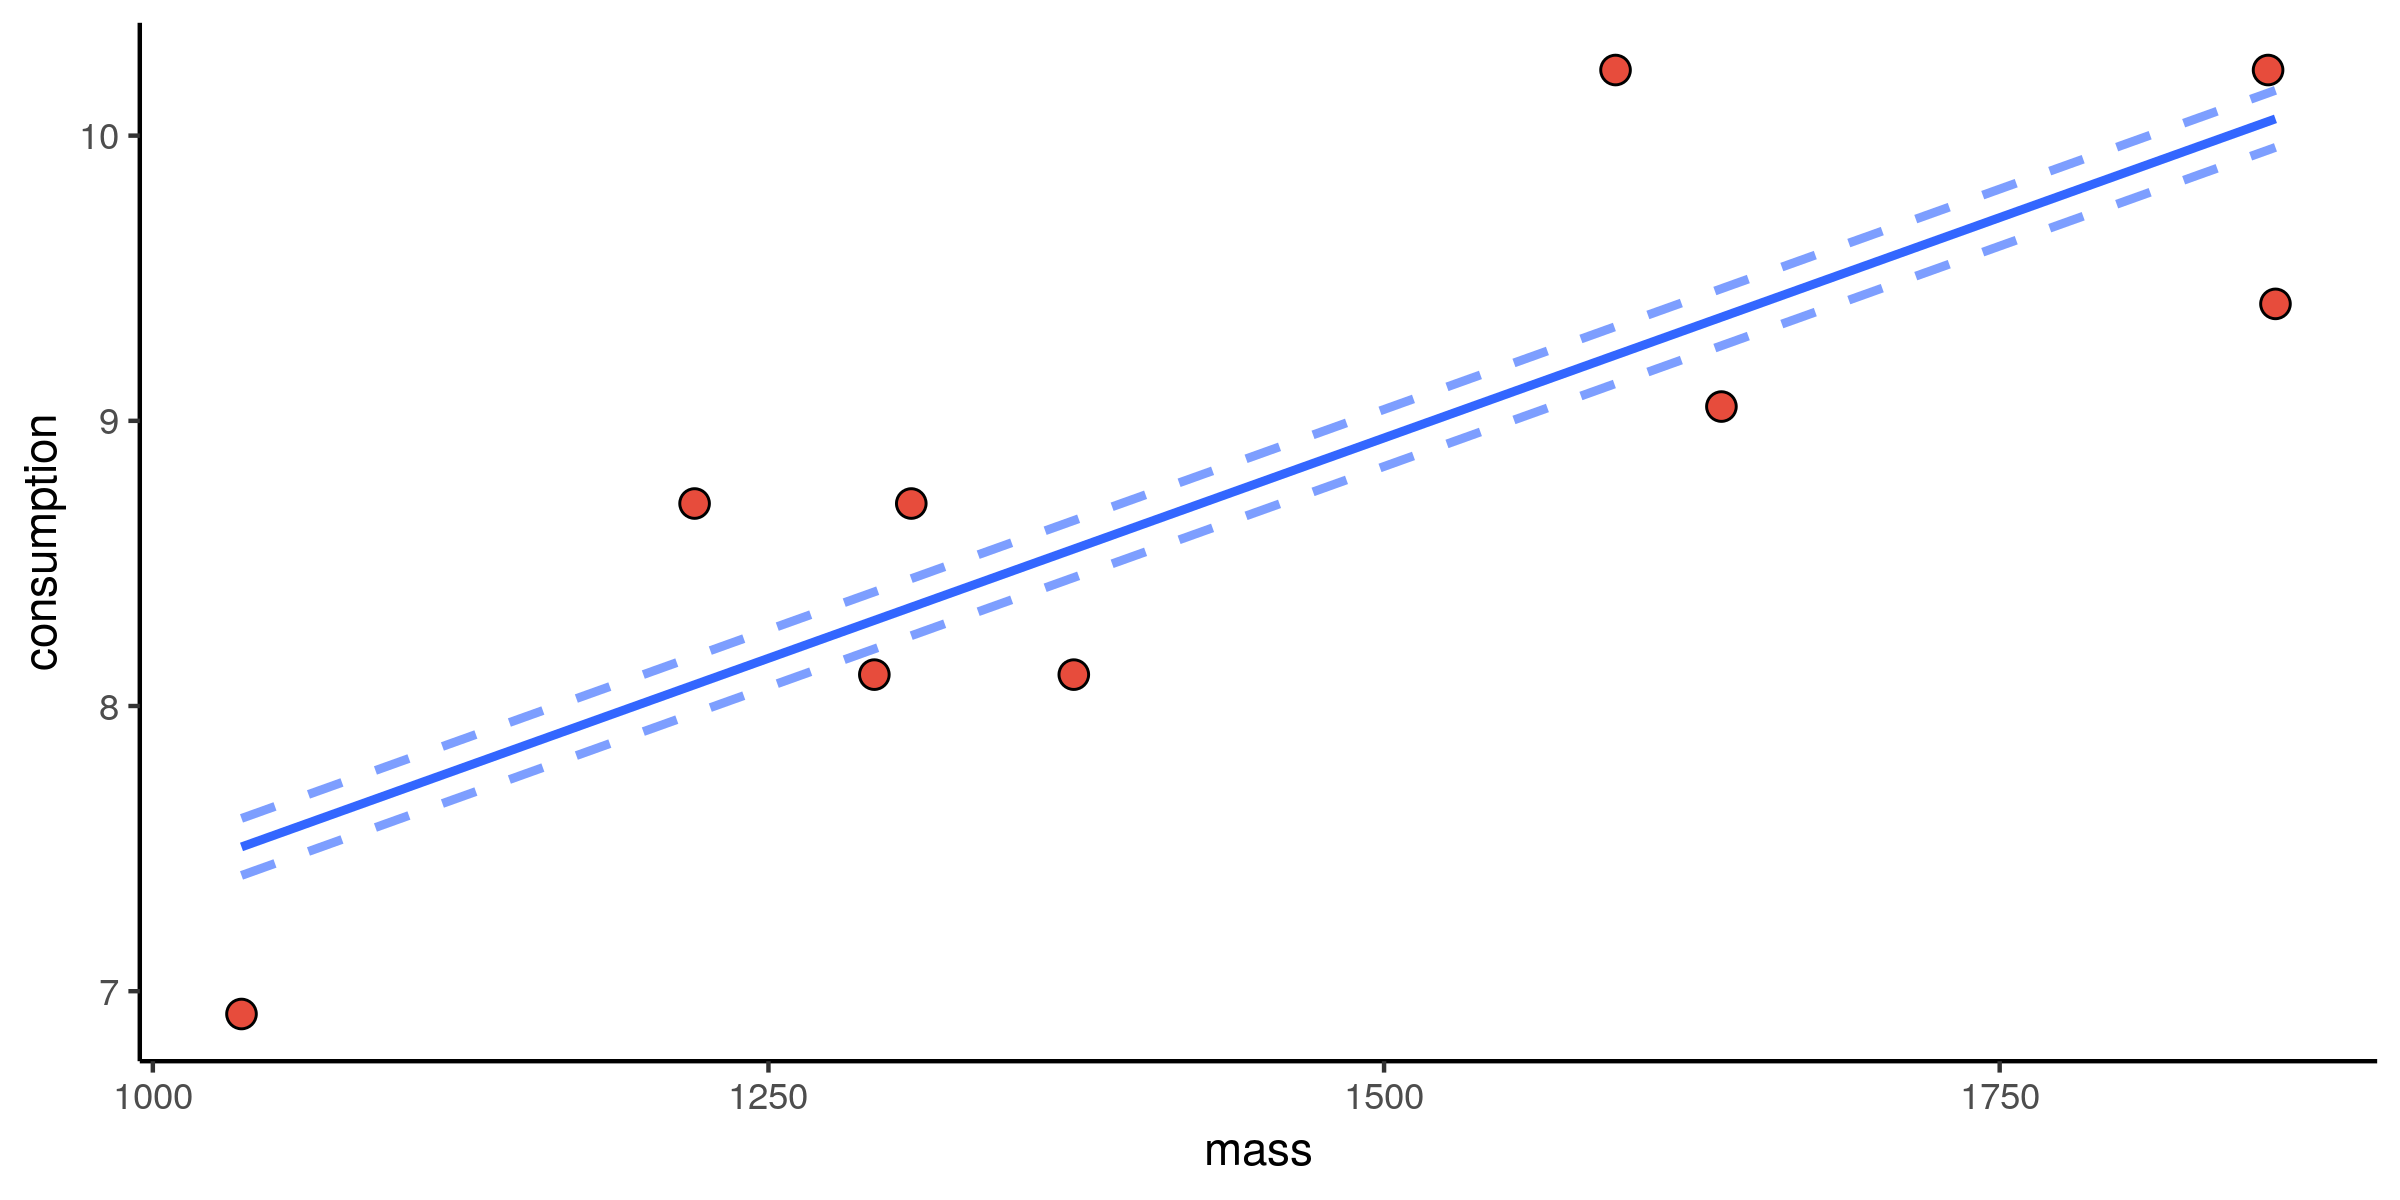
Consumption versus mass: alternative fits
Consumption versus mass: residuals
Loss function
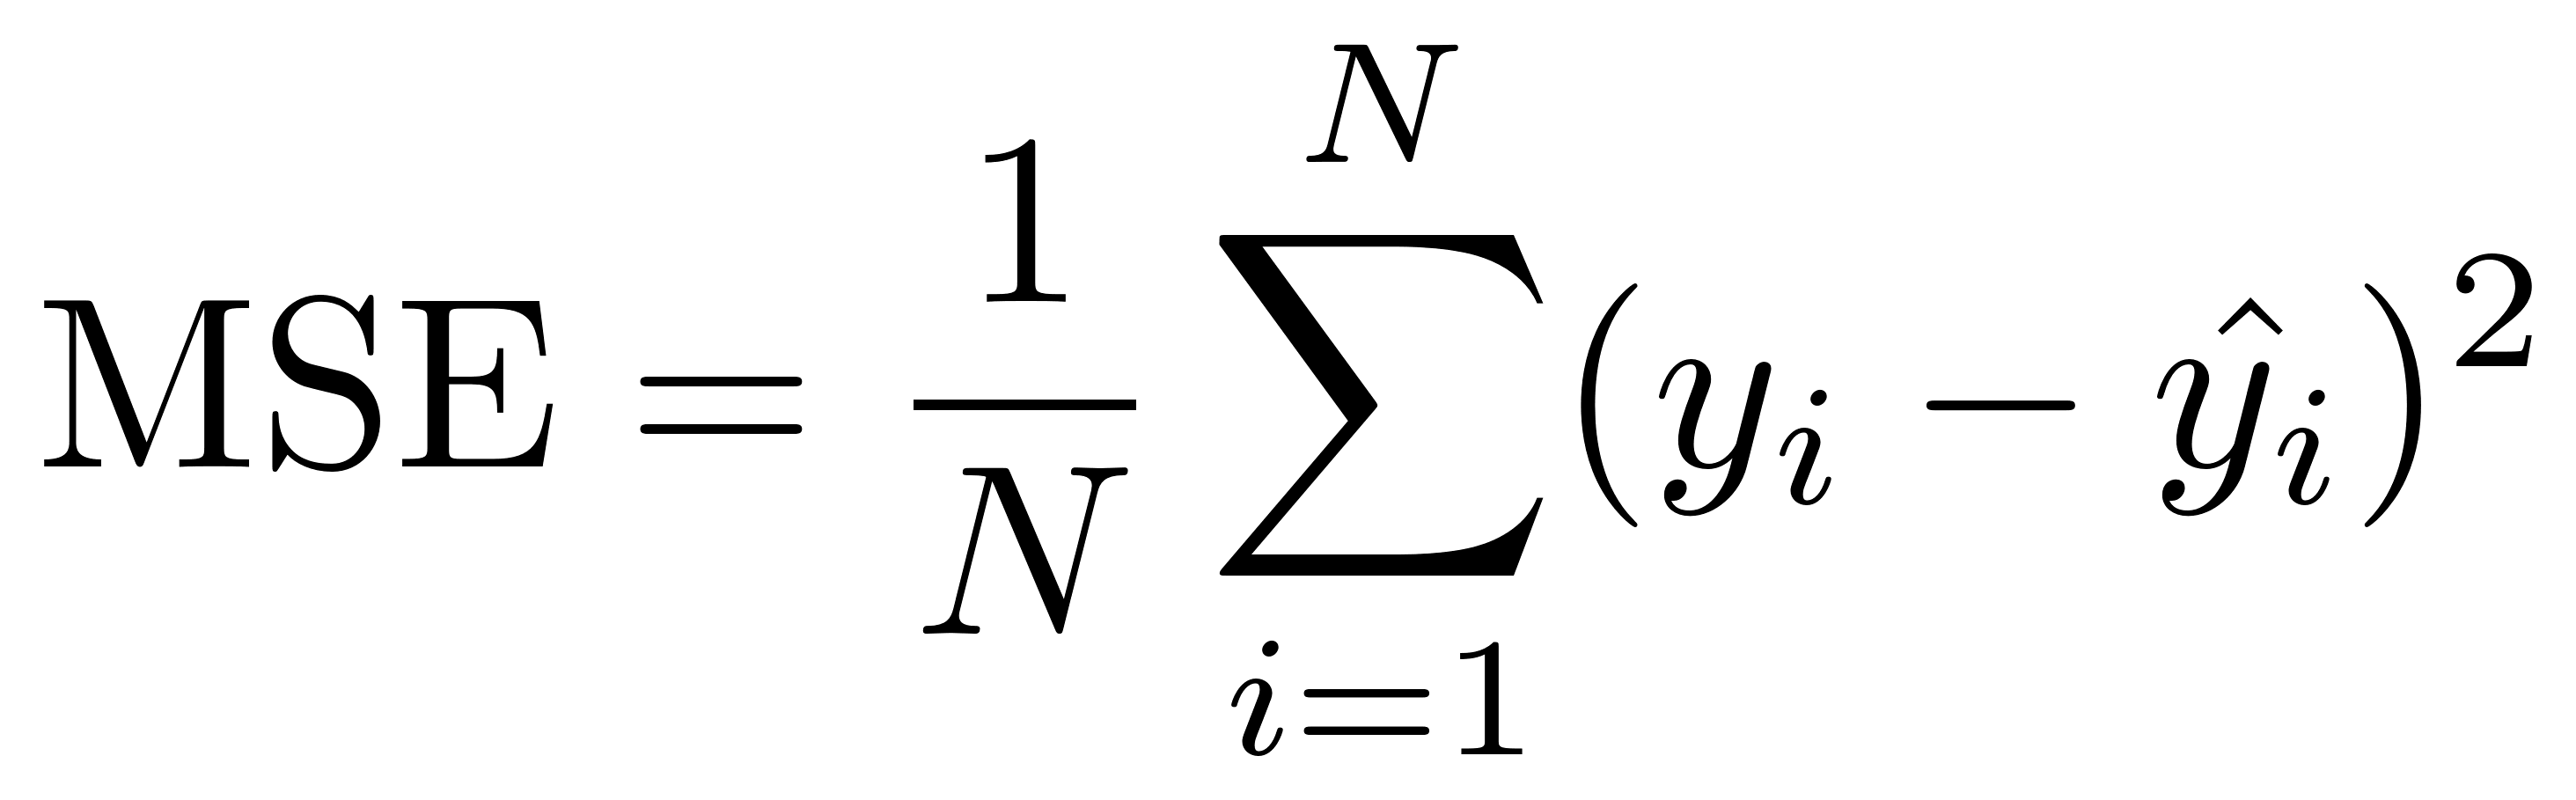
MSE = "Mean Squared Error"
Loss function: Observed values
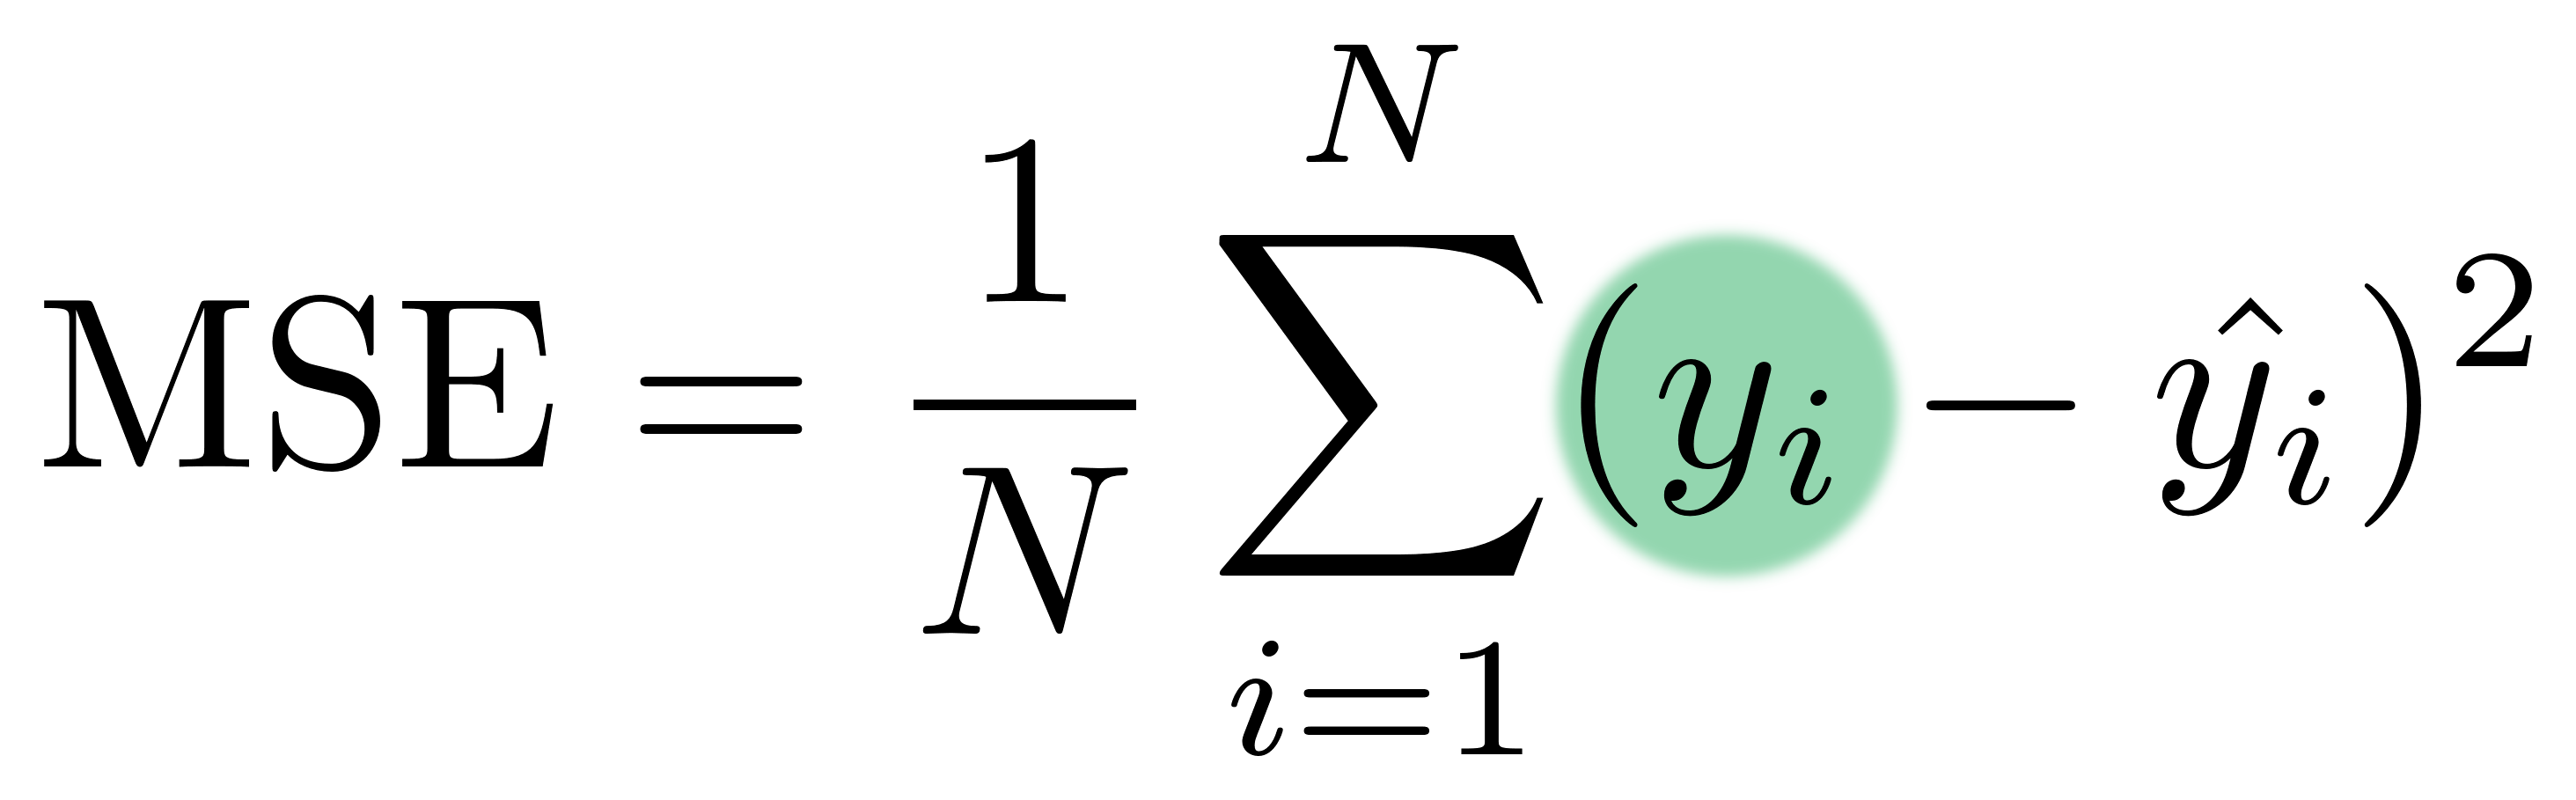
$y_i$ — observed values
Loss function: Model values
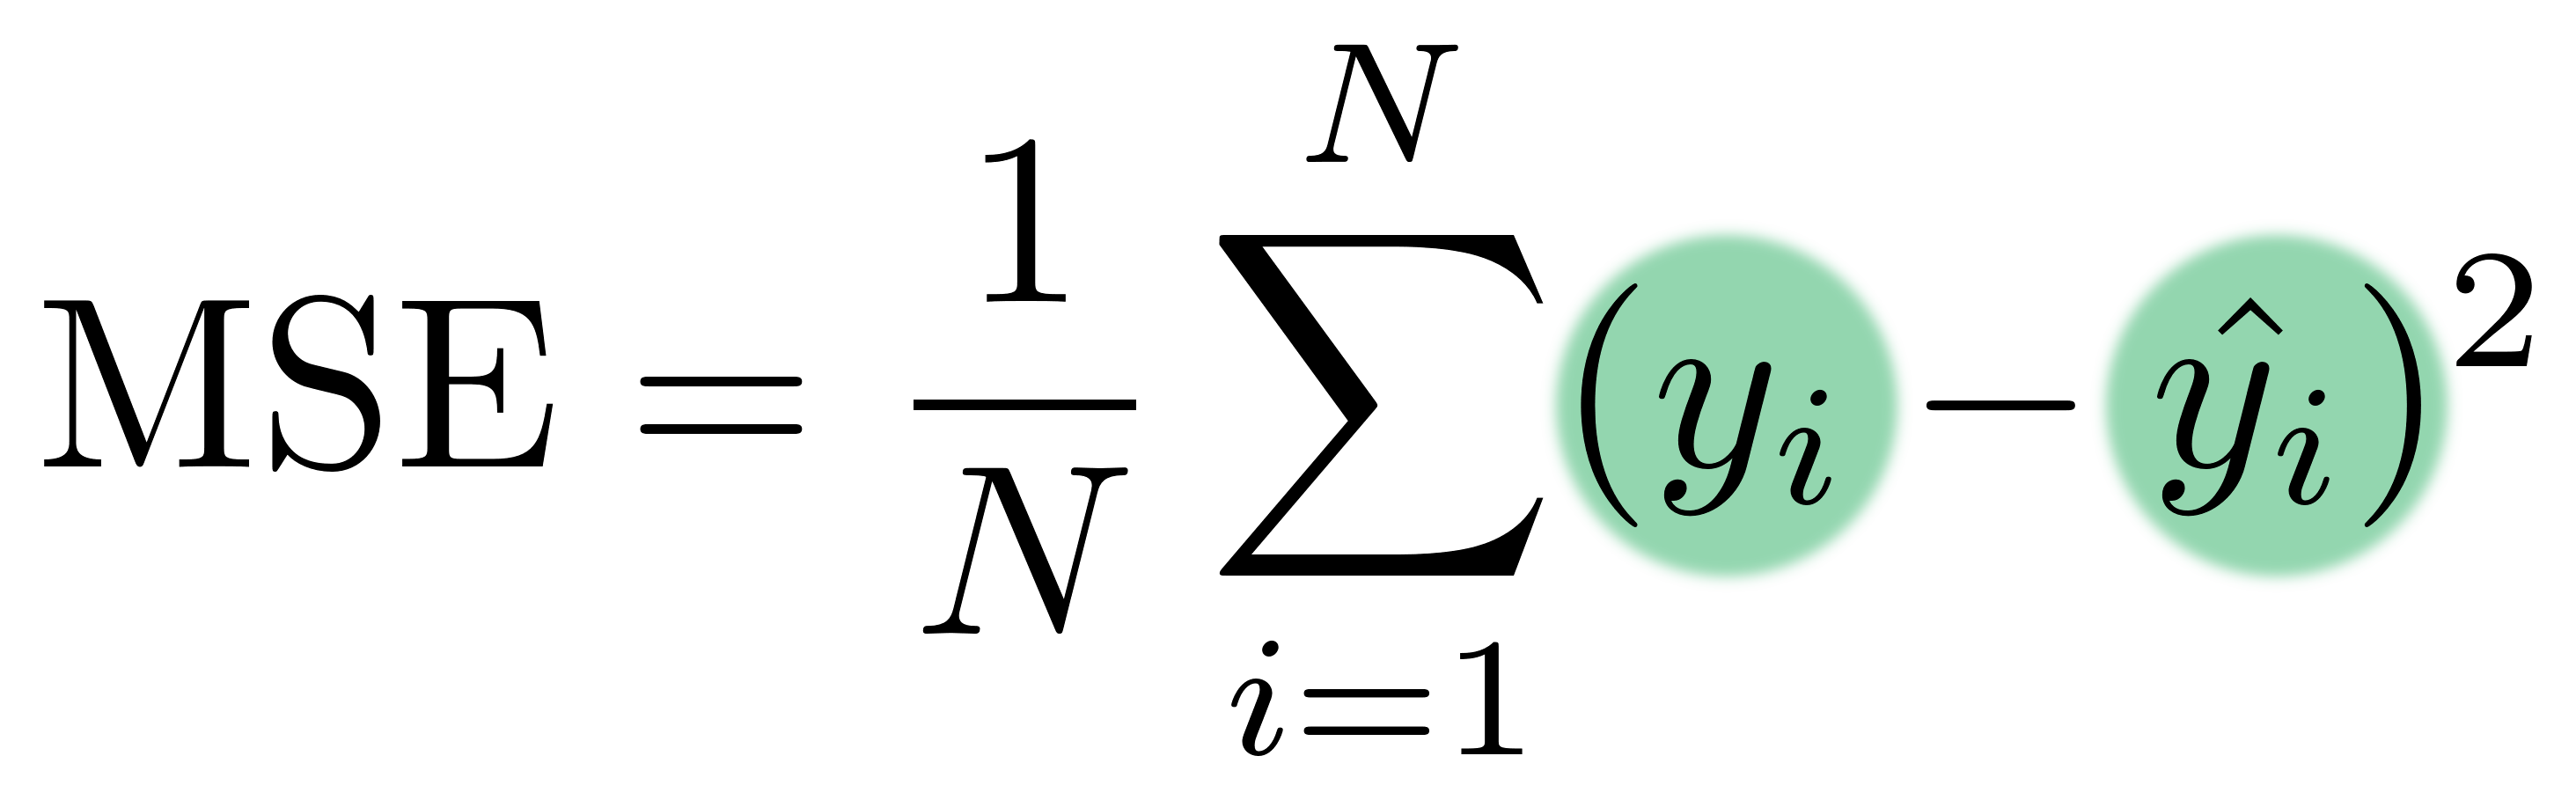
$y_i$ — observed values
$\hat{y_i}$ — model values
Loss function: Mean
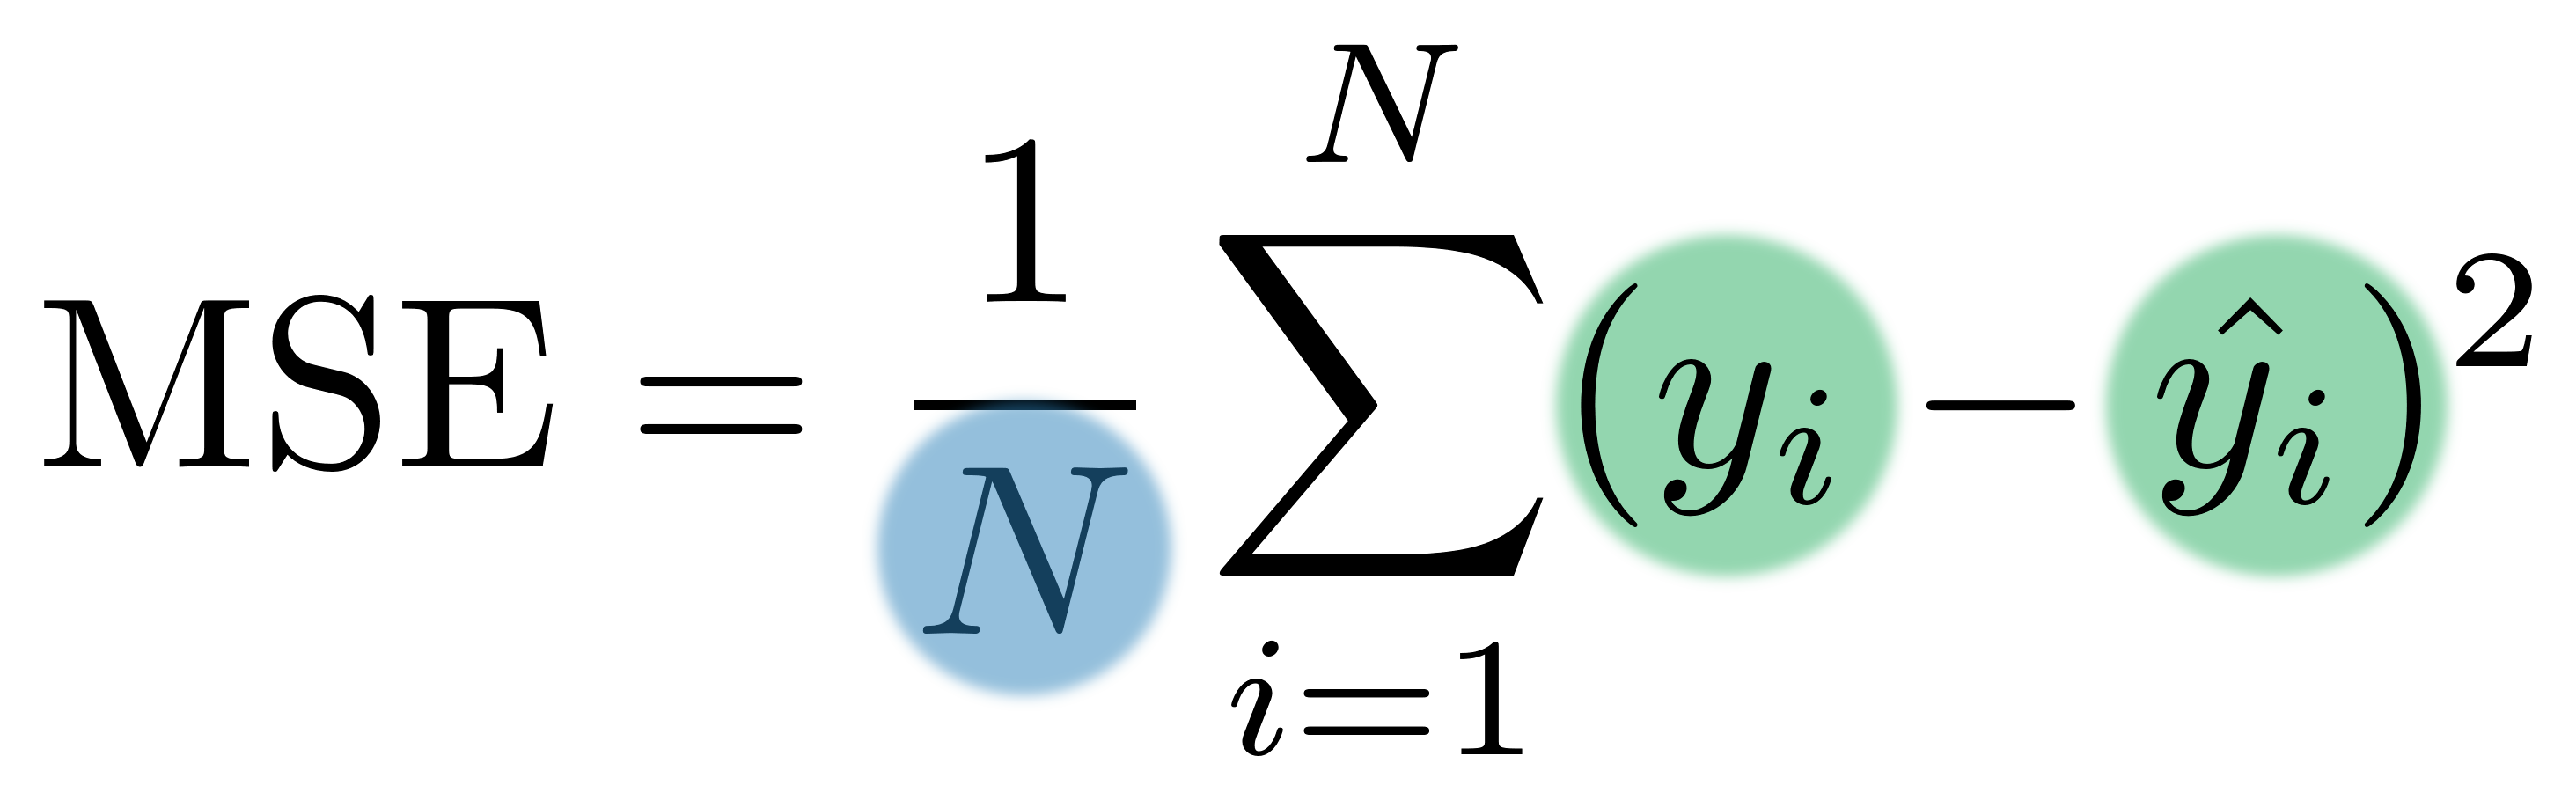
$y_i$ — observed values
$\hat{y_i}$ — model values
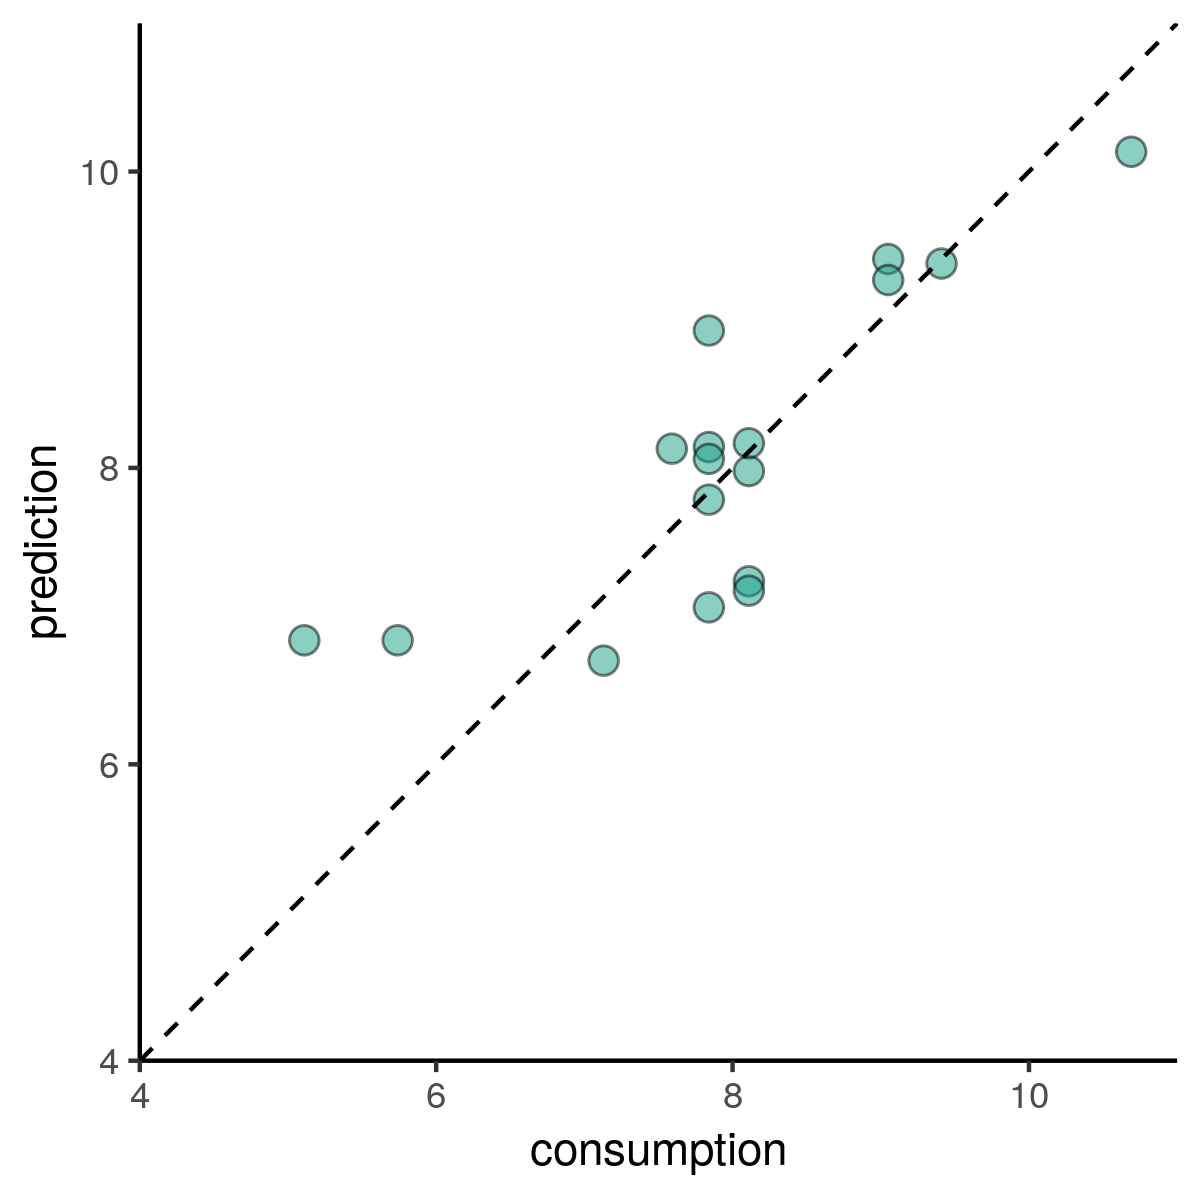
Examine predictions
Consumption versus mass: intercept
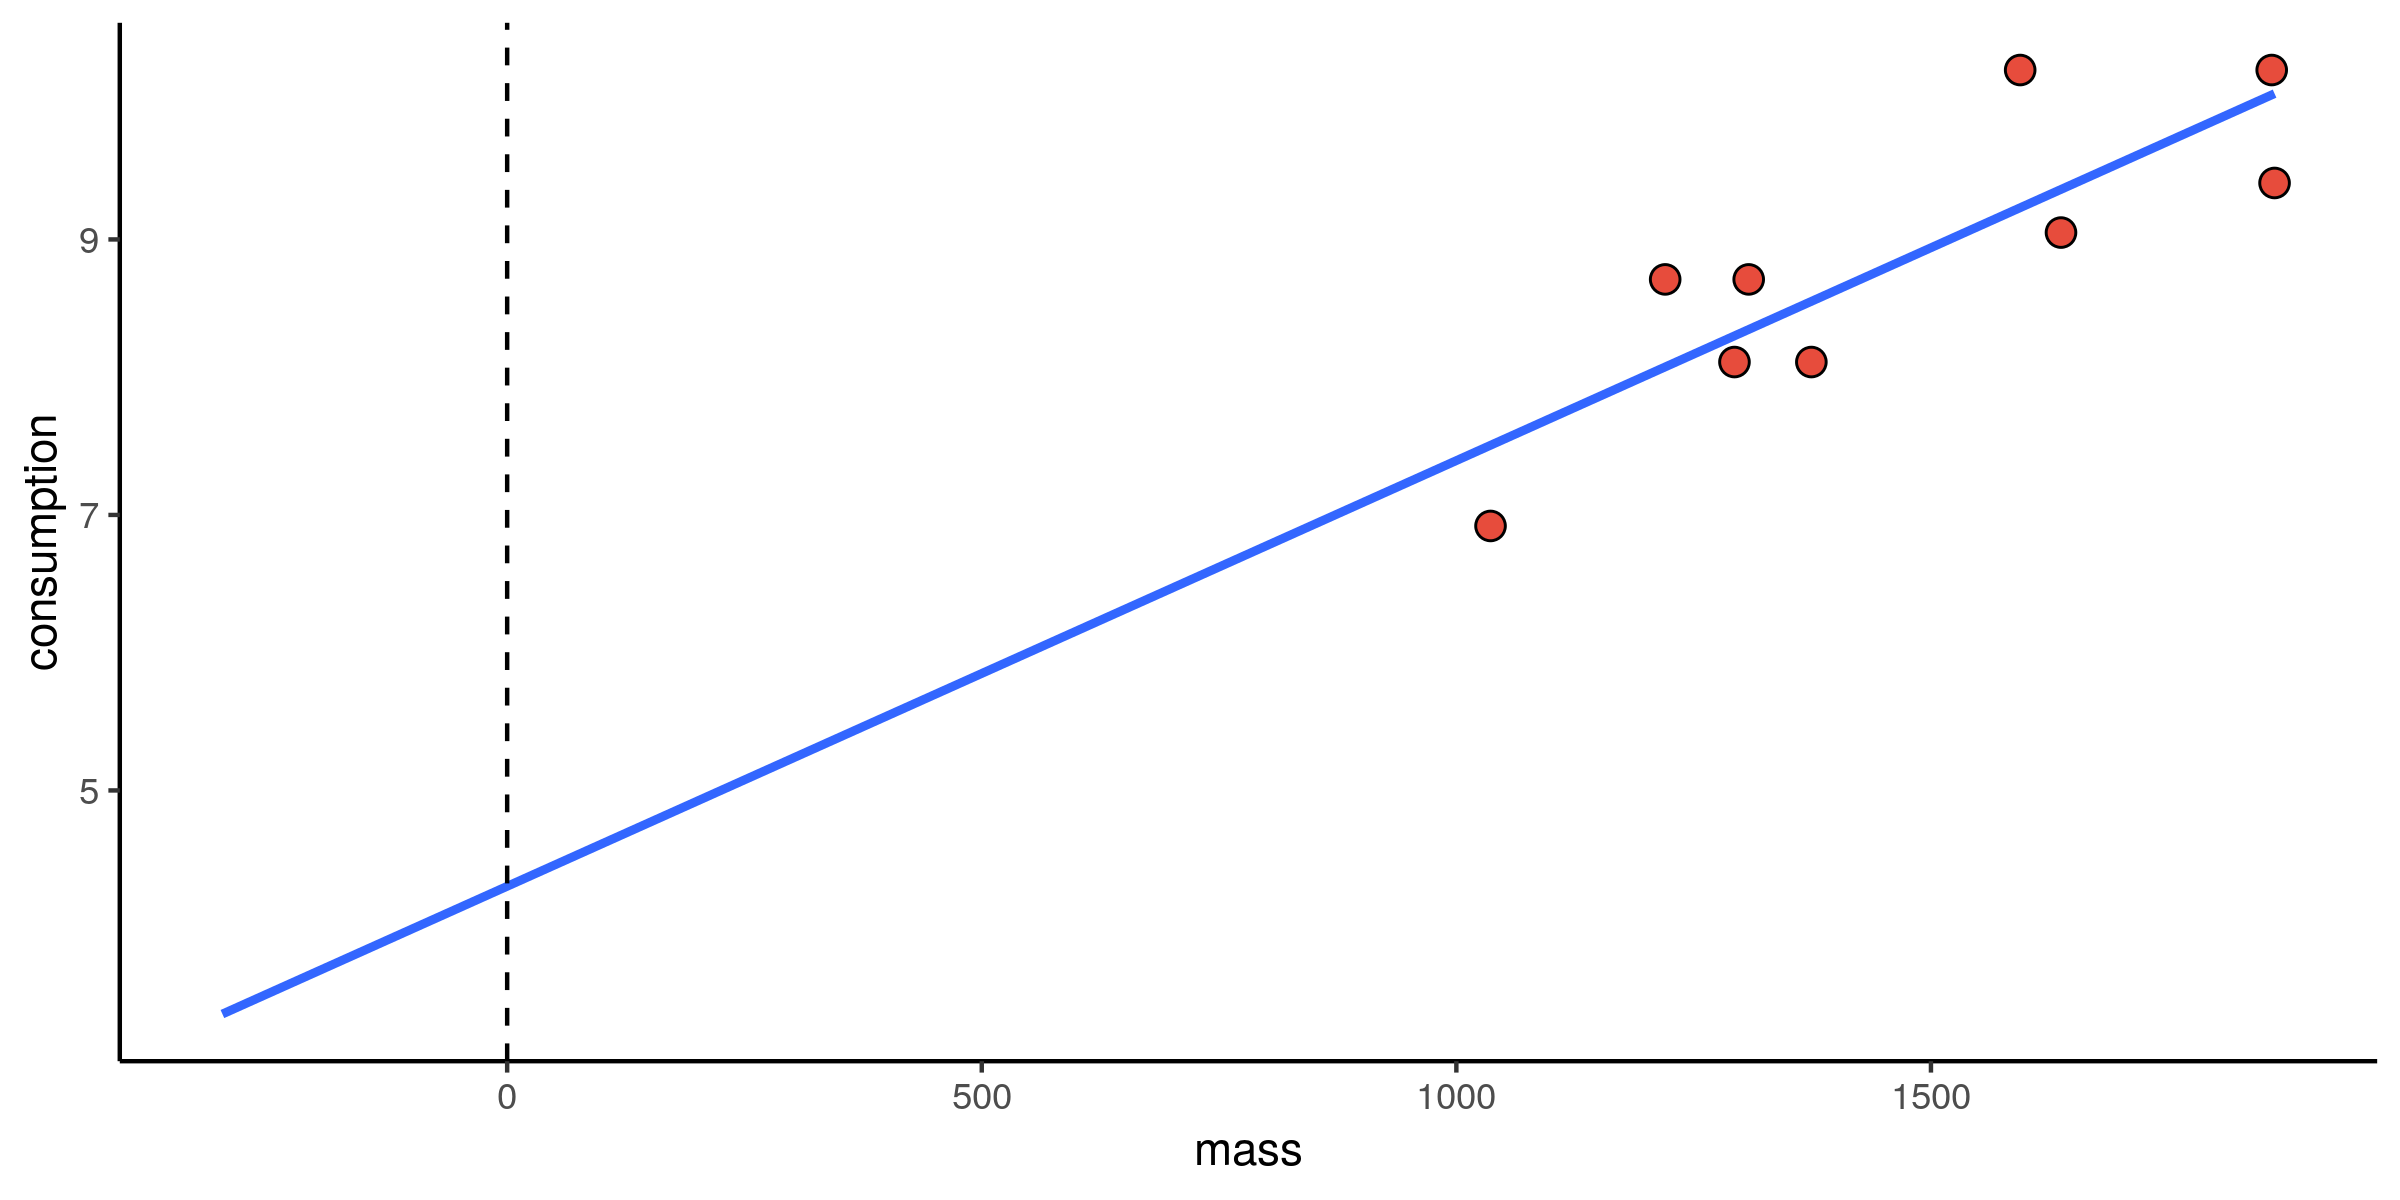
Consumption versus mass: slope