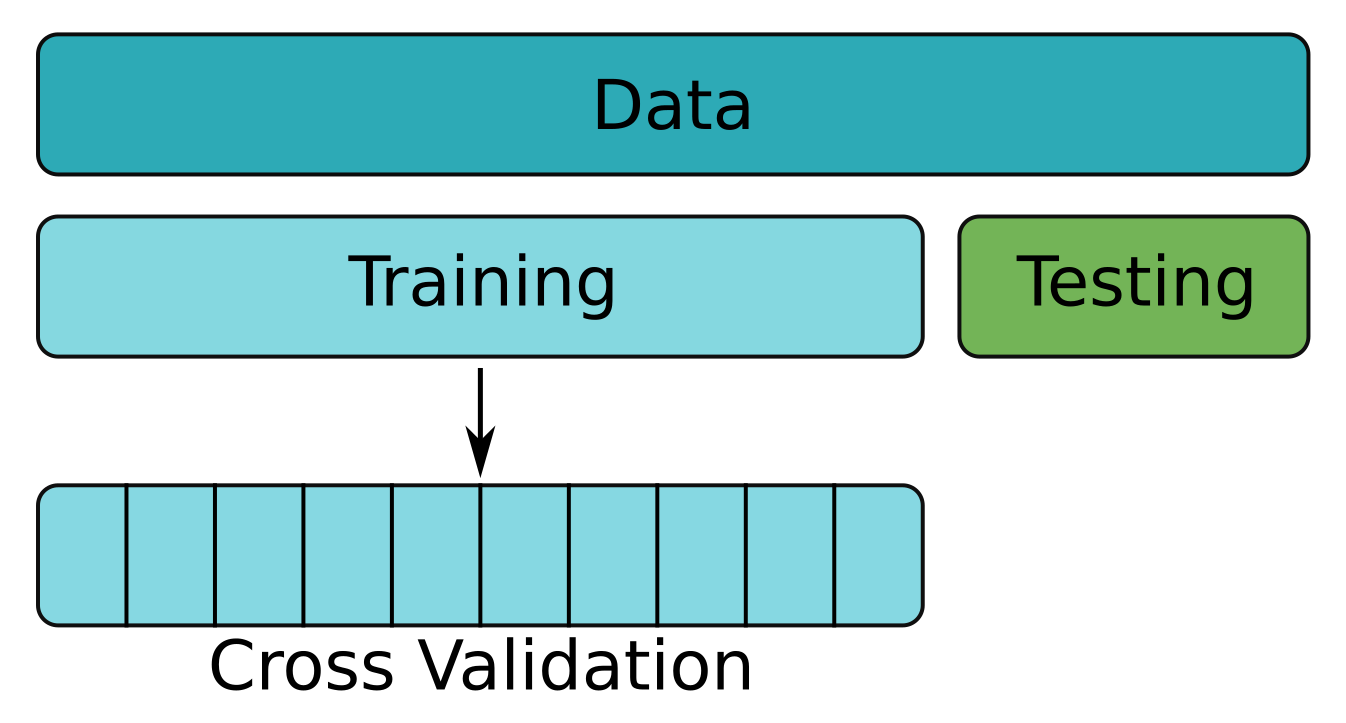
Cross-Validation
Machine Learning with PySpark

Andrew Collier
Data Scientist, Fathom Data
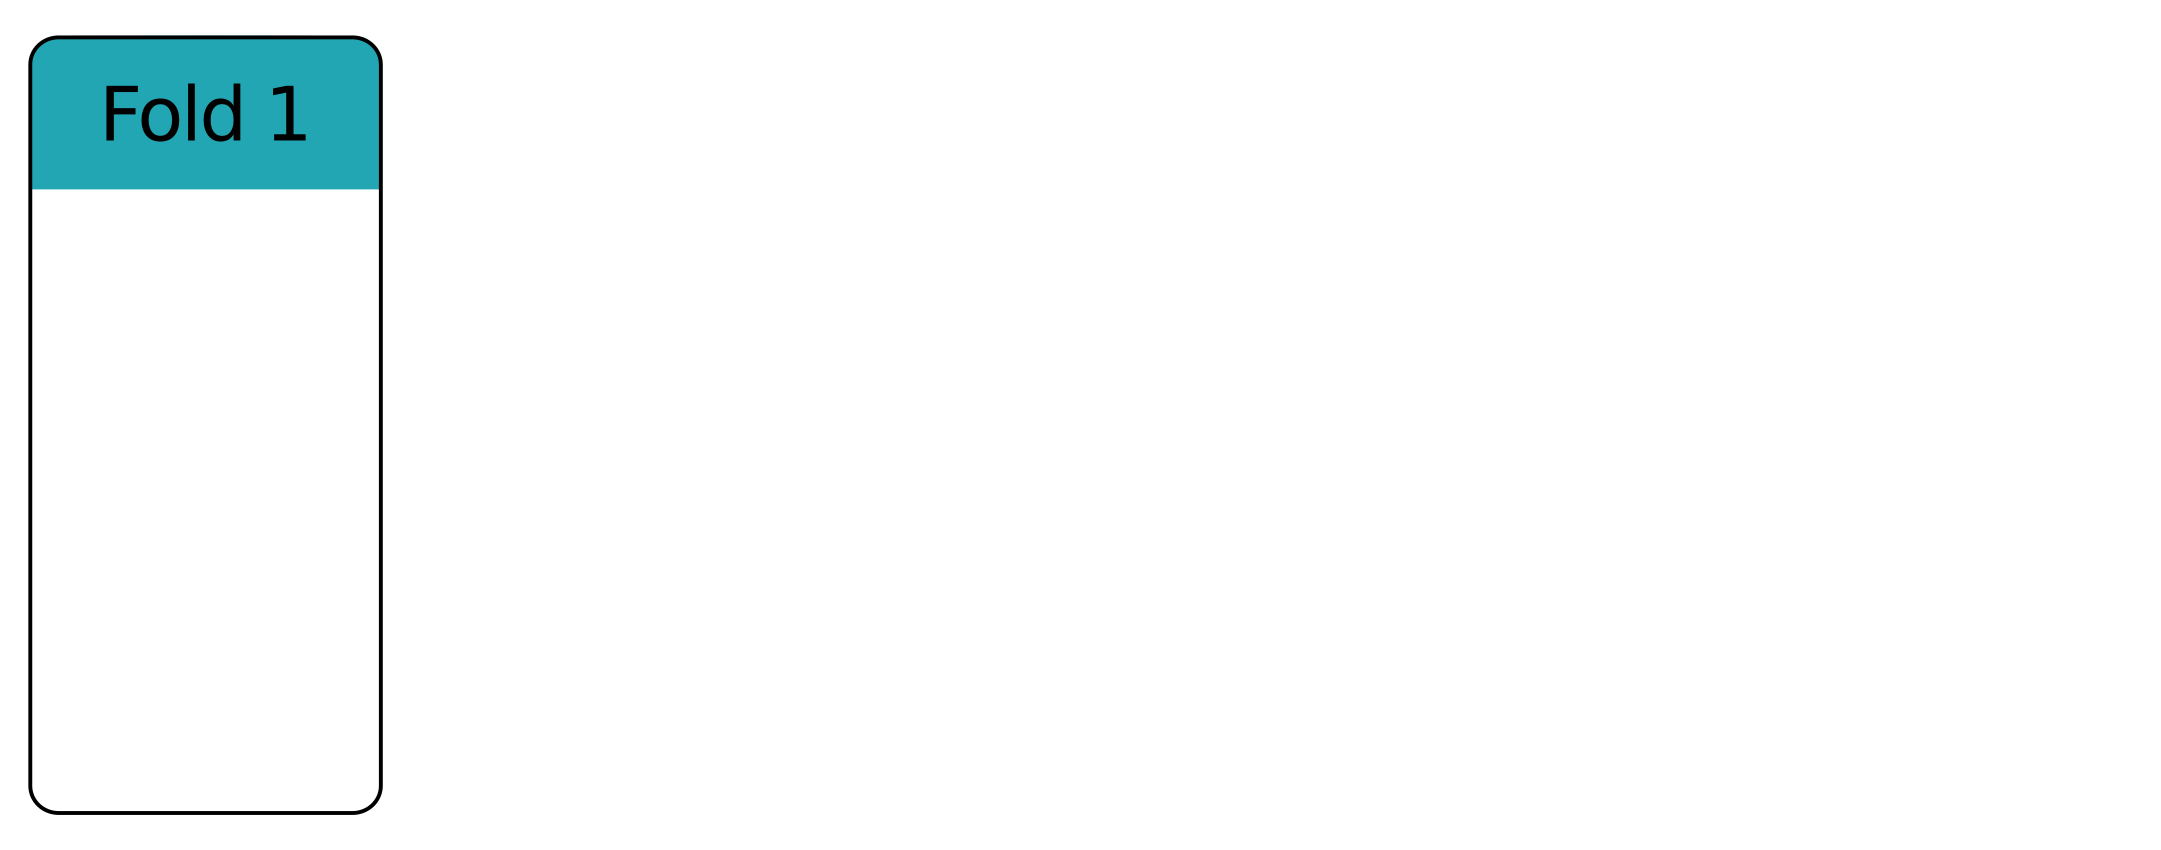
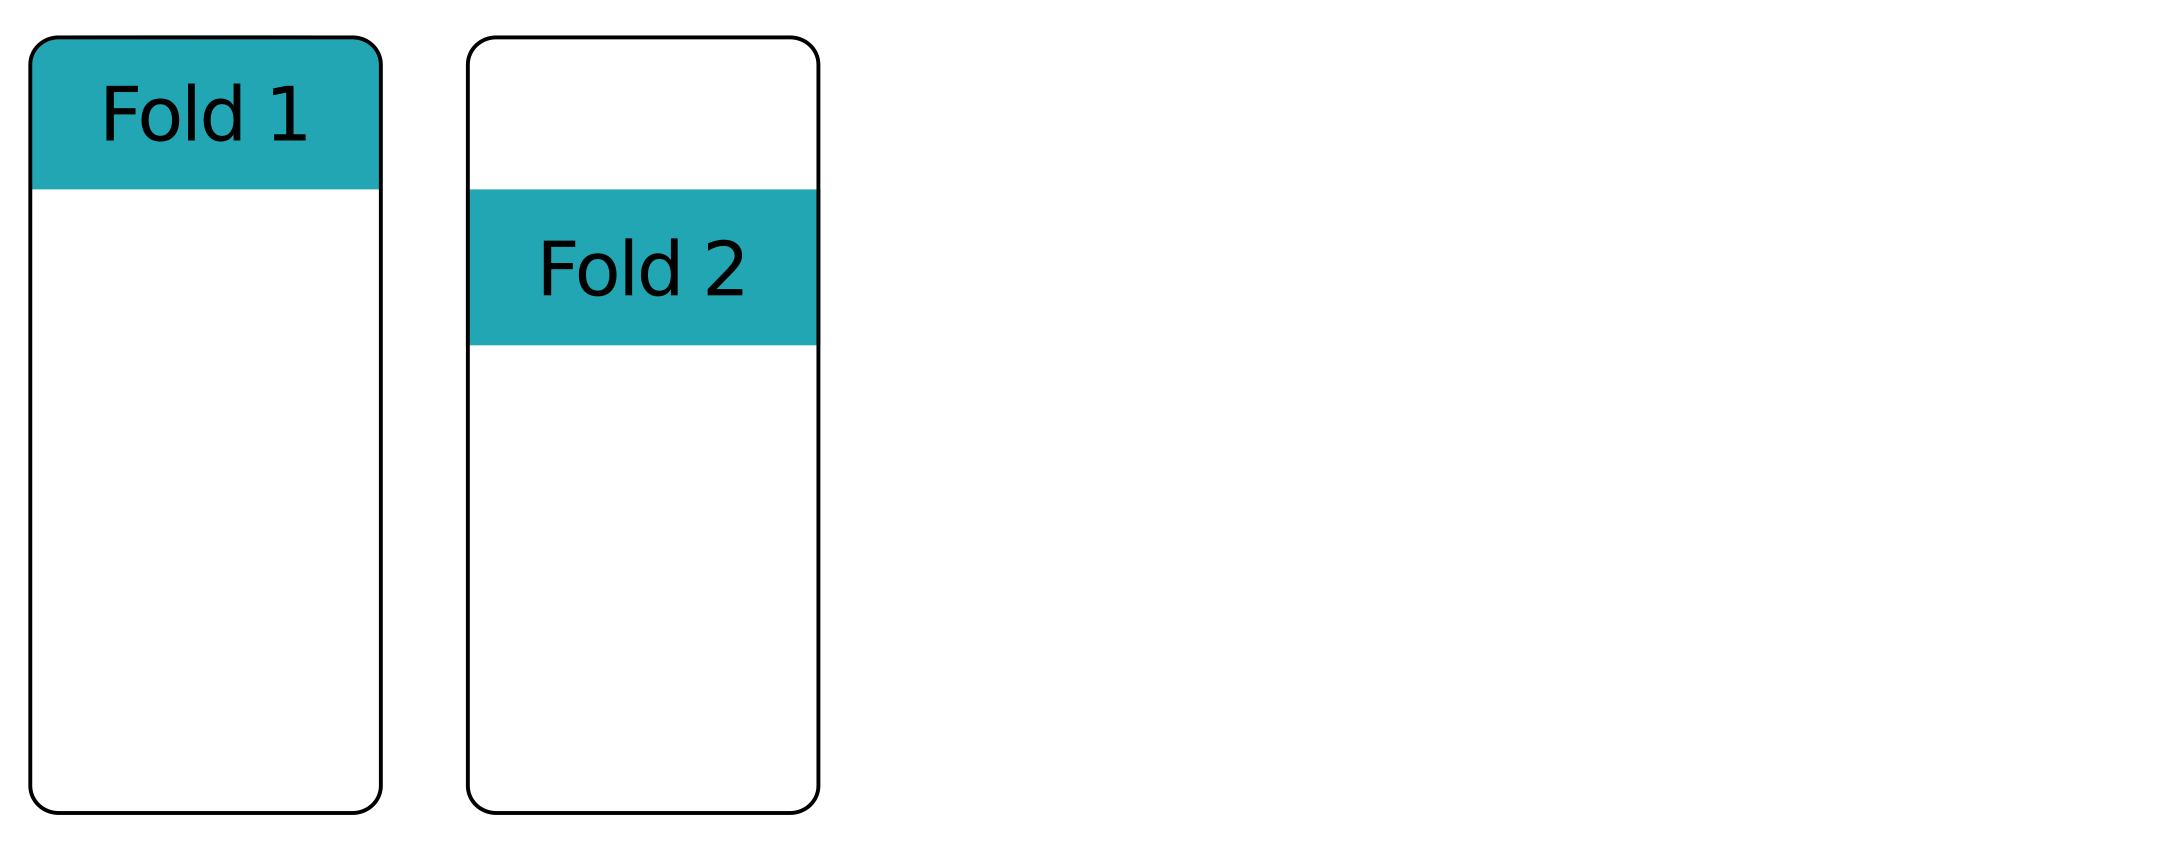
Fold upon fold - first fold
Fold upon fold - second fold
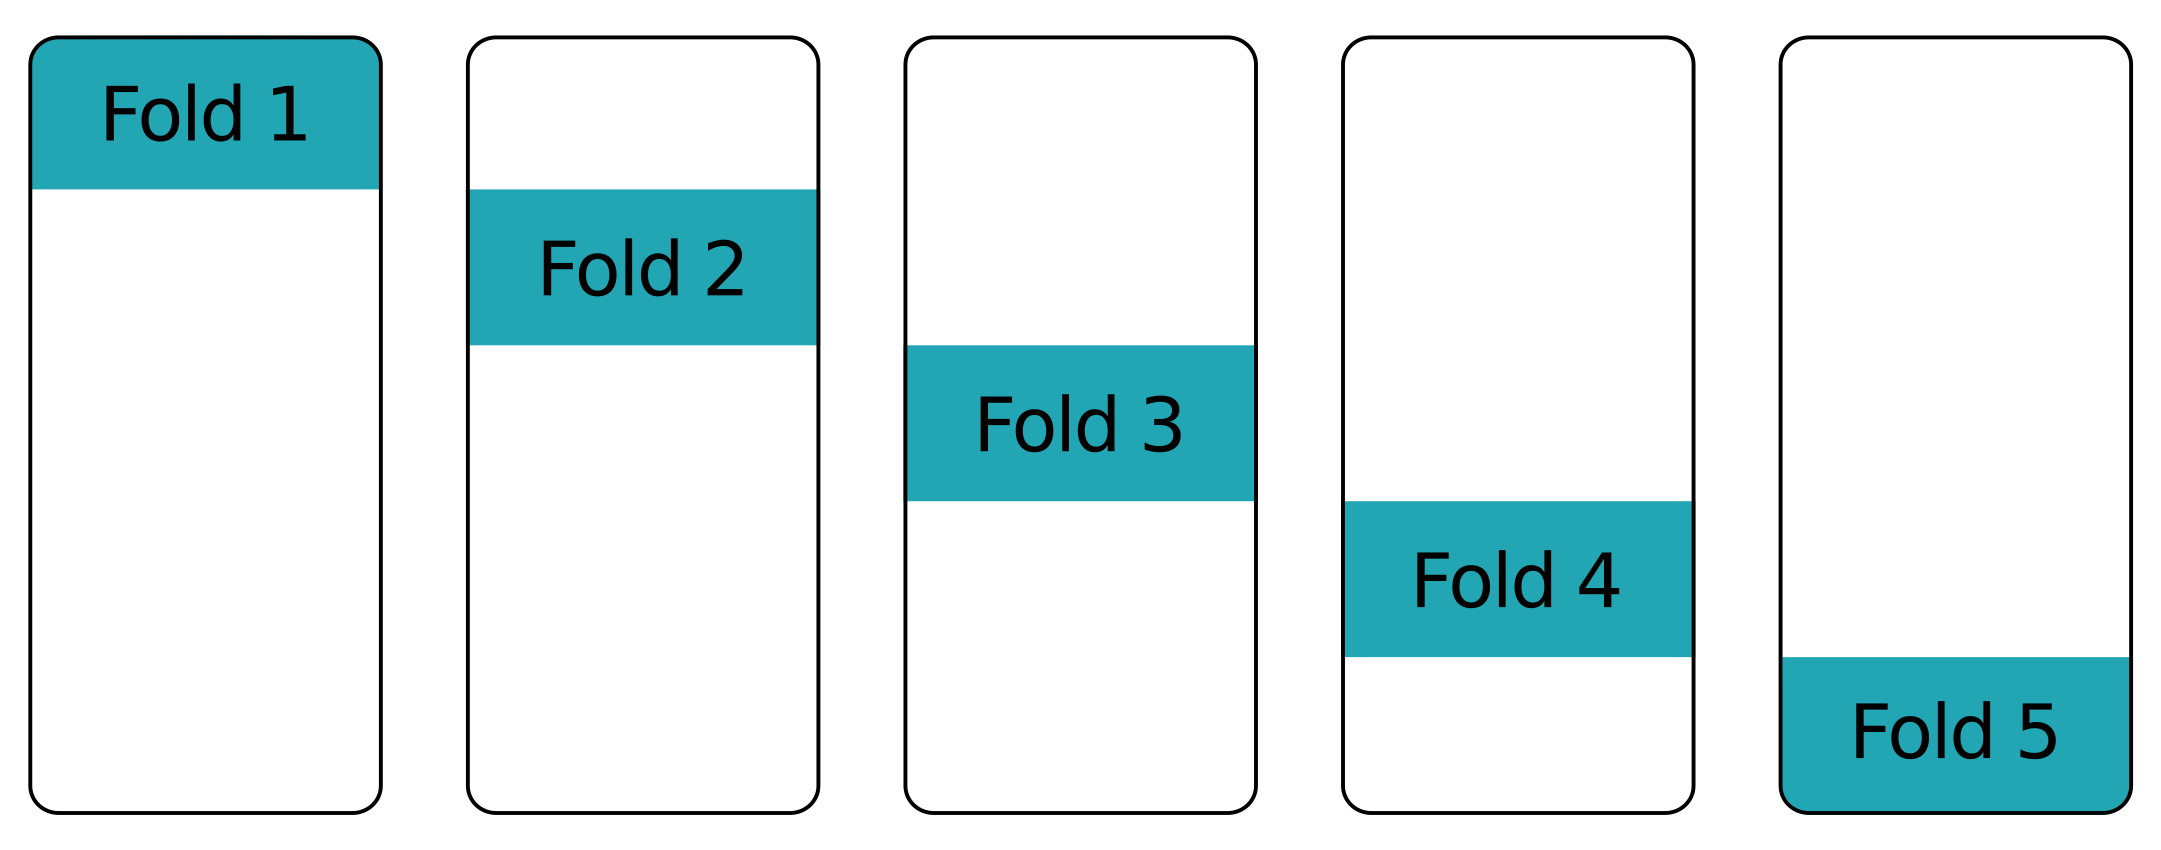
Fold upon fold - other folds
Machine Learning with PySpark
Andrew Collier
Data Scientist, Fathom Data

