Visualización de datos en Excel
Introducción a Excel

Jess Ahmet
Curriculum Manager, DataCamp
Hoja de trucos de visualización de datos
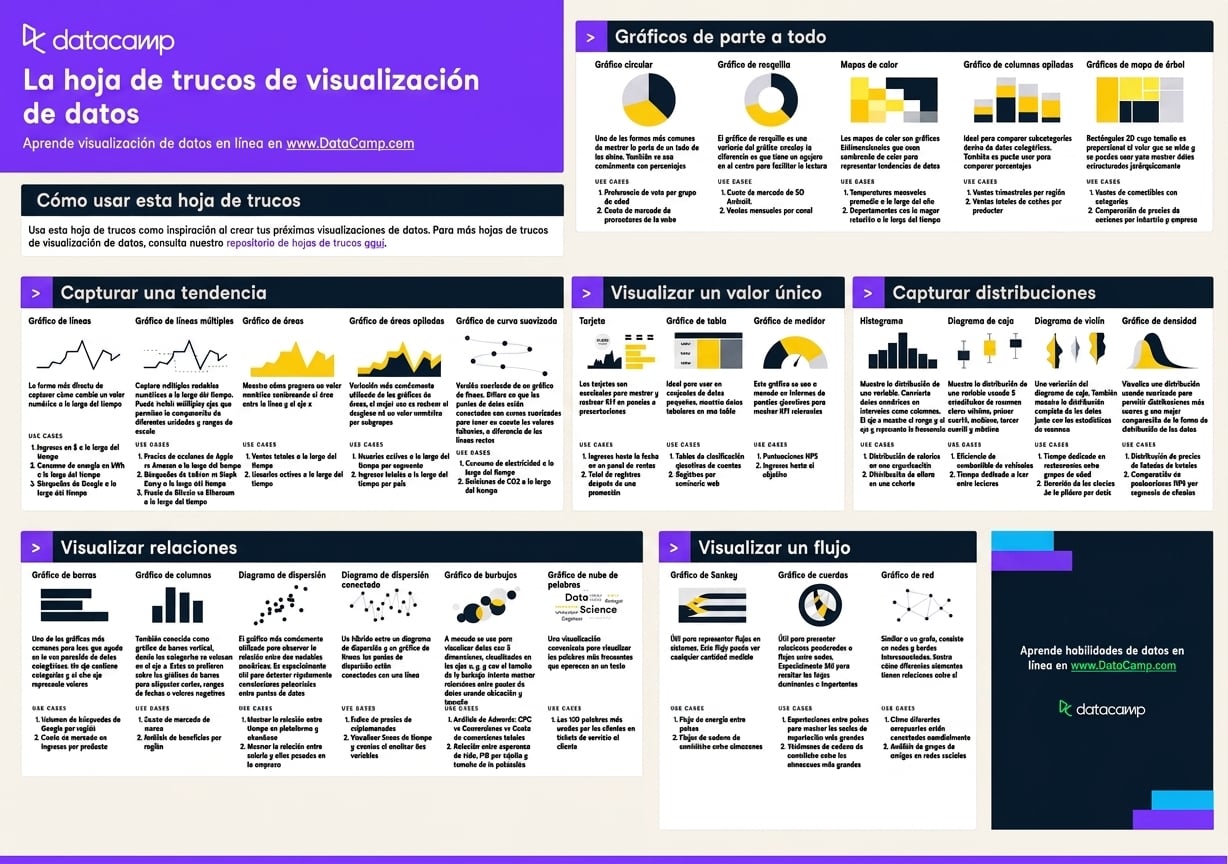
1 https://www.datacamp.com/cheat-sheet/data-viz-cheat-sheet
¿Qué es la visualización de datos?
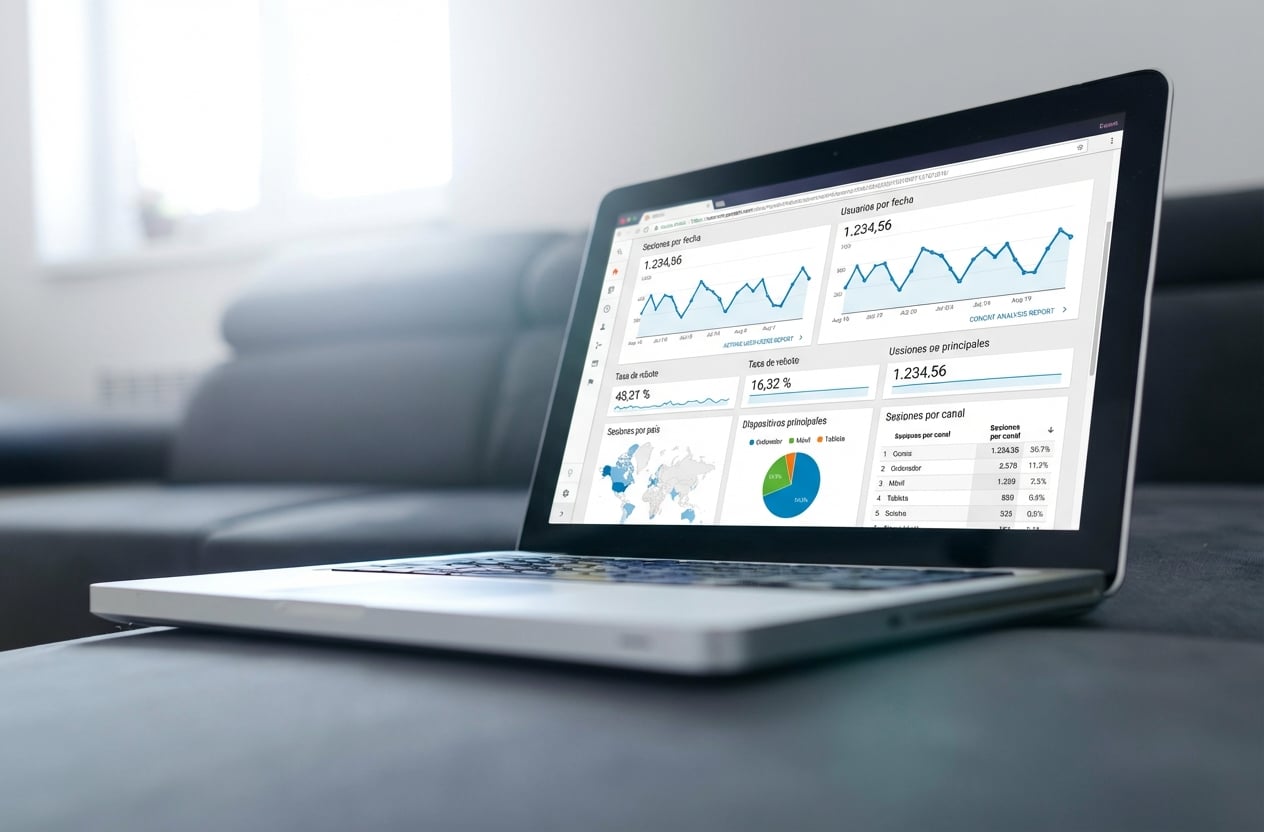
Excel para visualización de datos
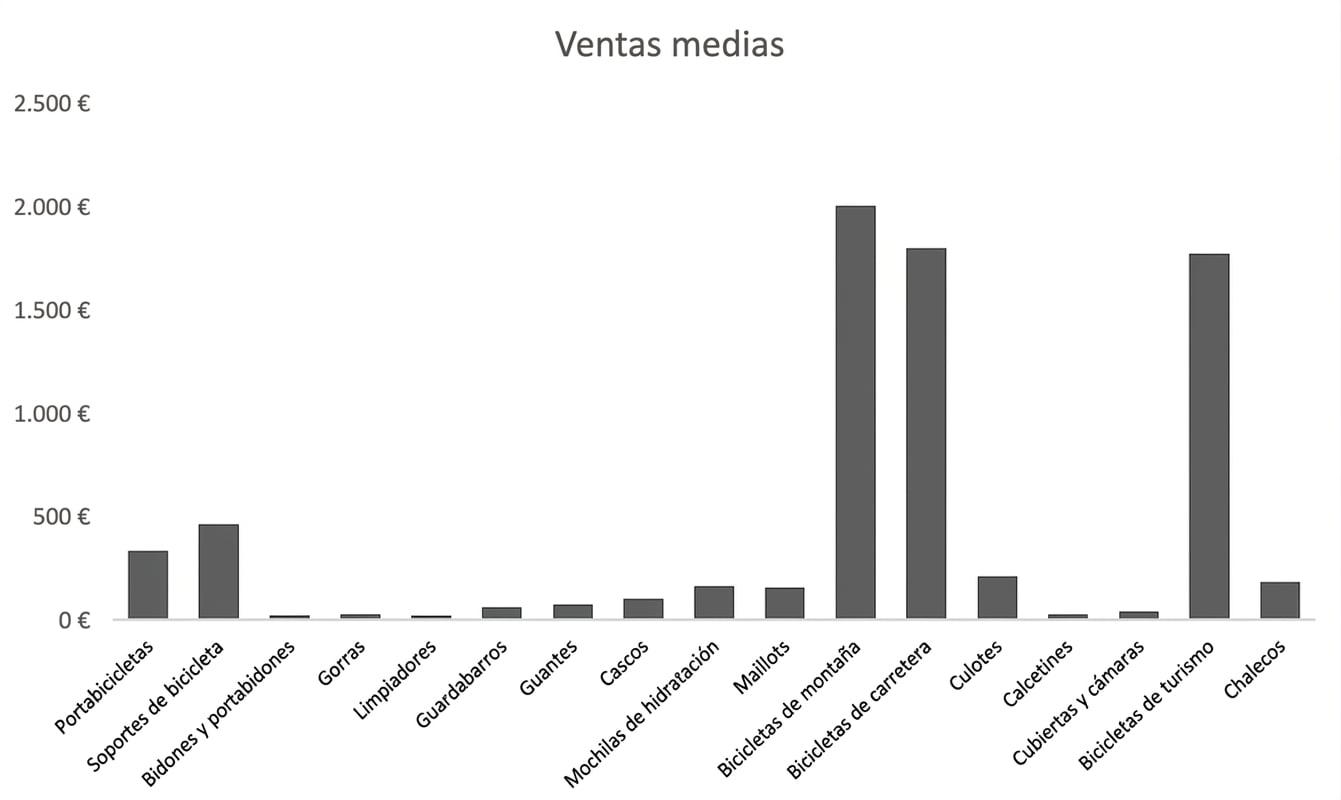
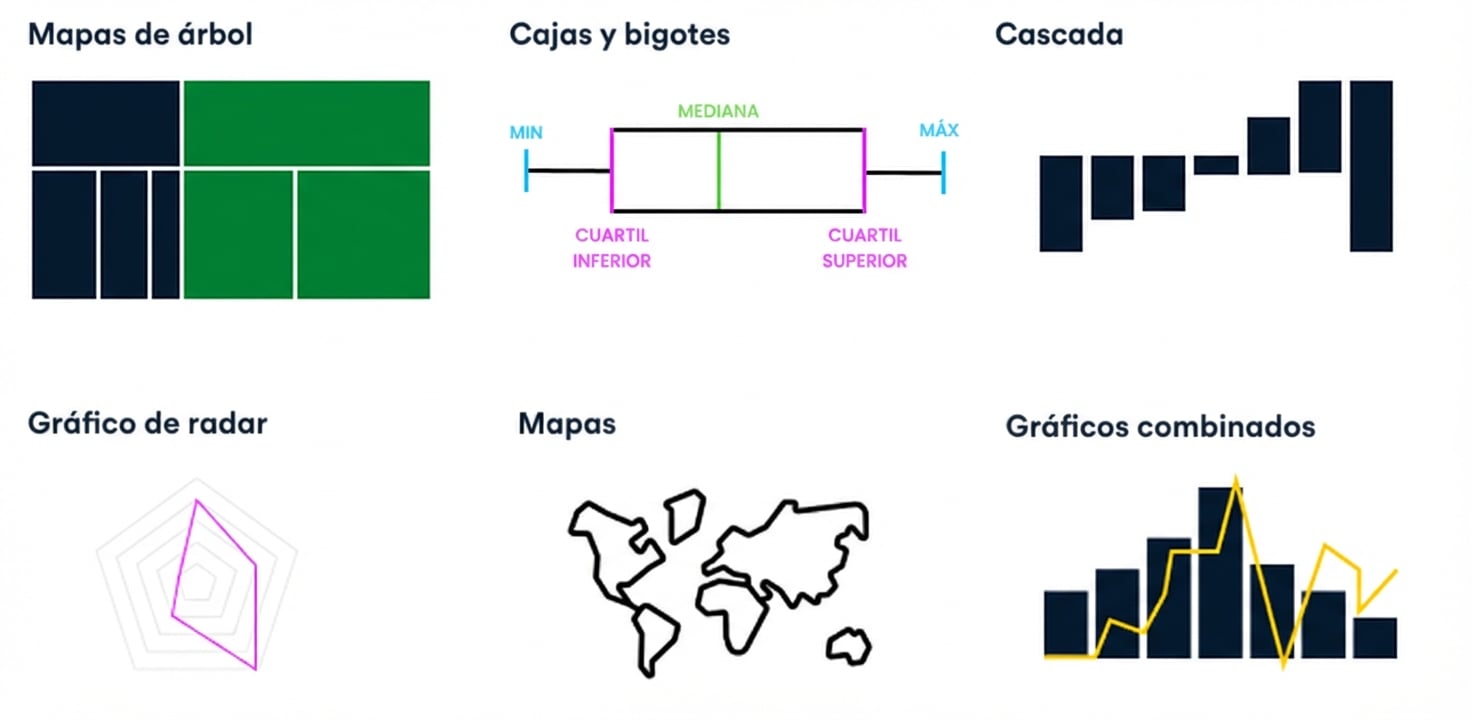
Opciones de visualización
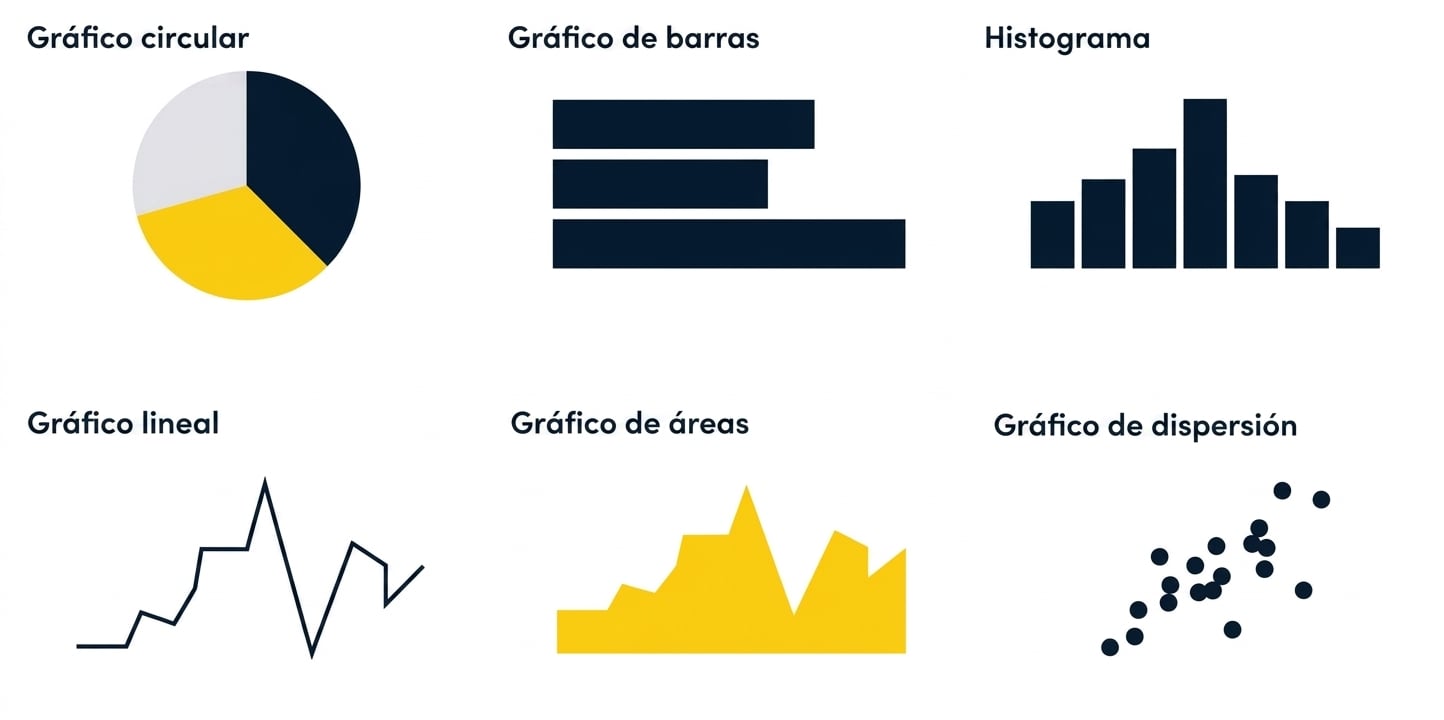
Opciones de visualización