¿Qué pasa si...
Análisis de datos en Excel

Nick Edwards
Analyst at Mynd
¿Qué es el análisis de escenarios?
- El análisis de escenarios es un tipo de what‑if que evalúa el impacto en una variable dependiente dado uno o más inputs.
- Pregunta: "¿QUÉ pasa SI ...?"
1 https://www.investopedia.com/terms/s/scenario_analysis.asp
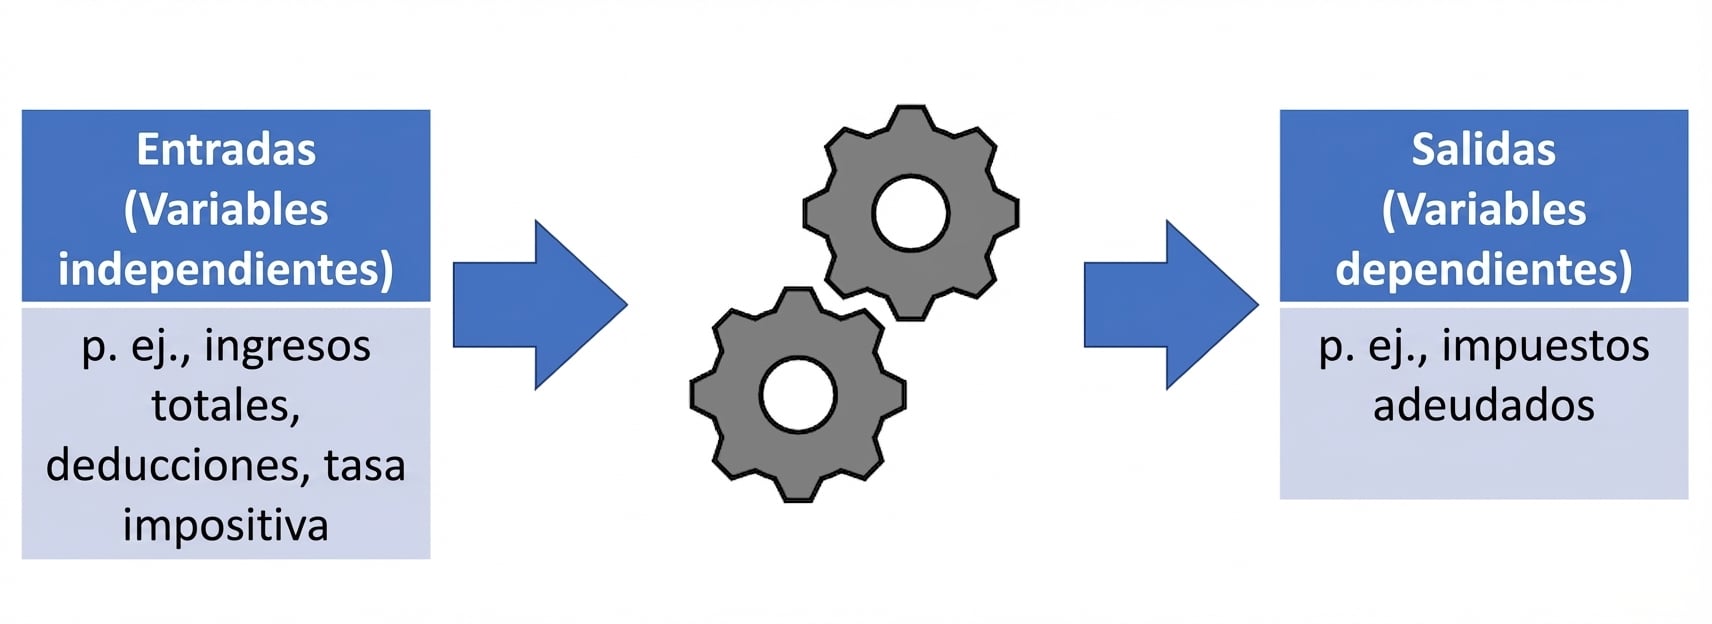
Dependiente vs. independiente
Las variables independientes toman su valor fuera del modelo
- Son los inputs del análisis
Las variables dependientes toman su valor del modelo y dependen de los inputs
- El output observado del análisis
Ejemplo: Taxes Owed = (Total Income - Deductions) * Tax Rate
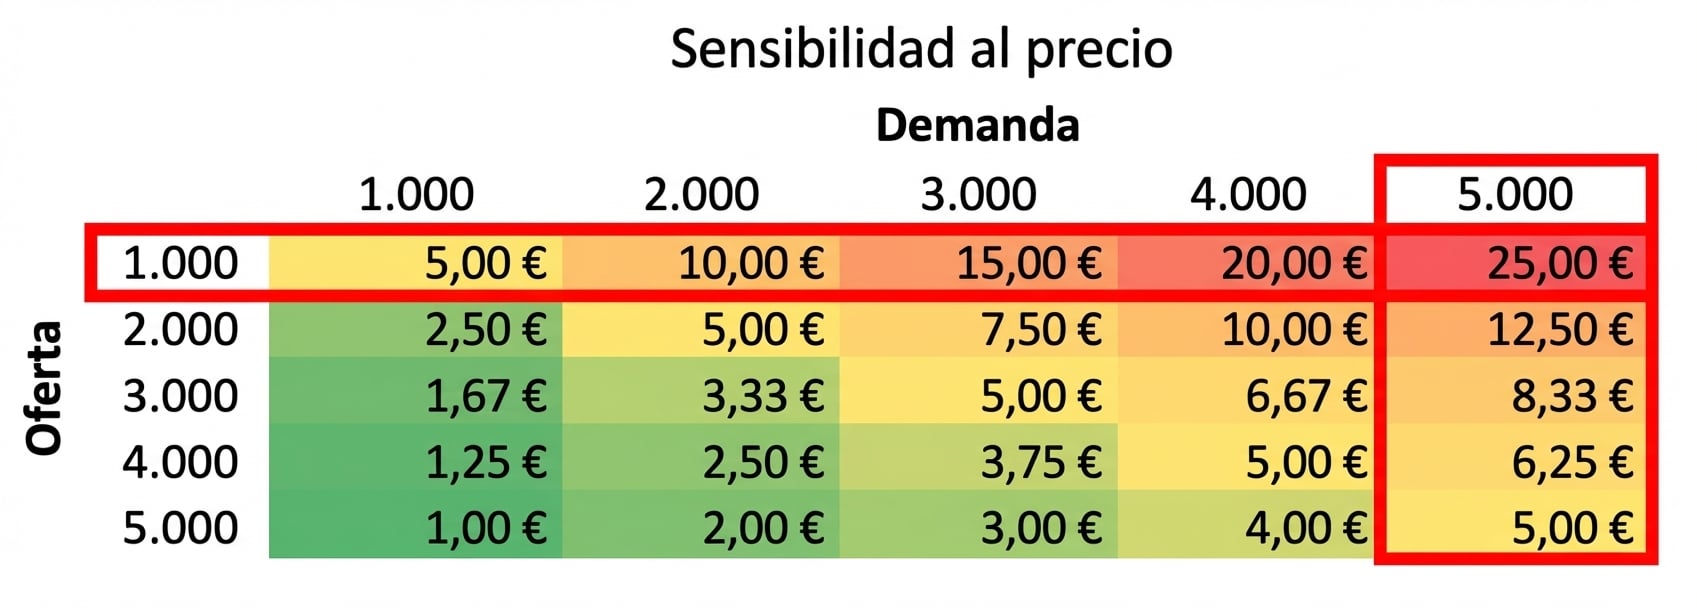
Tabla de sensibilidad
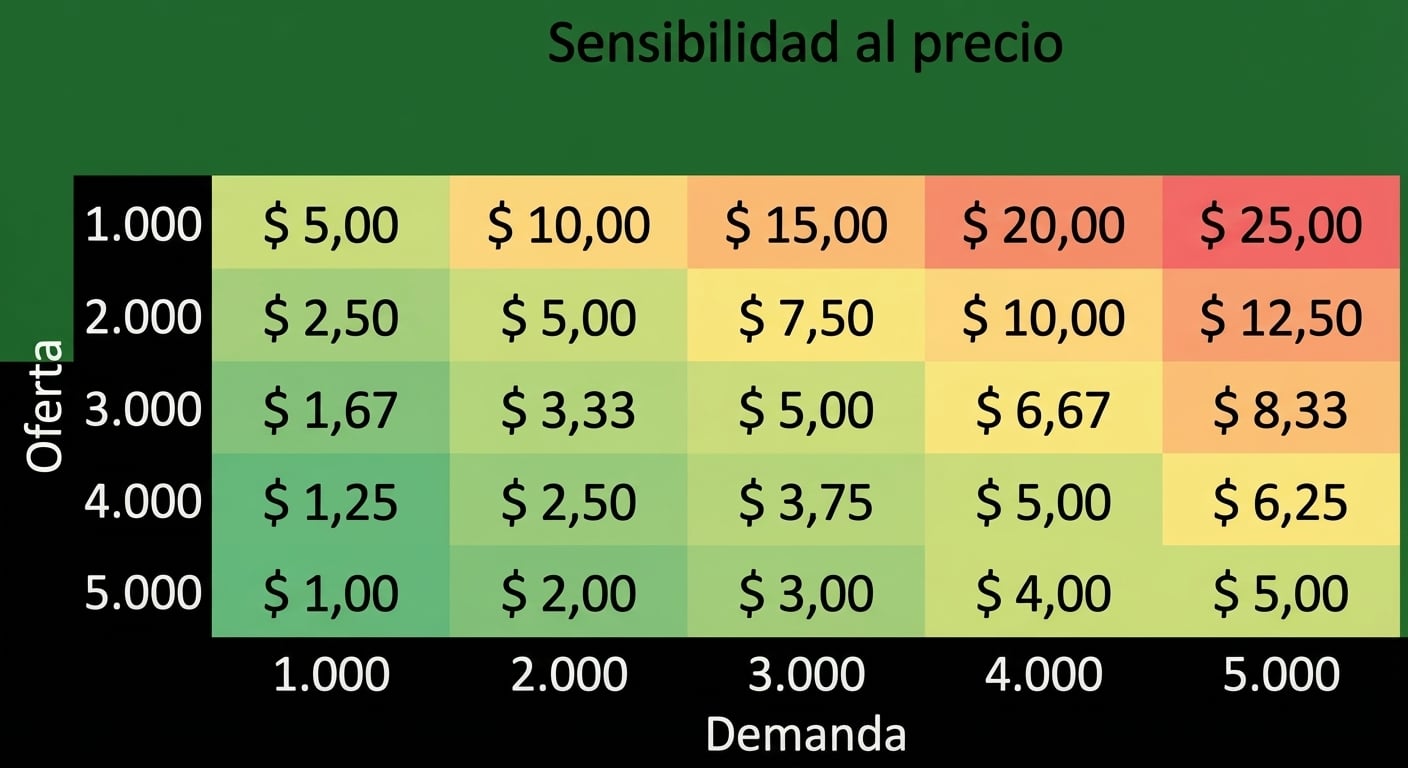
Tabla de sensibilidad
Tabla de sensibilidad
Tabla de sensibilidad
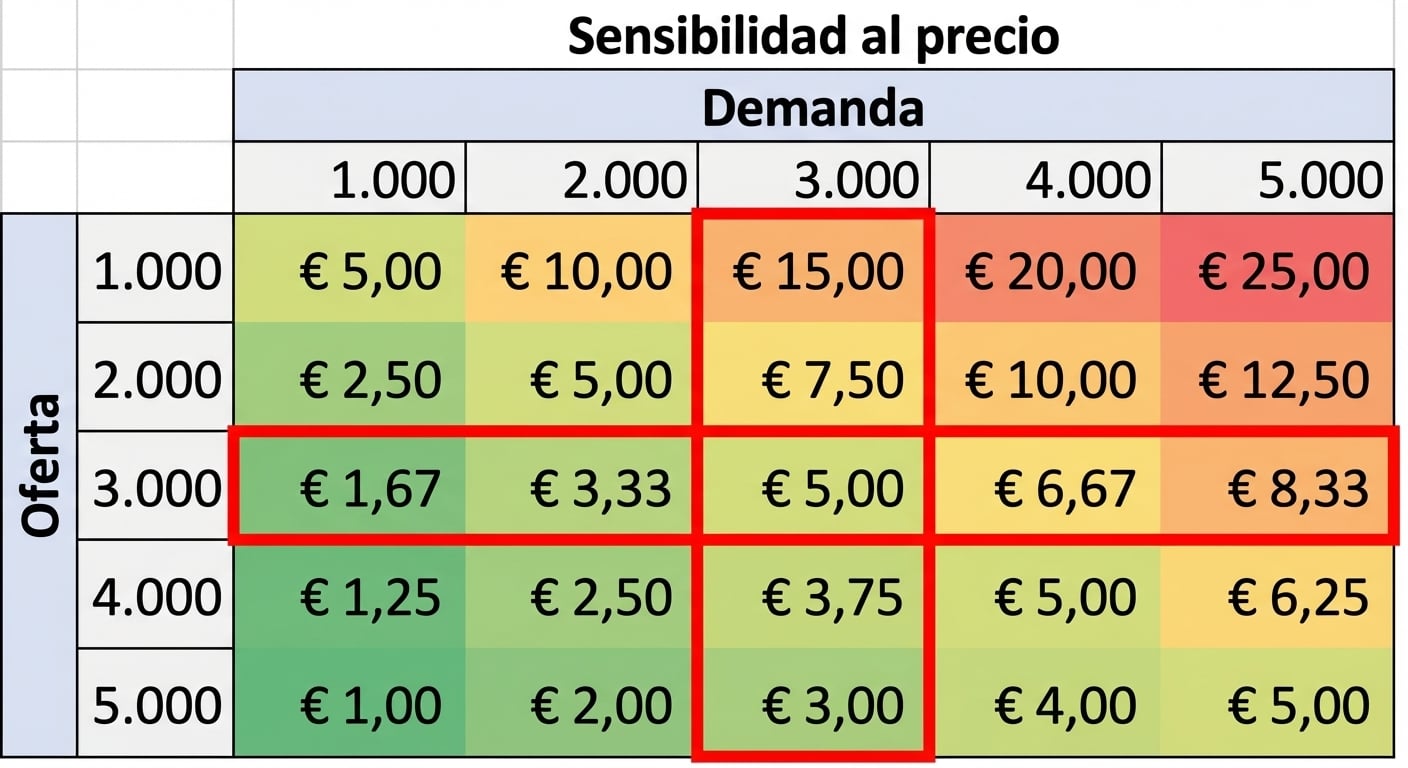
Tabla de sensibilidad
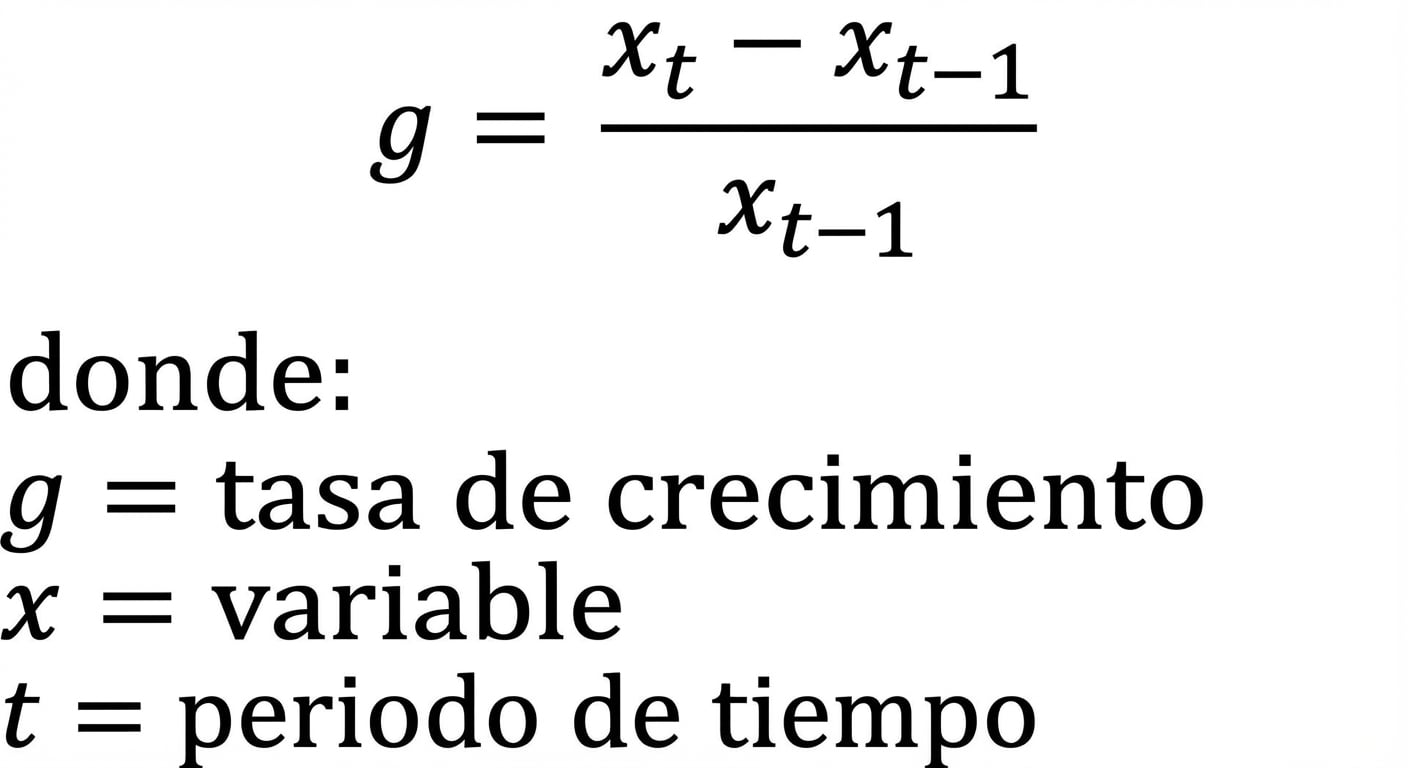
Tasa de crecimiento
- Calcula el cambio de x entre dos periodos
Tasa de crecimiento
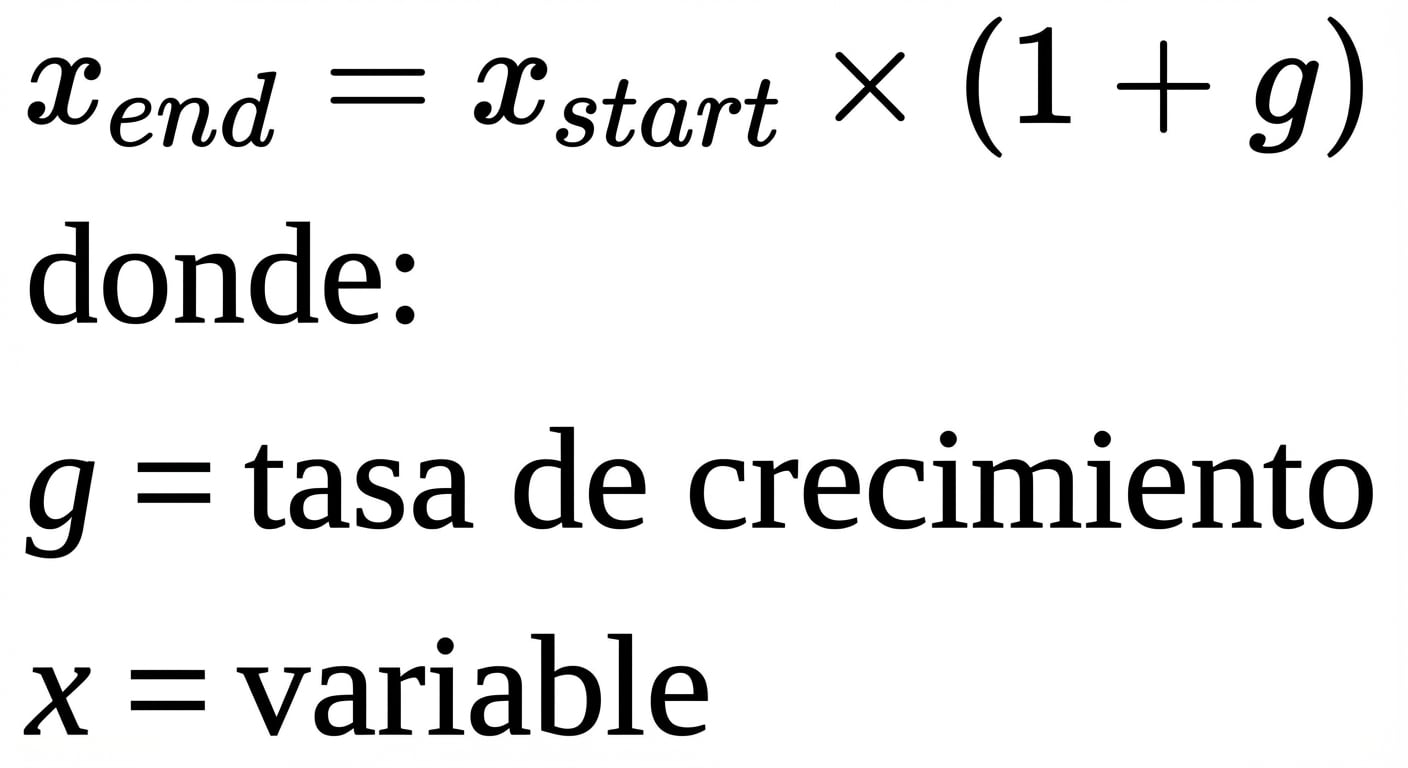
- ¡Suma
1agantes de multiplicar!

