Pronósticos
Análisis de datos en Excel

Nick Edwards
Analyst at Mynd
¿Qué es el pronóstico?

Estacionalidad
- La estacionalidad es la relación entre la época del año y el rendimiento.
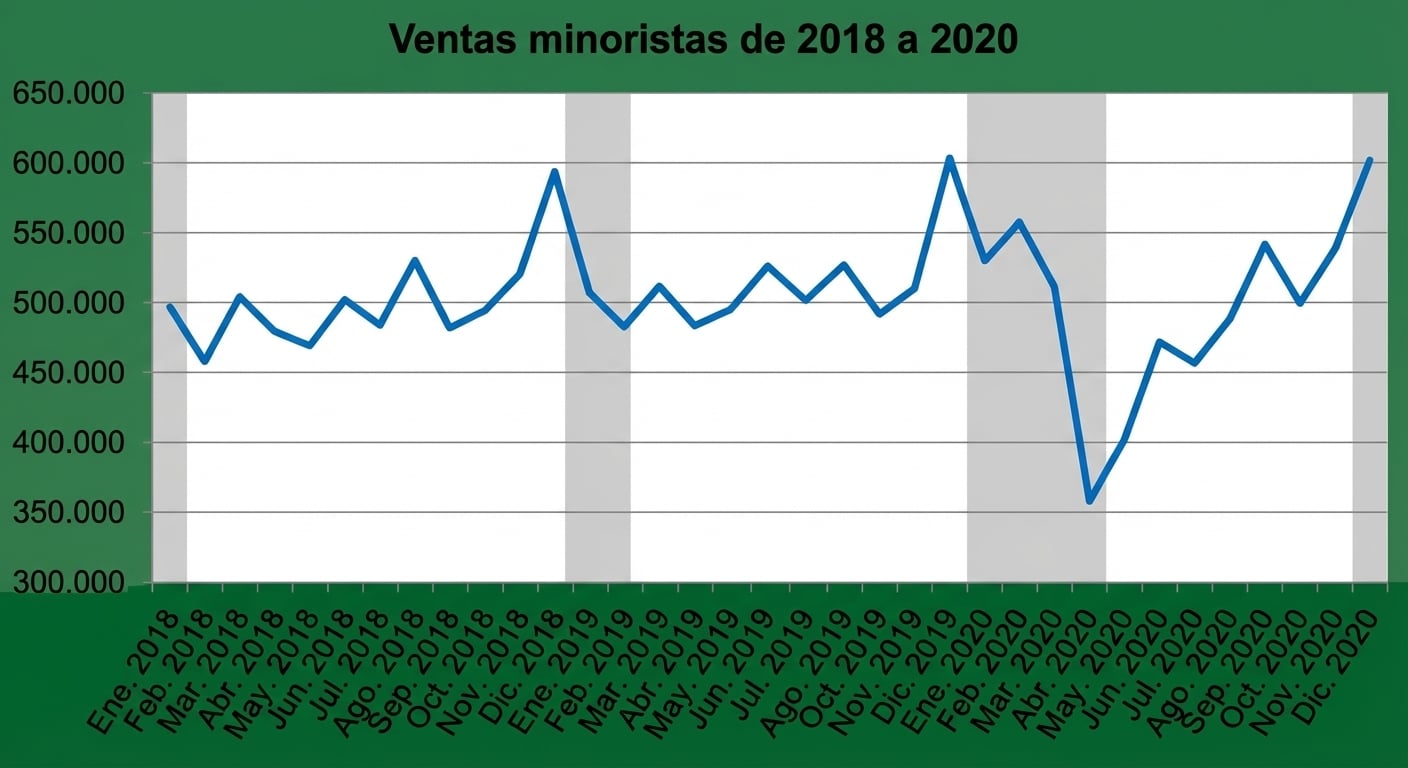
1 https://www.census.gov/retail/sales.html
Eso suena sesgado...

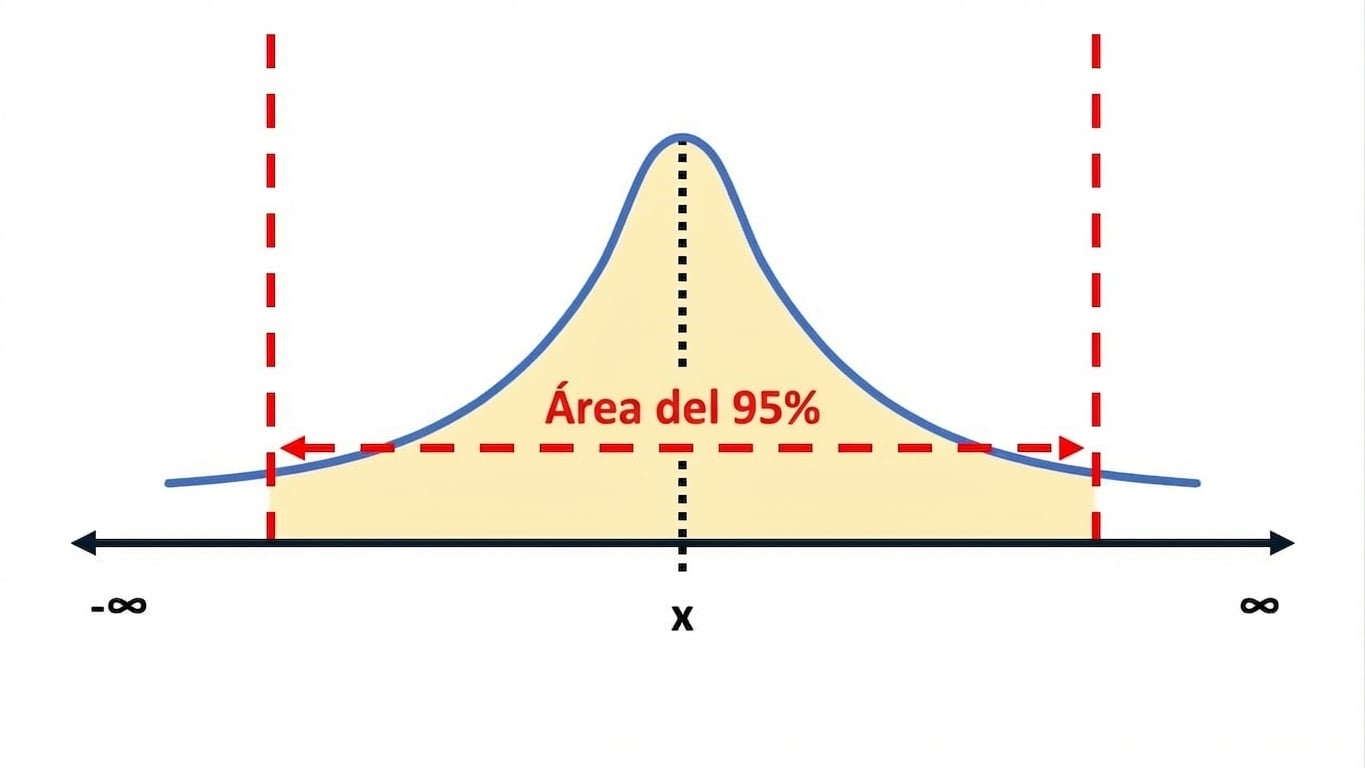
Intervalos de confianza
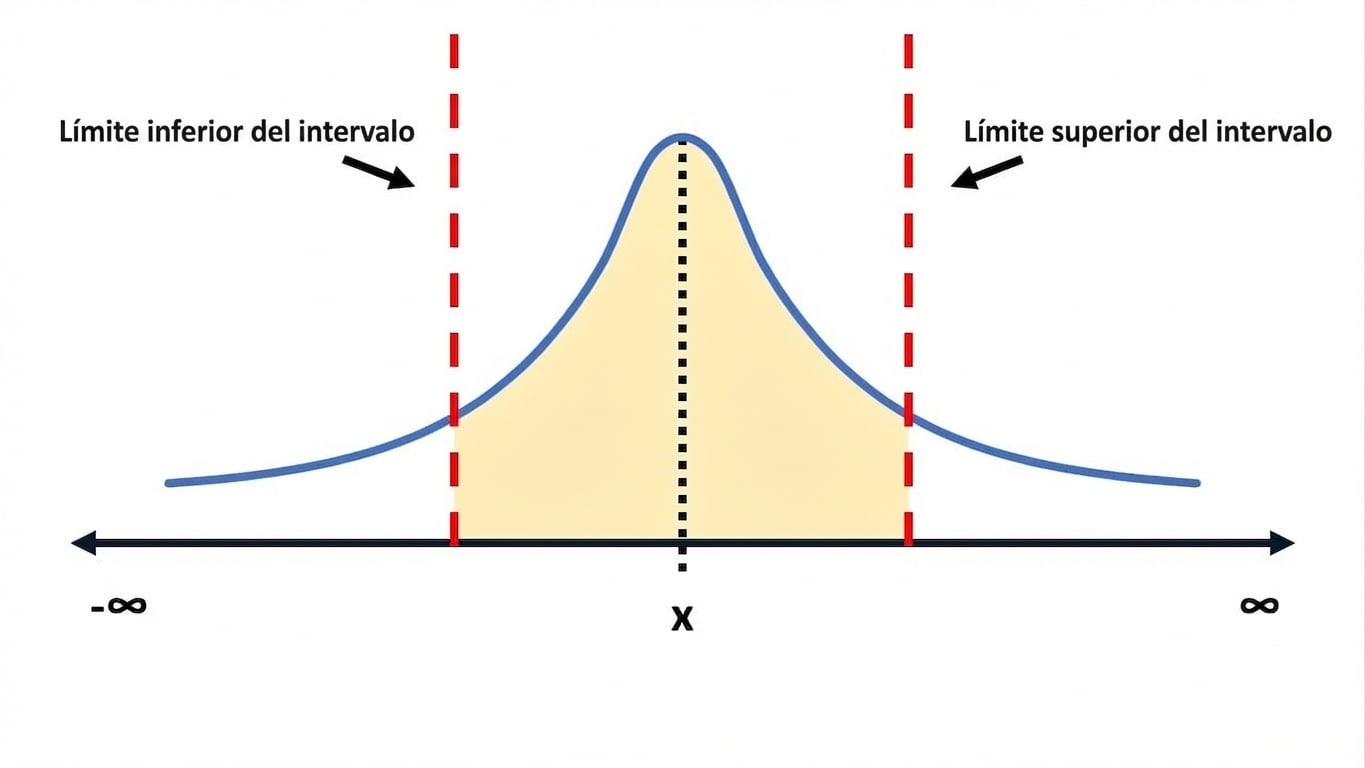
Intervalos de confianza
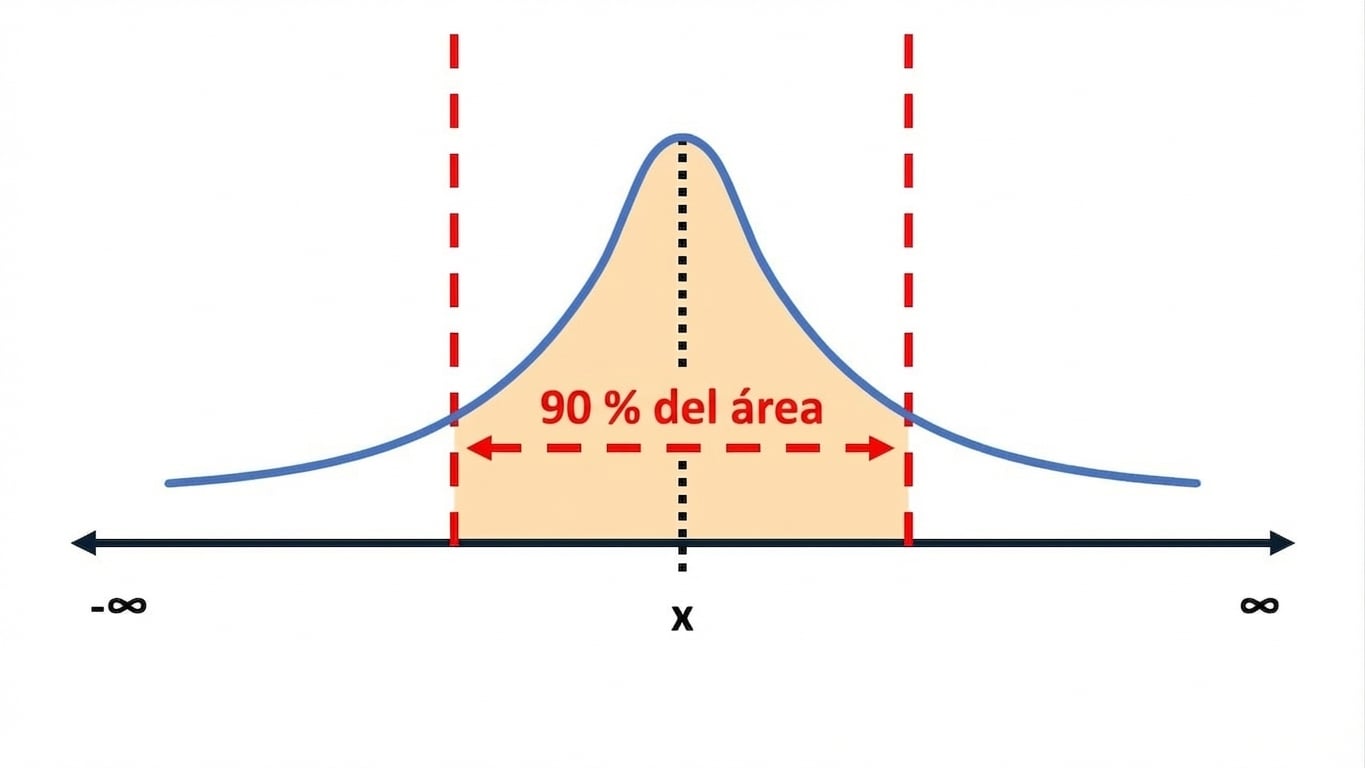
Intervalos de confianza
Medias móviles
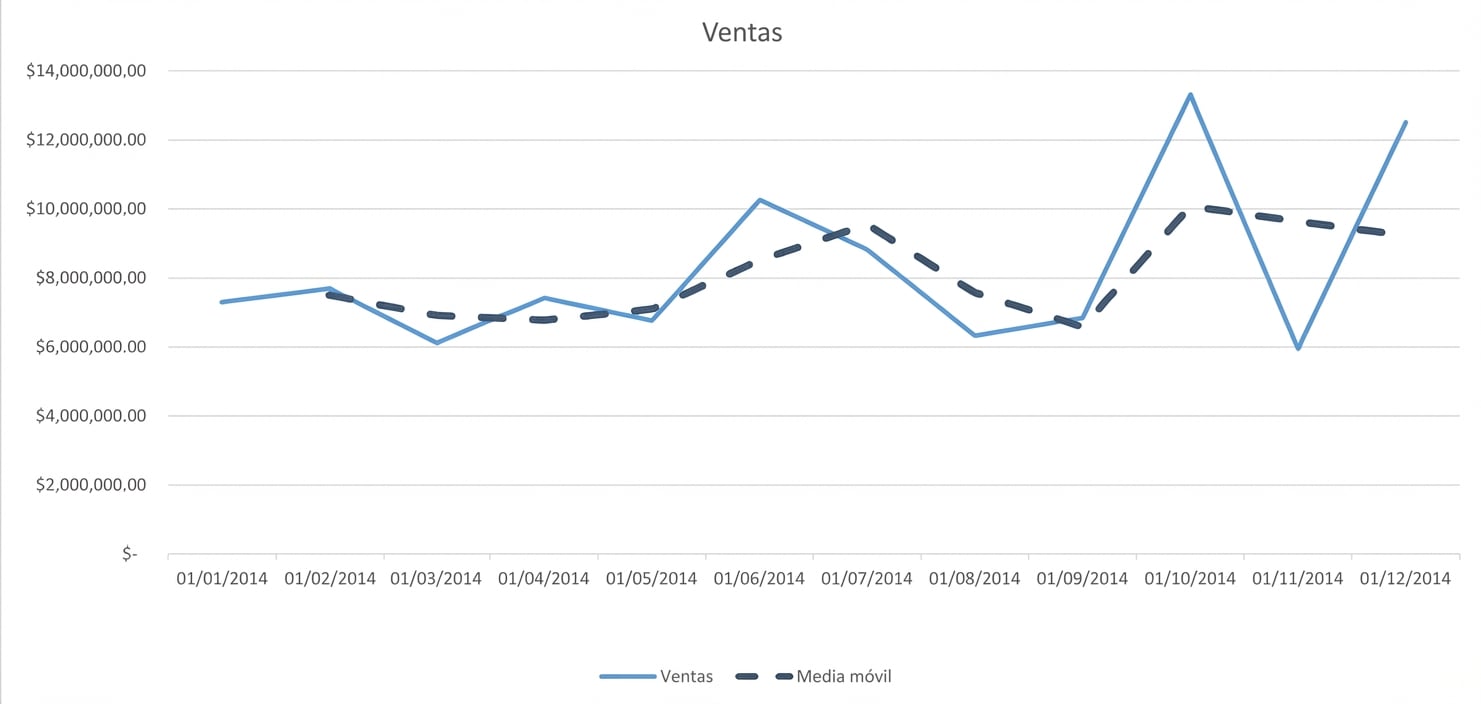
Medias ponderadas
Media móvil ponderada
- Multiplica los valores de una serie por su importancia asignada
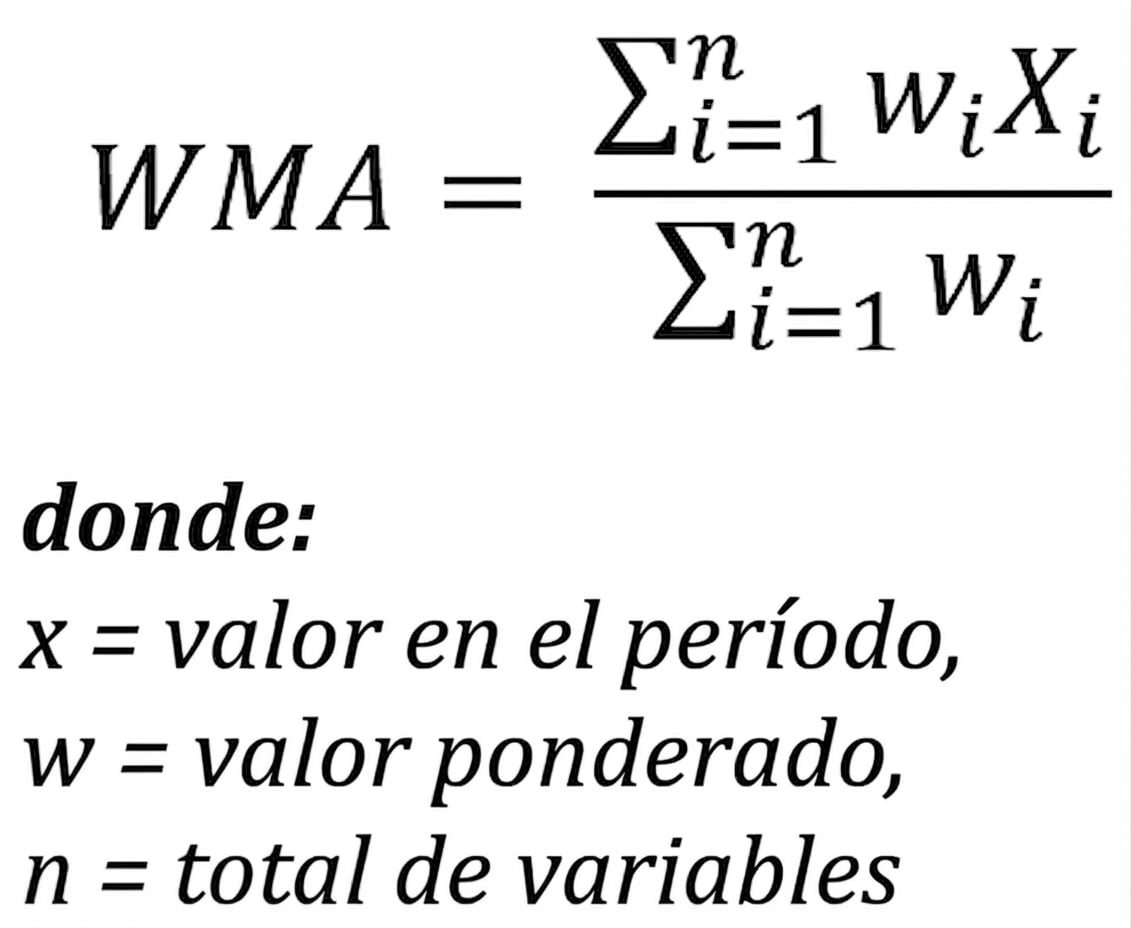
Medias ponderadas
Media móvil ponderada
- Multiplica los valores de una serie por su importancia asignada

