El teorema del límite central
Introducción a la estadística

George Boorman
Curriculum Manager, DataCamp
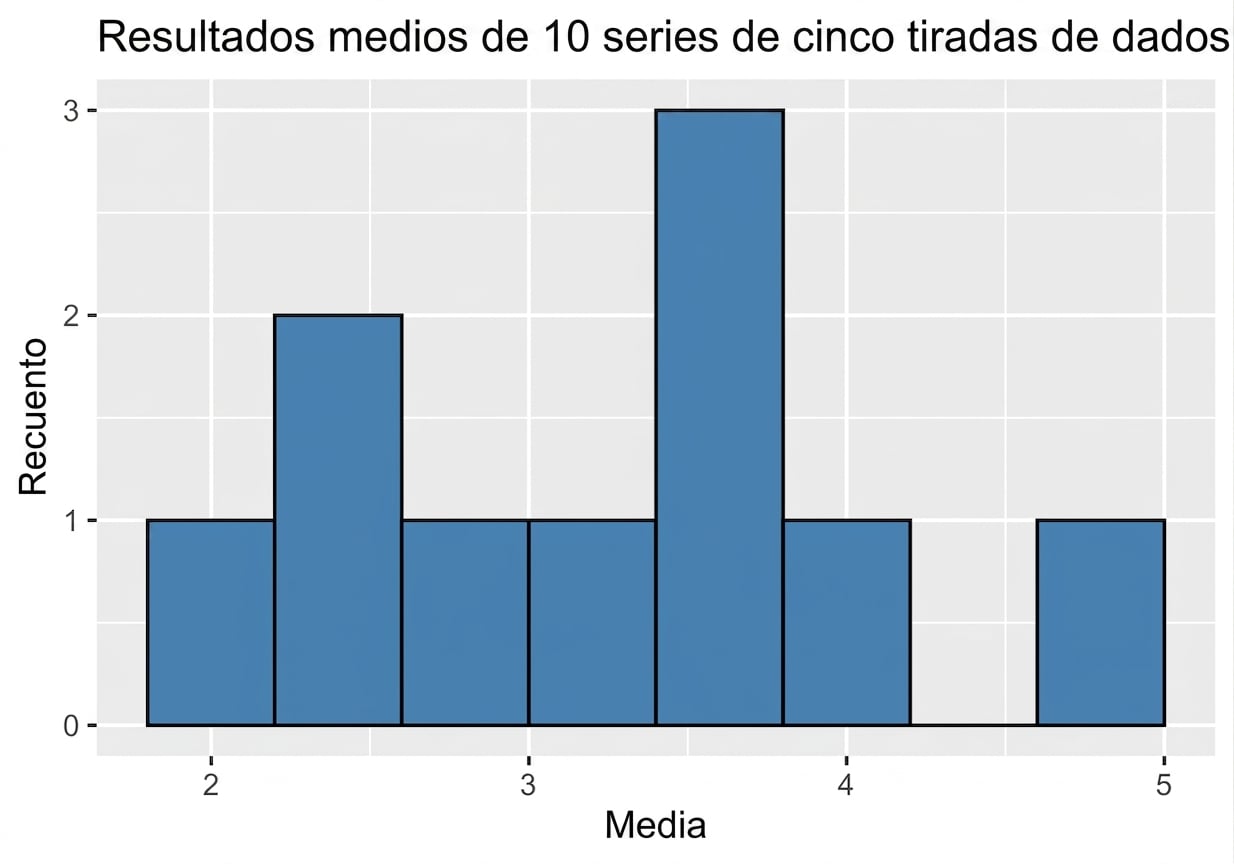
Tirar un dado cinco veces

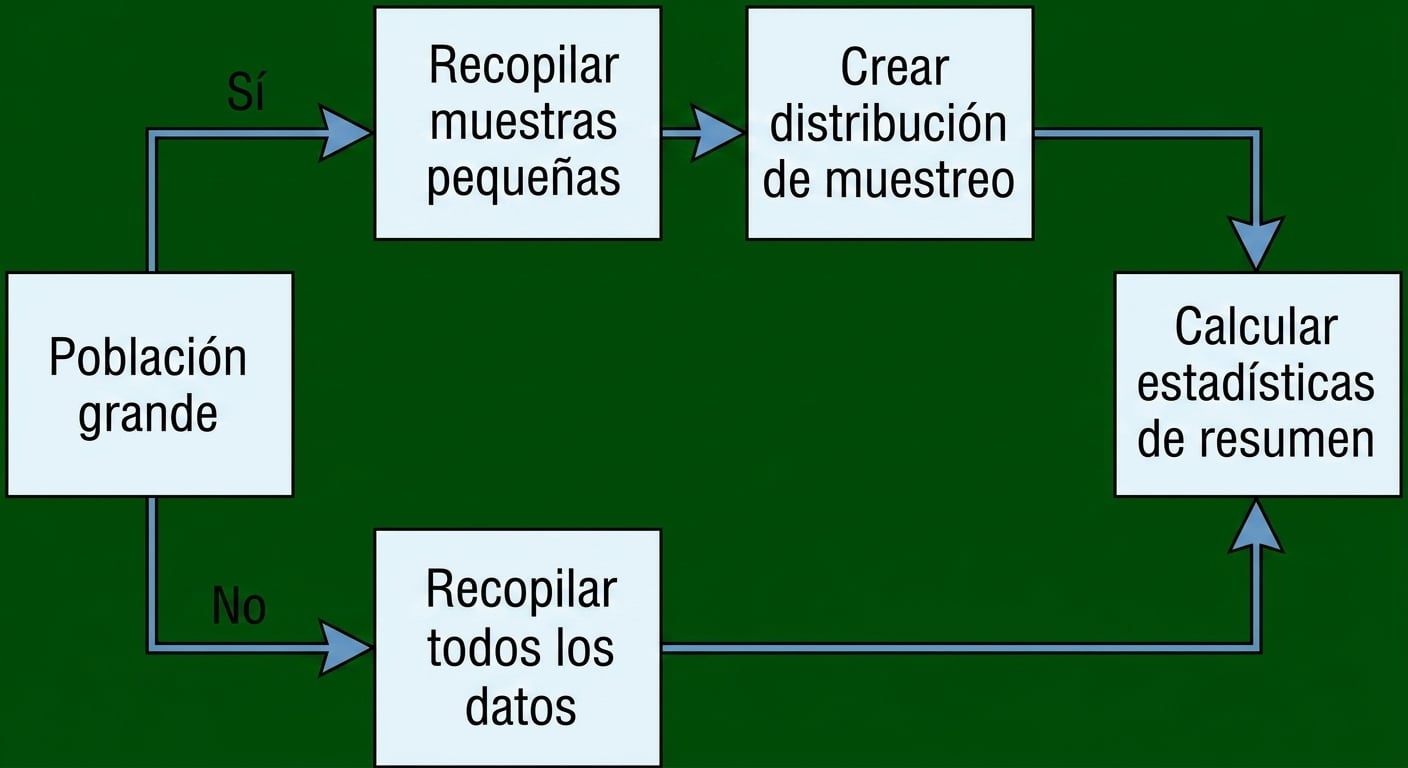
Distribuciones muestrales
Distribución muestral de la media muestral
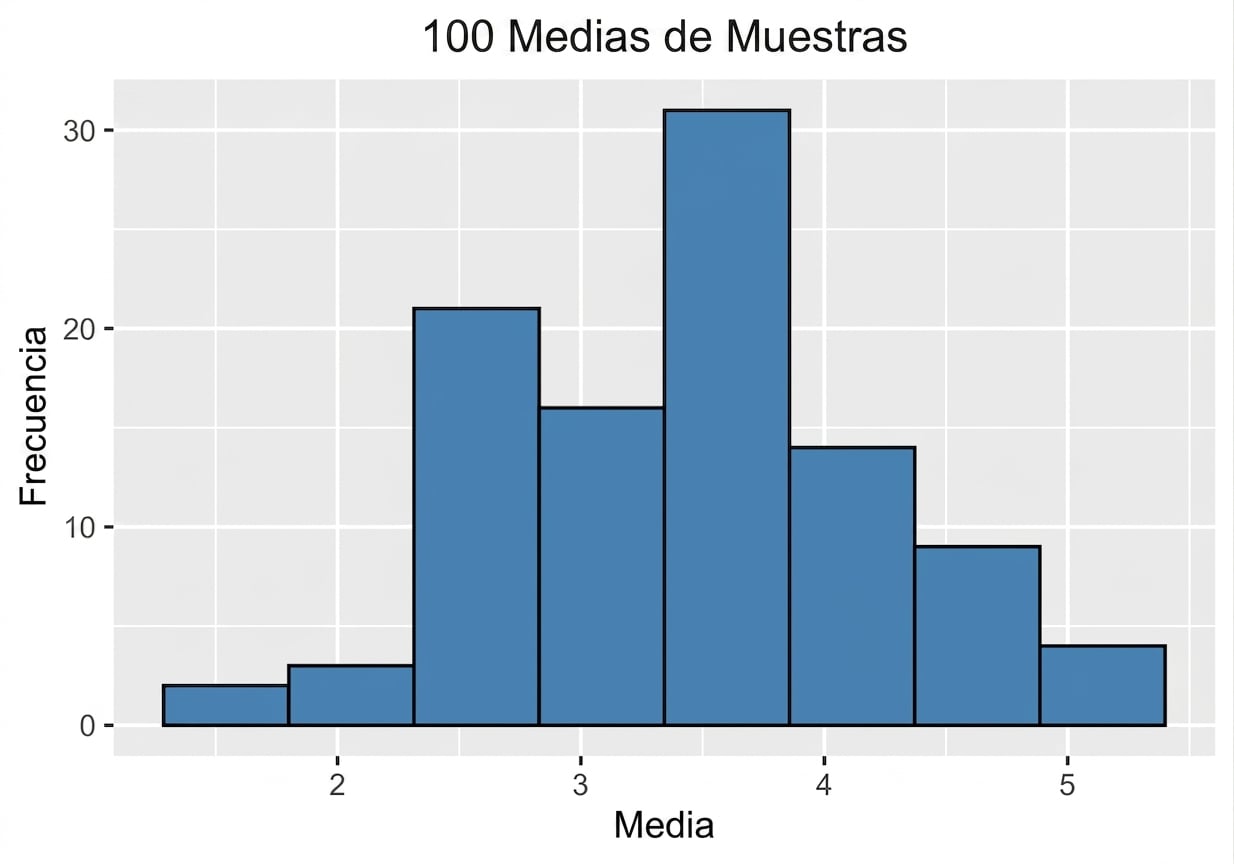
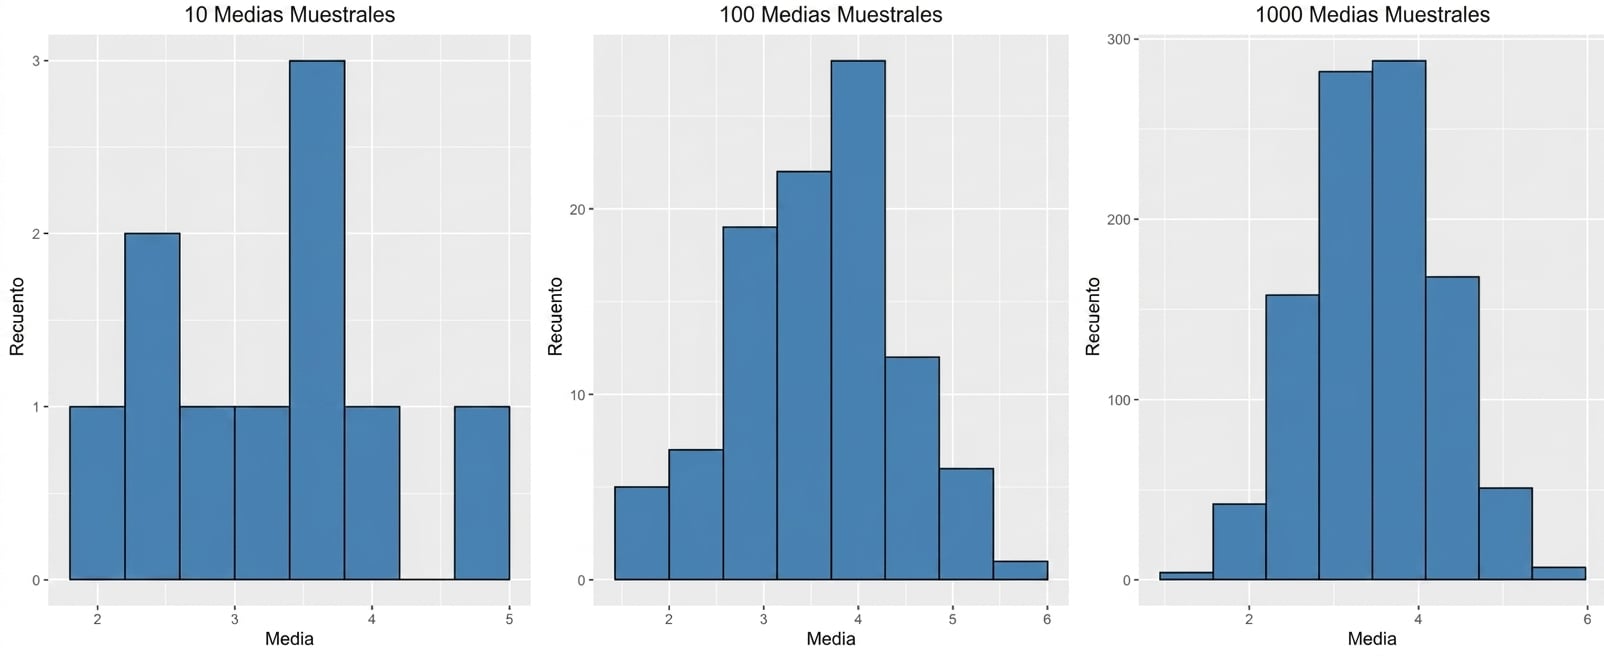
100 medias muestrales
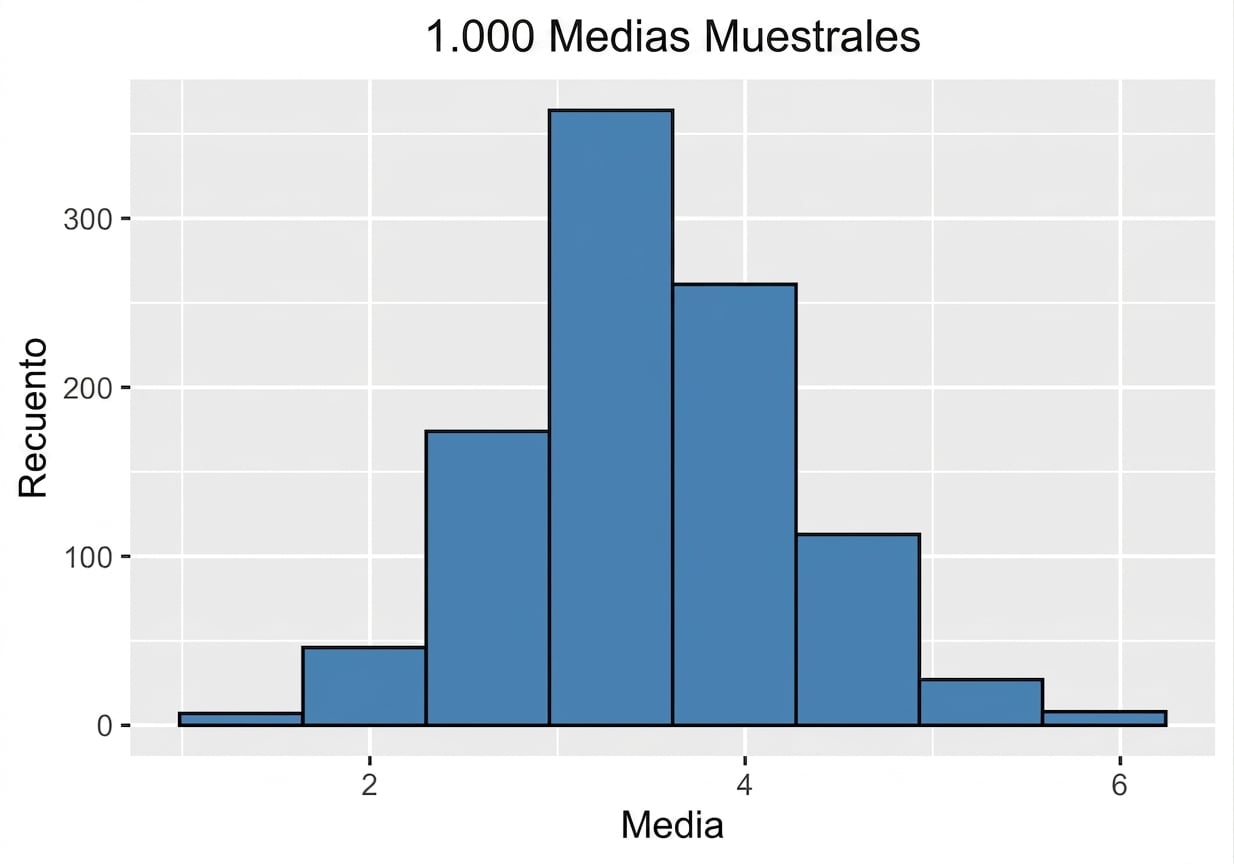
1000 medias muestrales
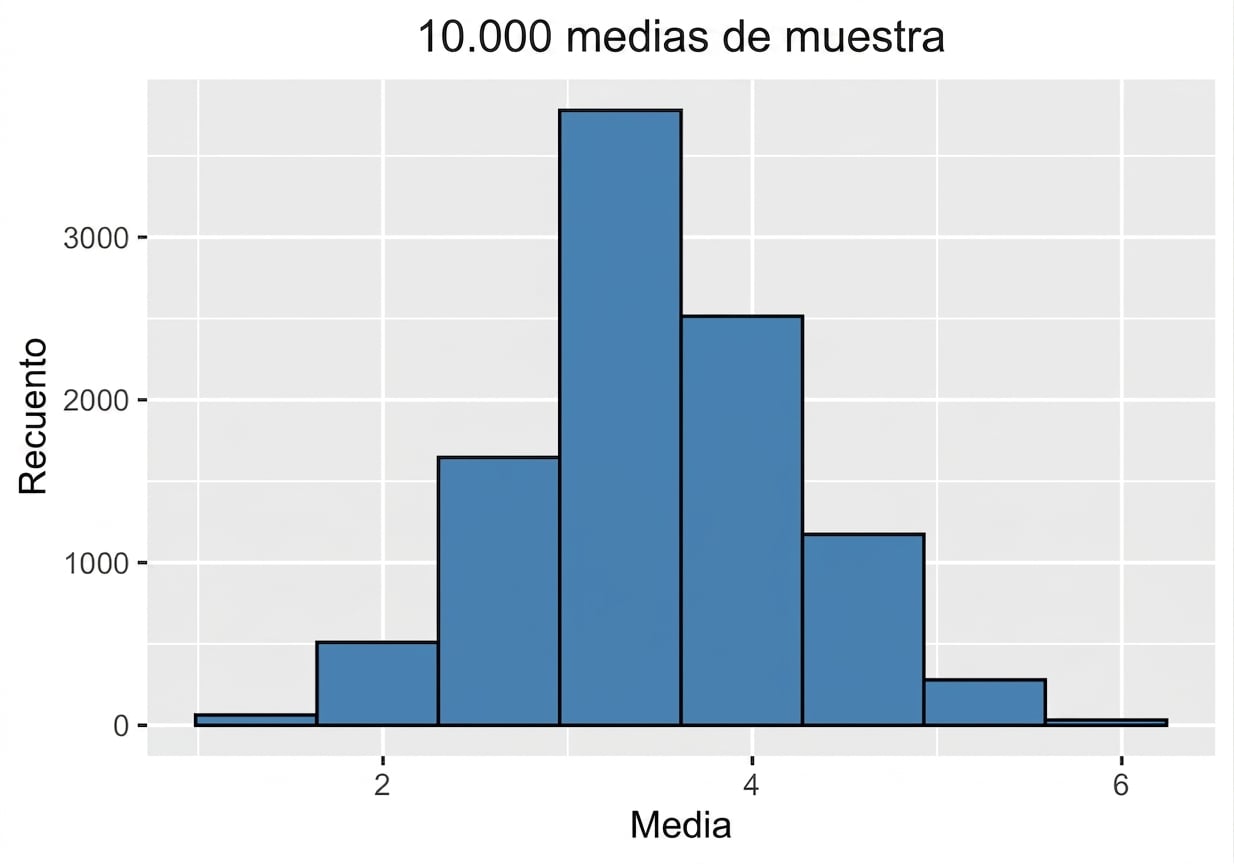
10 000 medias muestrales
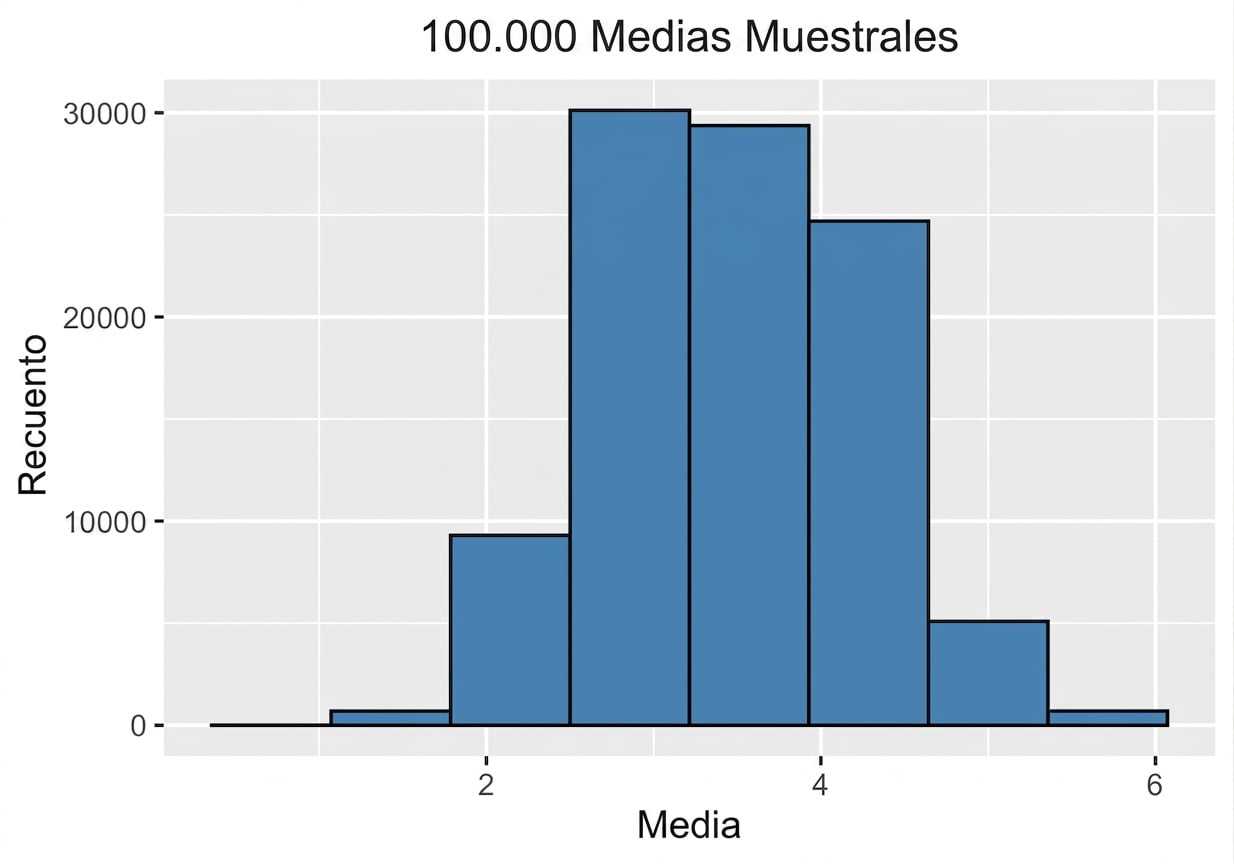
100 000 medias muestrales
Un millón de muestras significativas
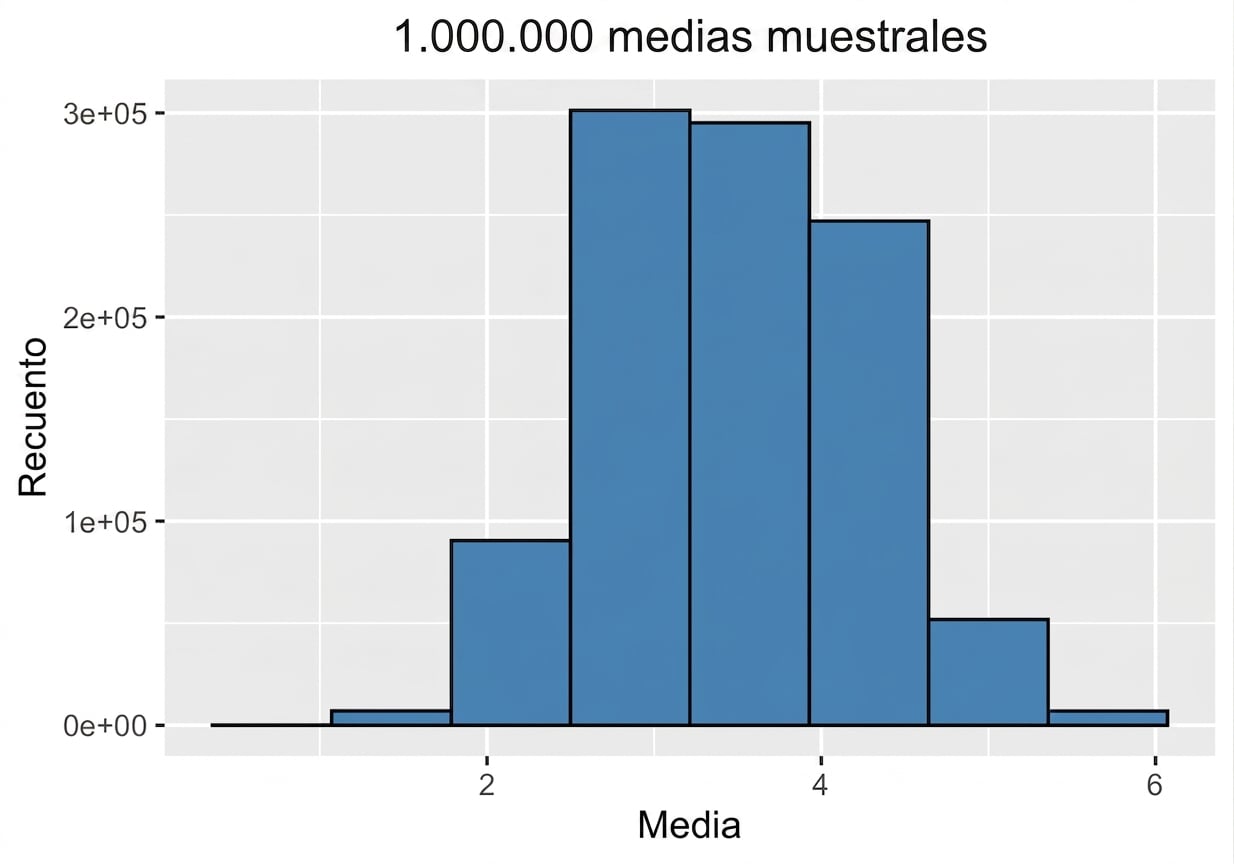
Teorema del límite central
La distribución muestral de una estadística se aproxima a la distribución normal a medida que aumenta el tamaño de la muestra.
- Las muestras deben ser aleatorias e independientes.
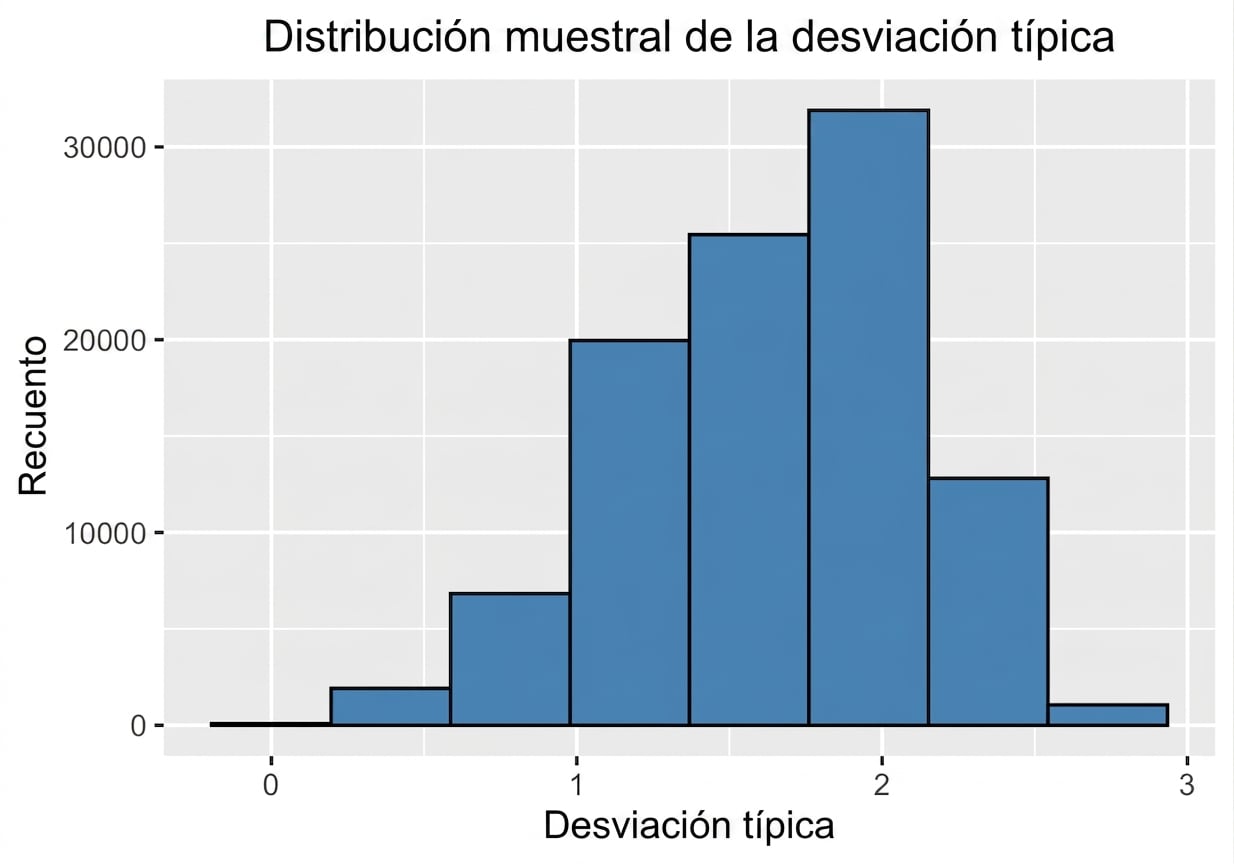
La desviación típica y el TLC
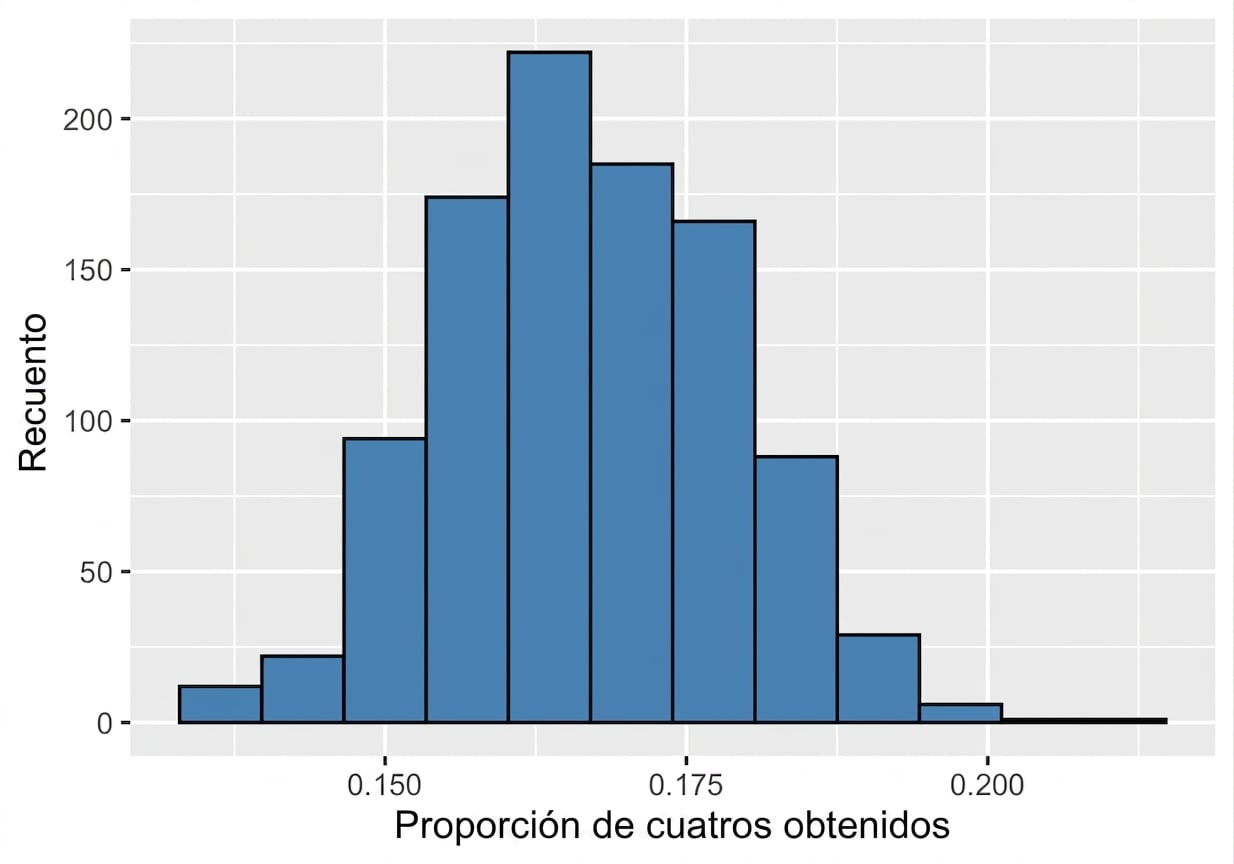
Distribución muestral de la proporción
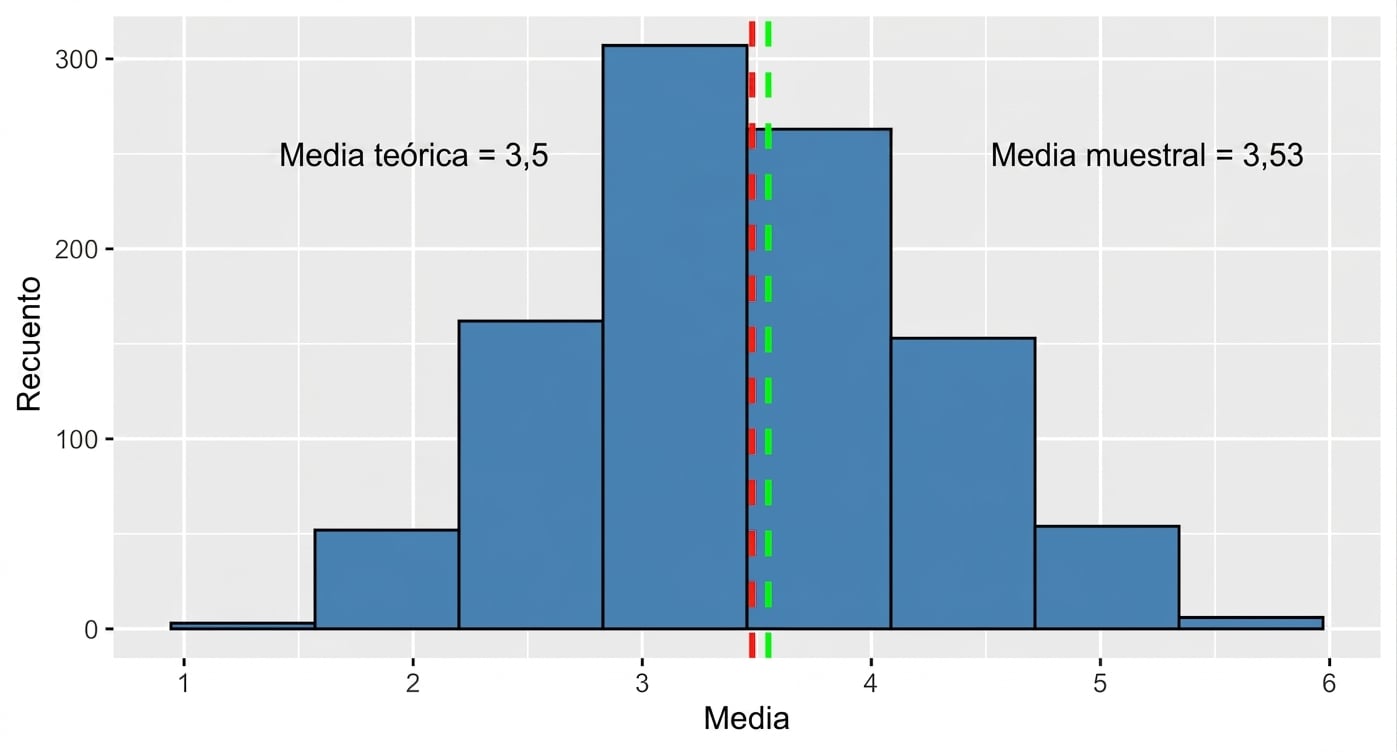
Media de la distribución muestral
Ventajas del teorema del límite central