Distribuciones continuas
Introducción a la estadística

George Boorman
Curriculum Manager, DataCamp
Esperar al autobús
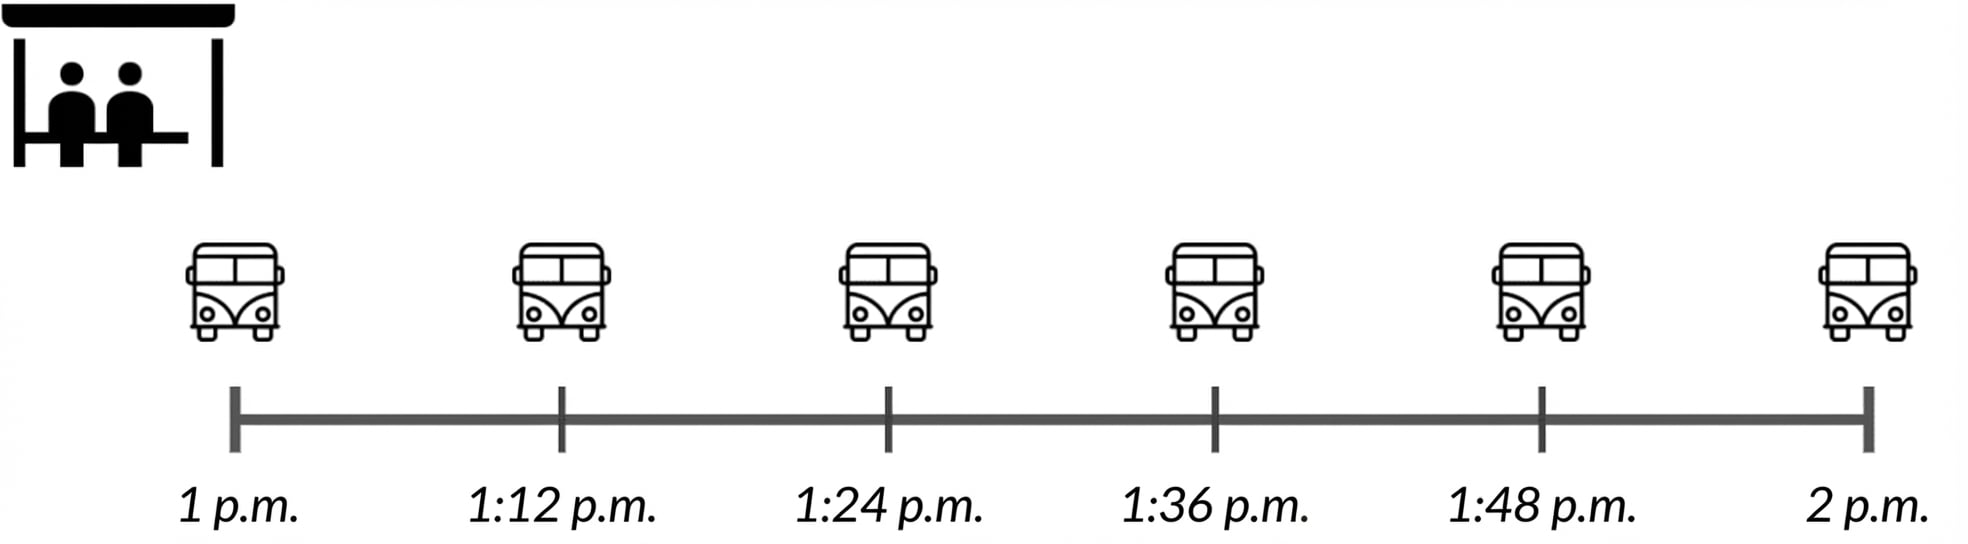
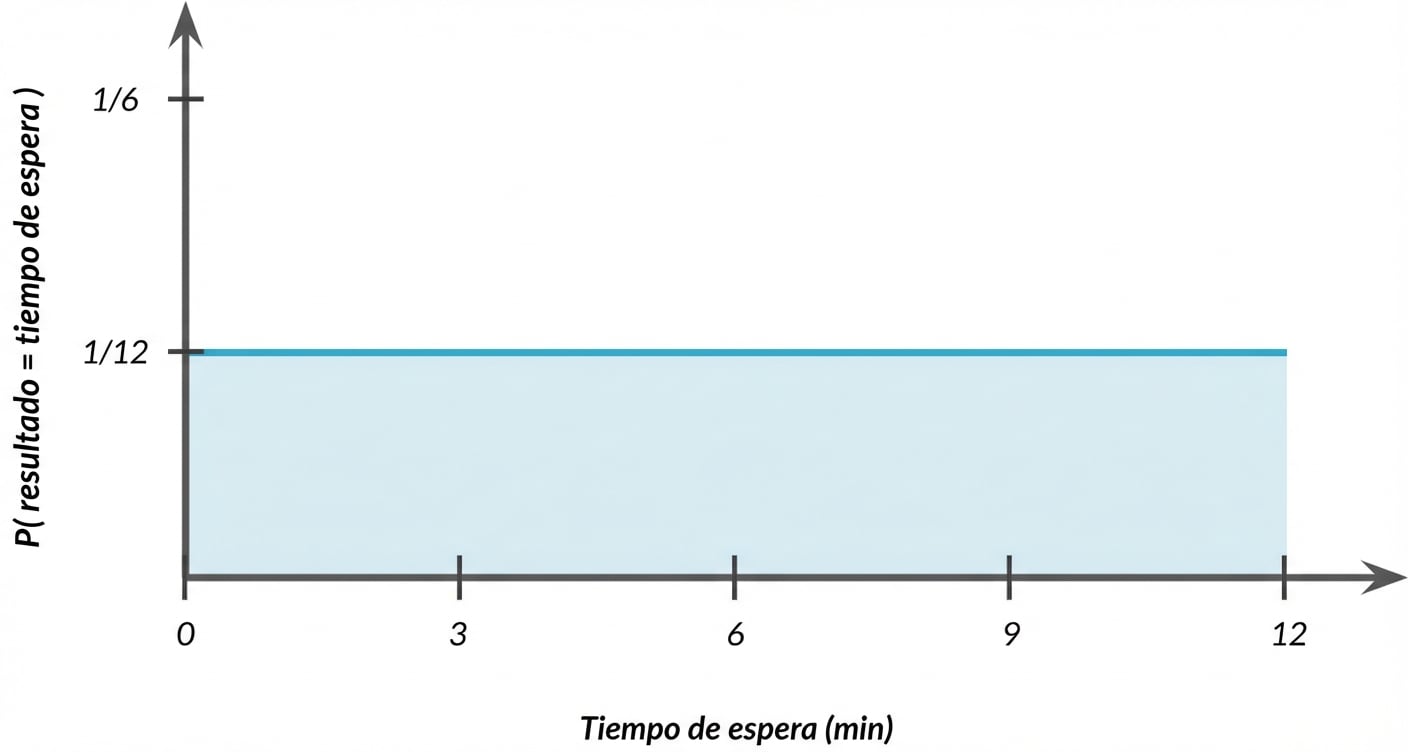
Distribución uniforme continua
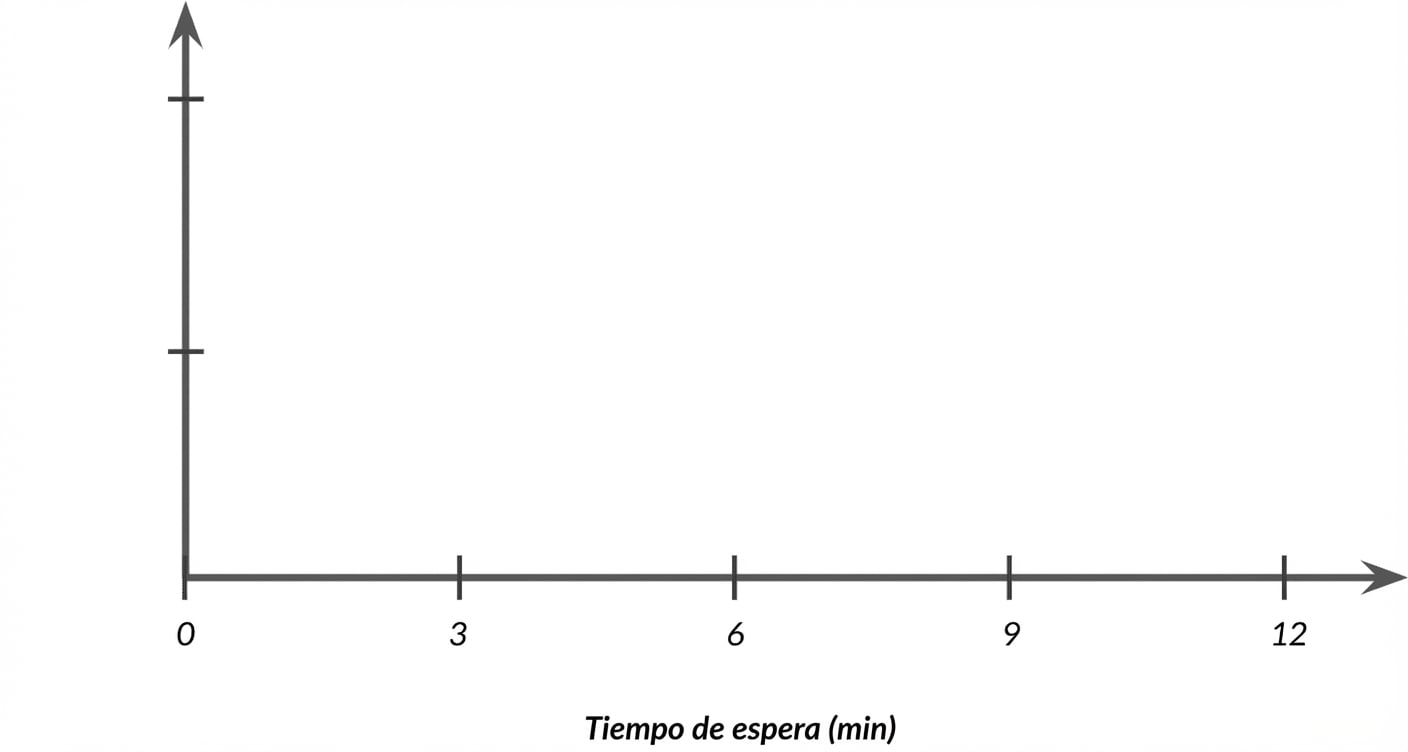
Distribución uniforme continua
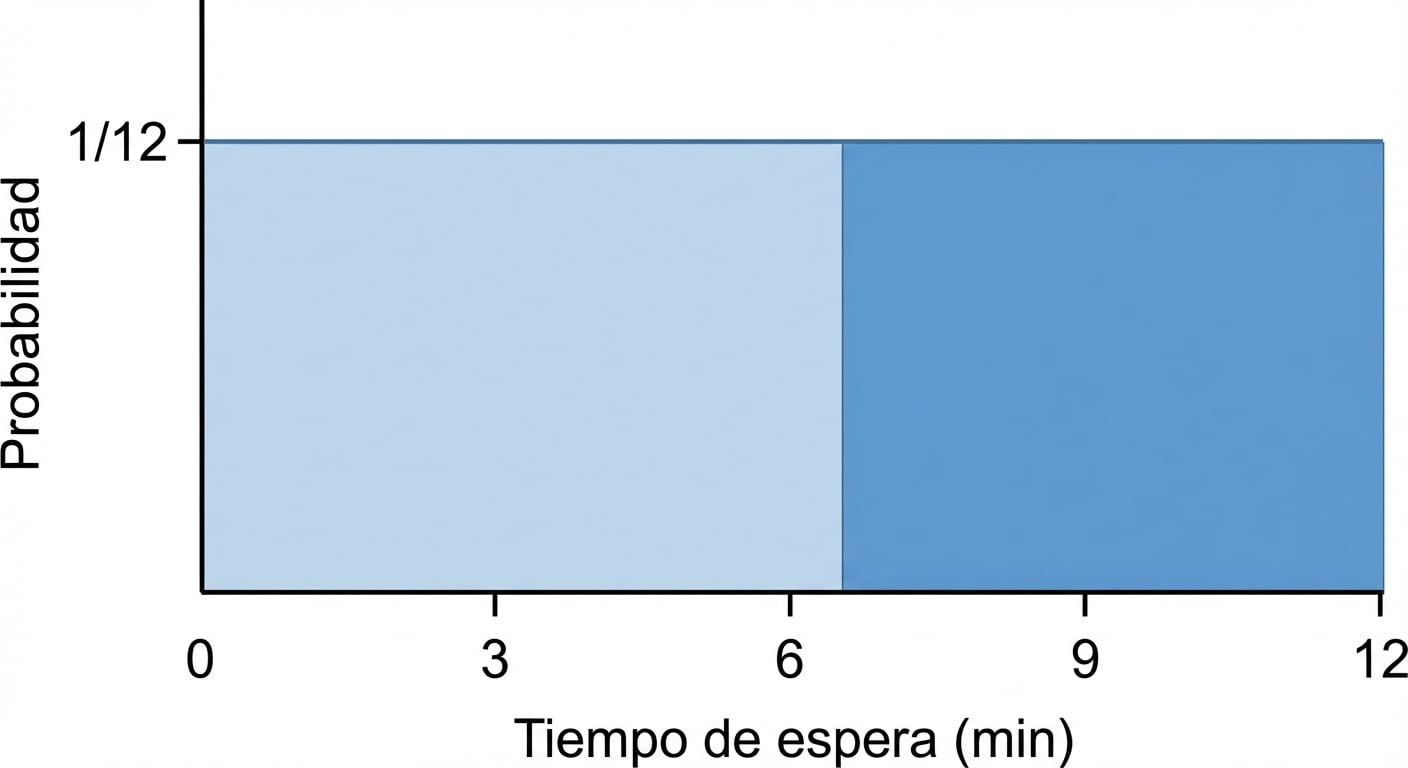
Probabilidad aún = área
$$P(4 \le \text{wait time} \le 7) = ~~ ?$$
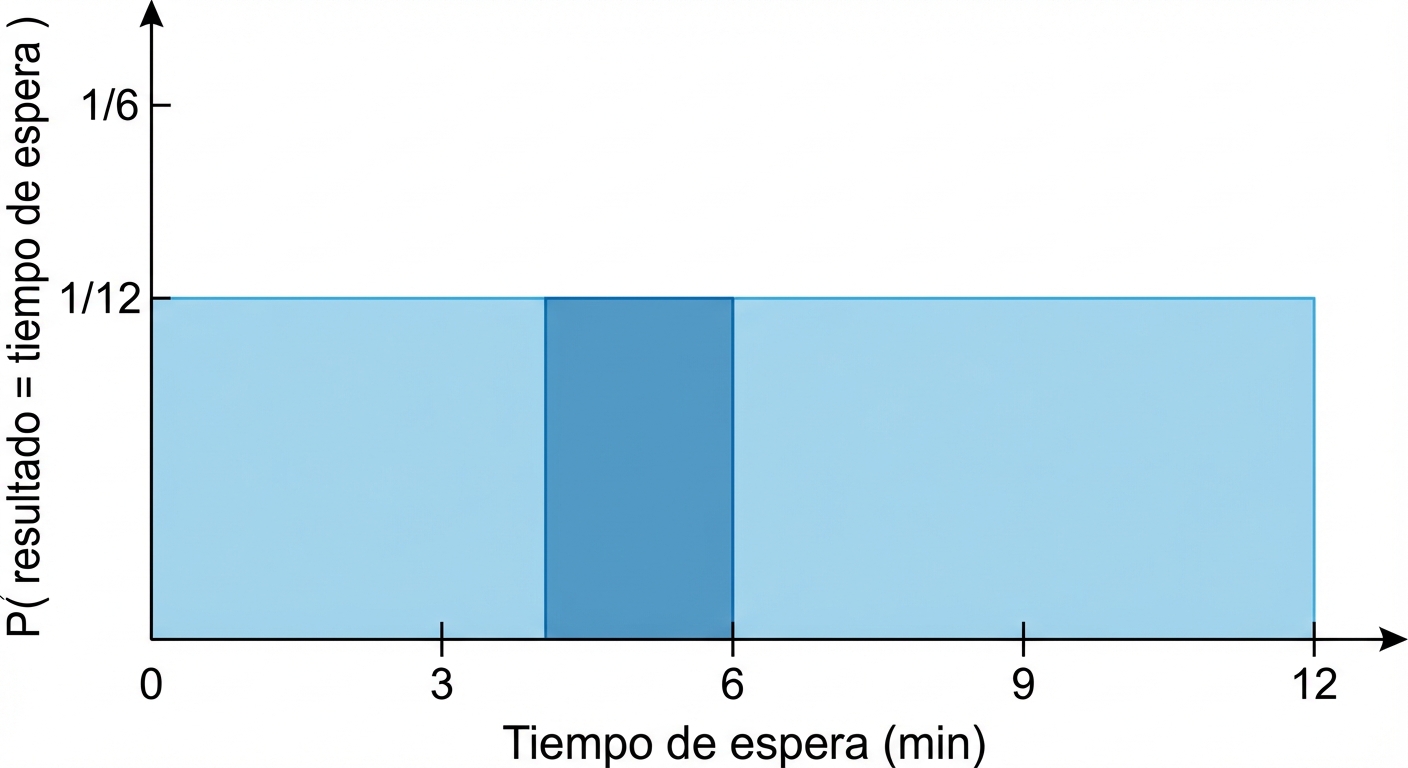
Probabilidad aún = área
$$P(4 \le \text{wait time} \le 7) = ~~ ?$$
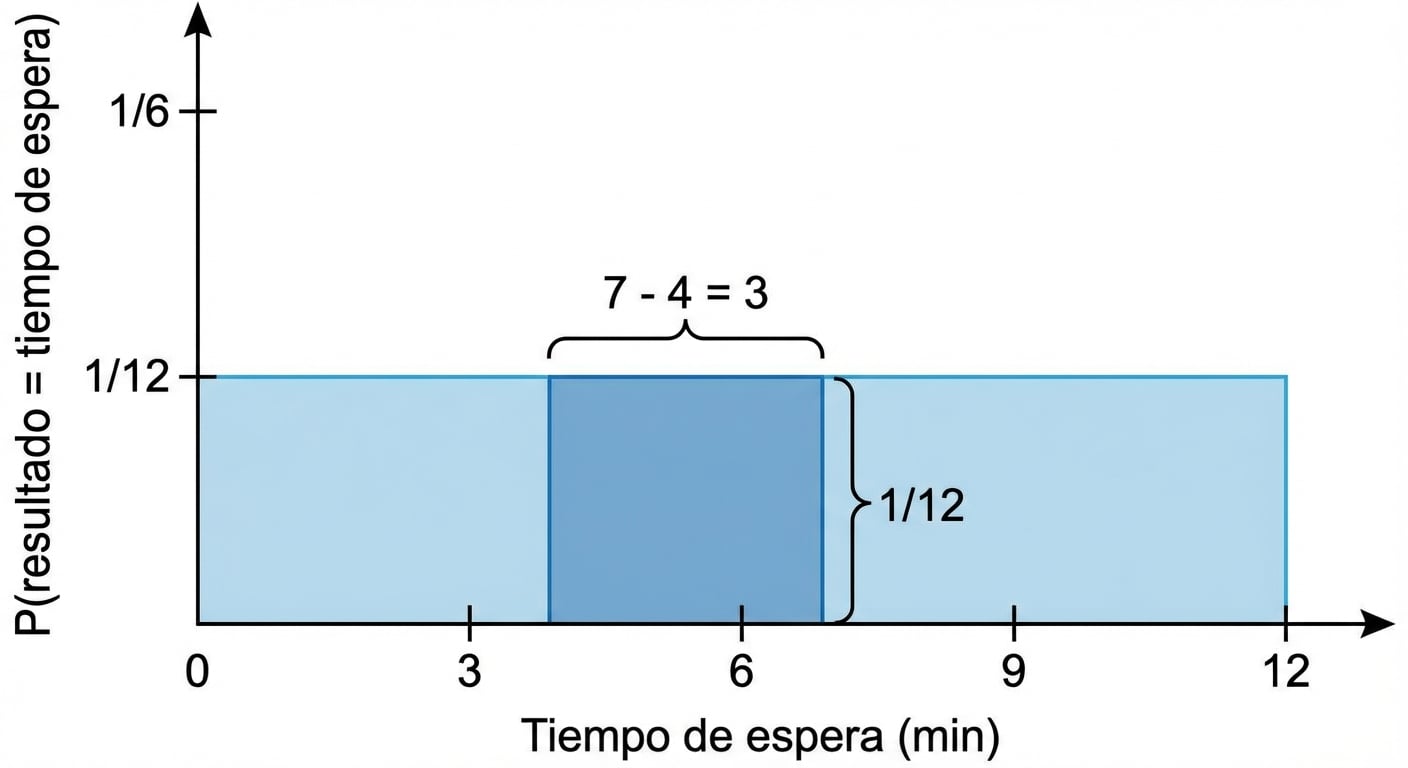
Probabilidad aún = área
$$P(4 \le \text{wait time} \le 7) = 3 \times 1/12 = 3/12$$
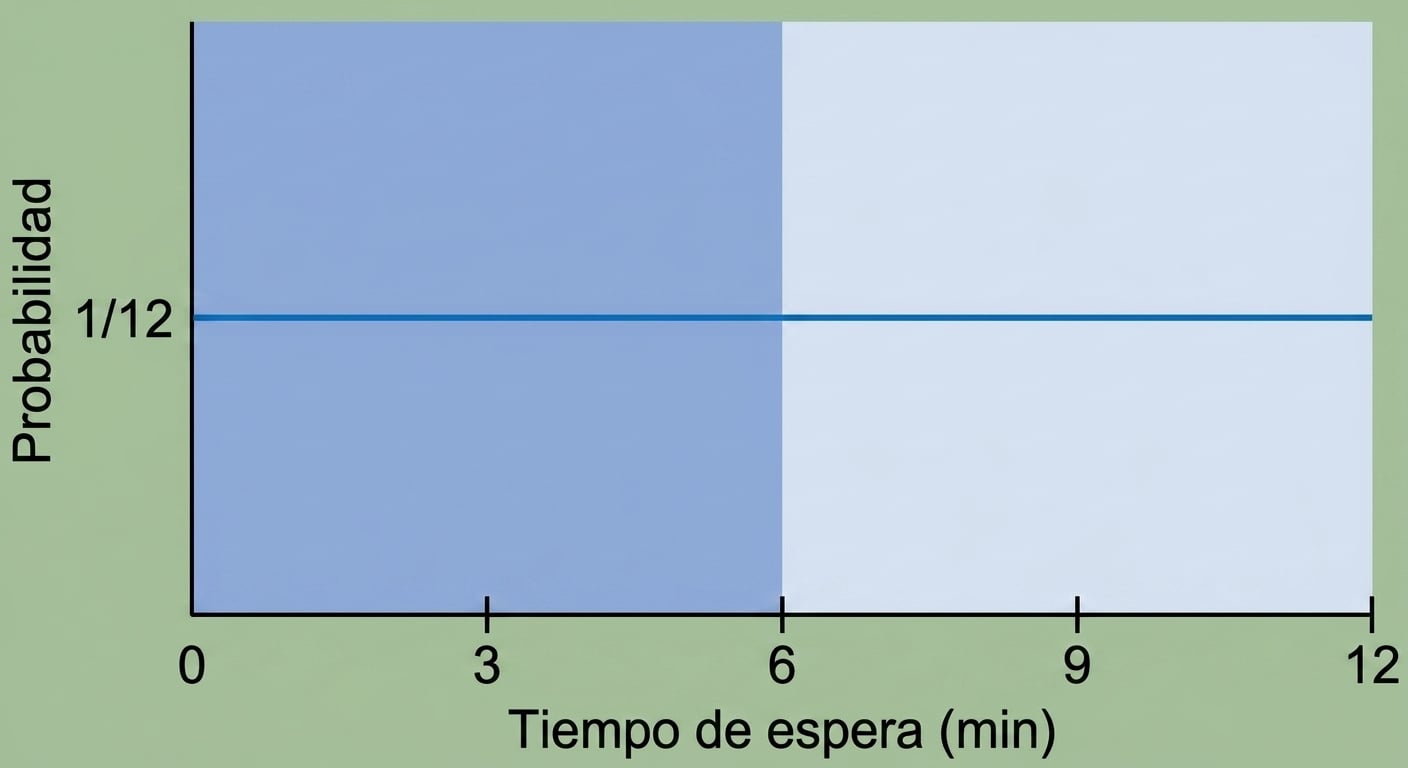
Esperar siete minutos o menos
$$ P(\text{wait time} \le 7) = ~~ ?$$
$$ P(\text{tiempo de espera} \le 7) = \frac{7-0}{12} $$
$$ P(\text{tiempo de espera} \le 7) = \frac{7}{12} = 58,33 % $$
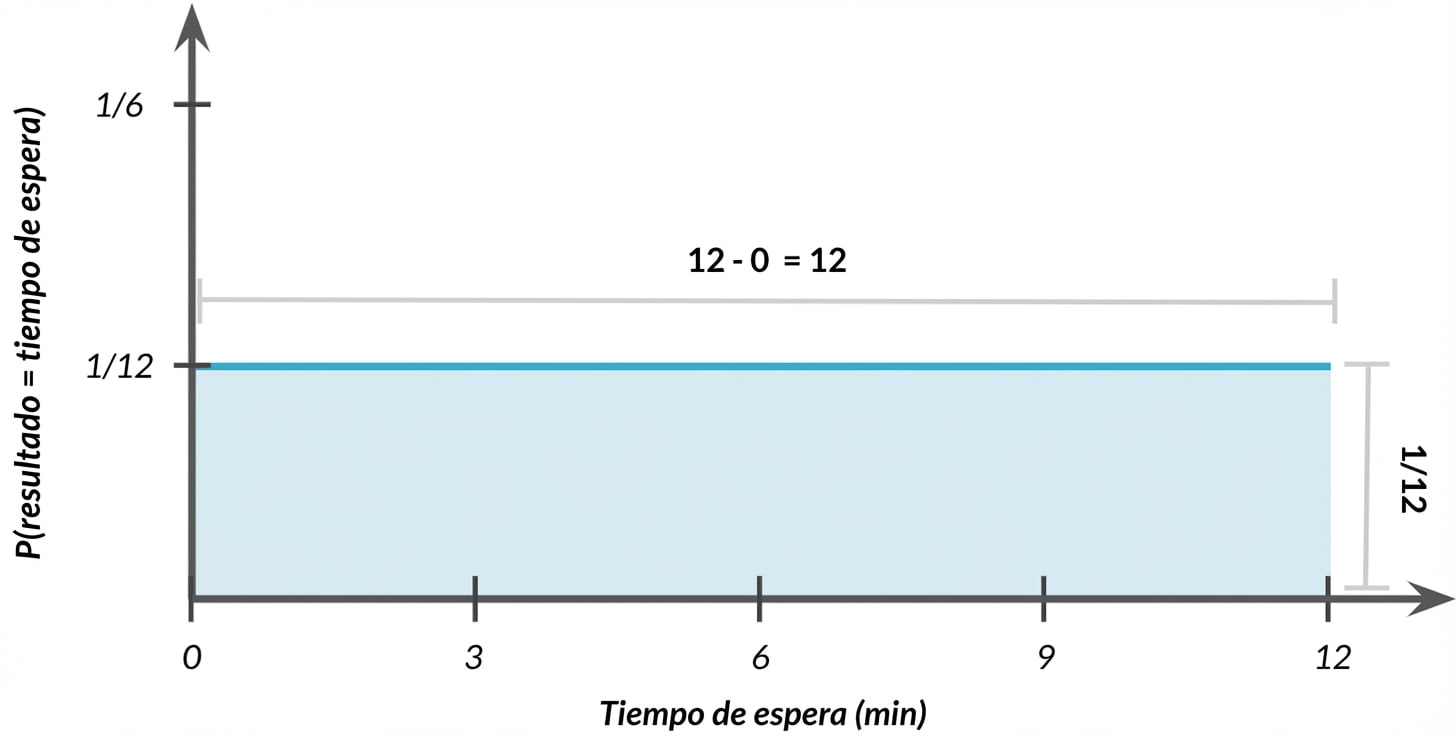
Área total = 1
$$P(0 \le \text{wait time} \le 12) = ~~ ?$$
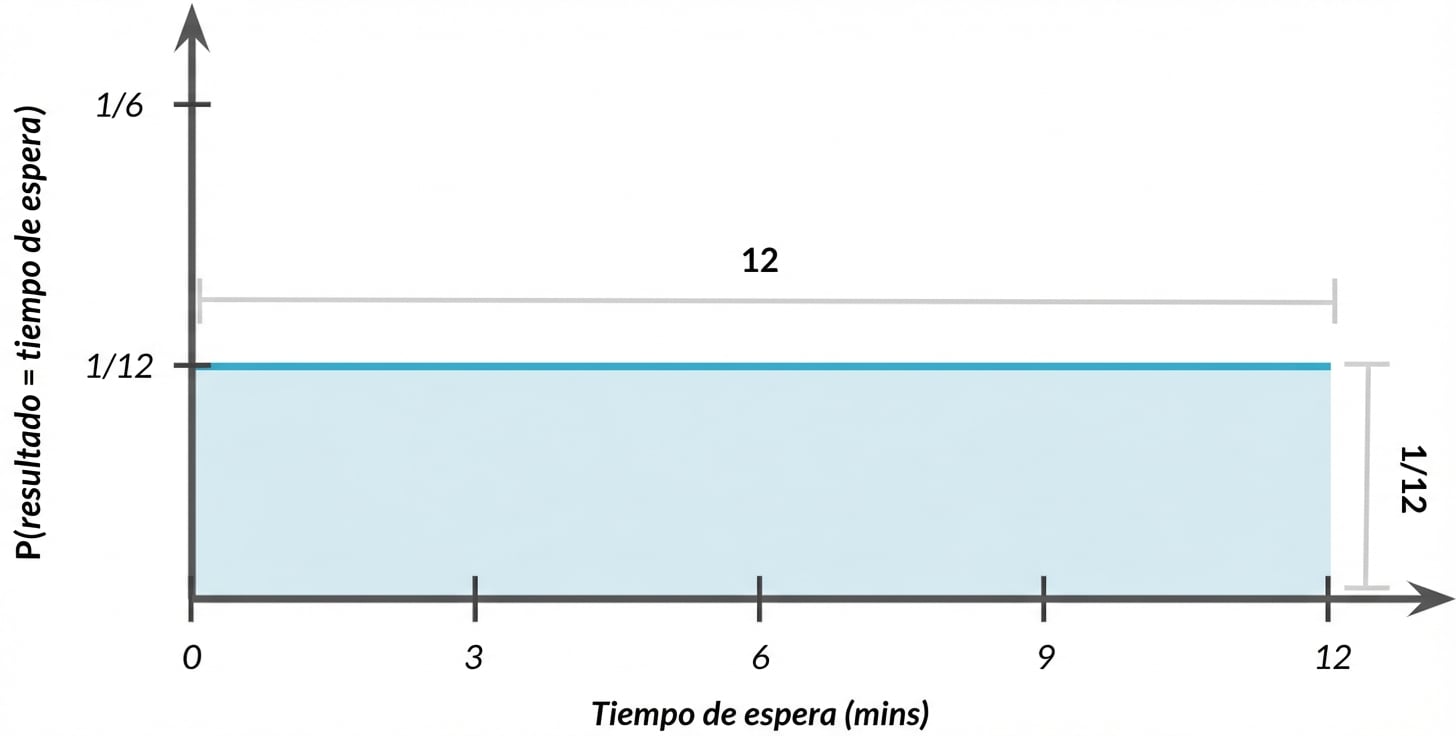
Área total = 1
$$P(0 \le \text{outcome} \le 12) = 12 \times 1/12 = 1$$
Probabilidad de esperar más de 7 minutos
$$ P(\text{tiempo de espera} \ge 7) = 1 - \frac{7}{12} $$
$$ P(\text{tiempo de espera} \ge 7) = \frac{5}{12} = 41,67 % $$
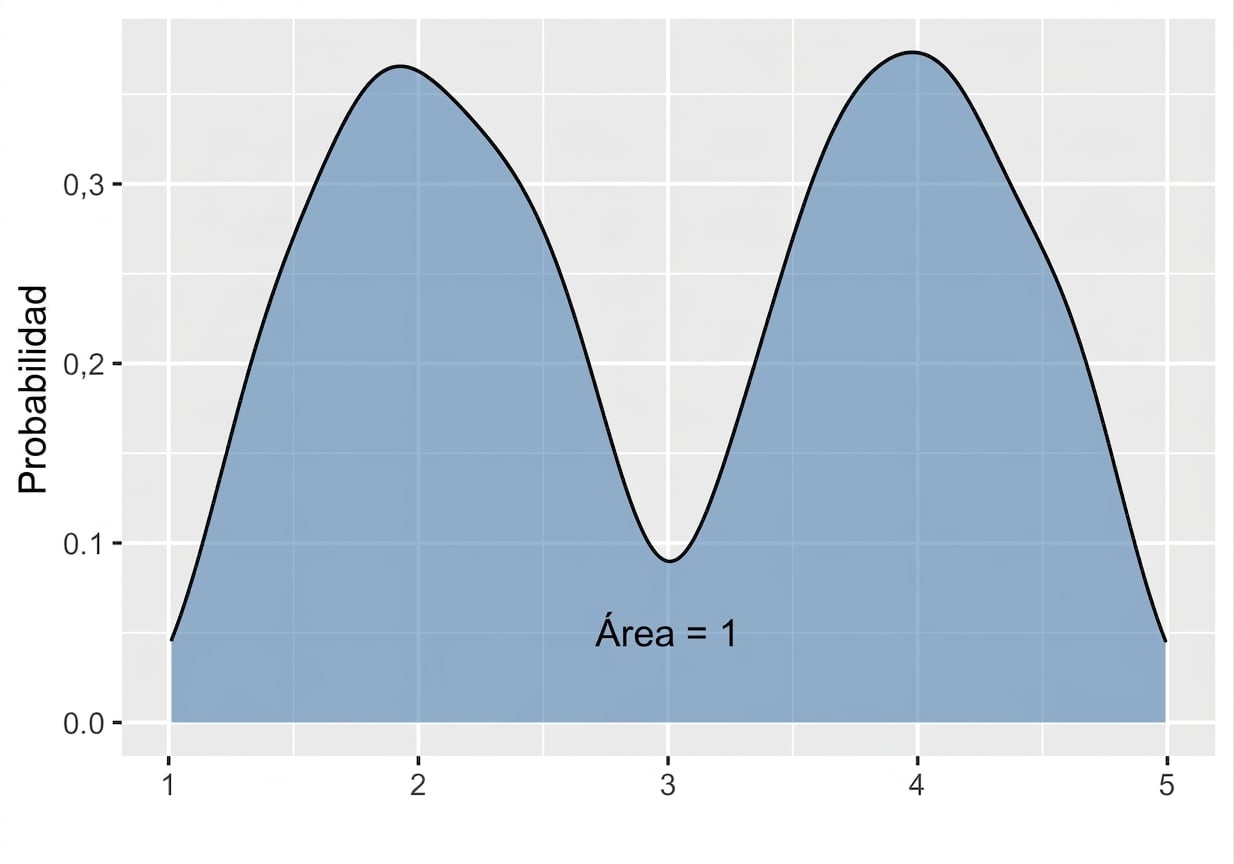
Distribución bimodal
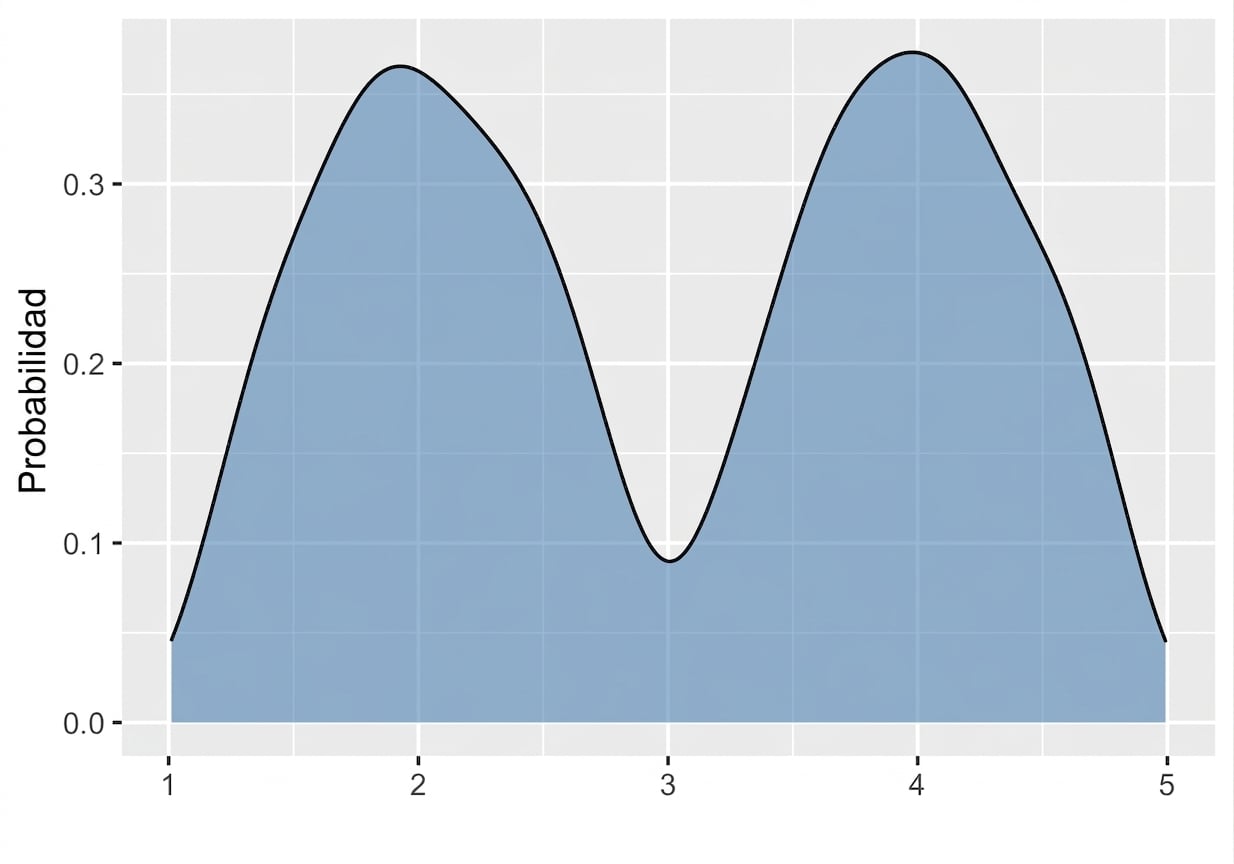
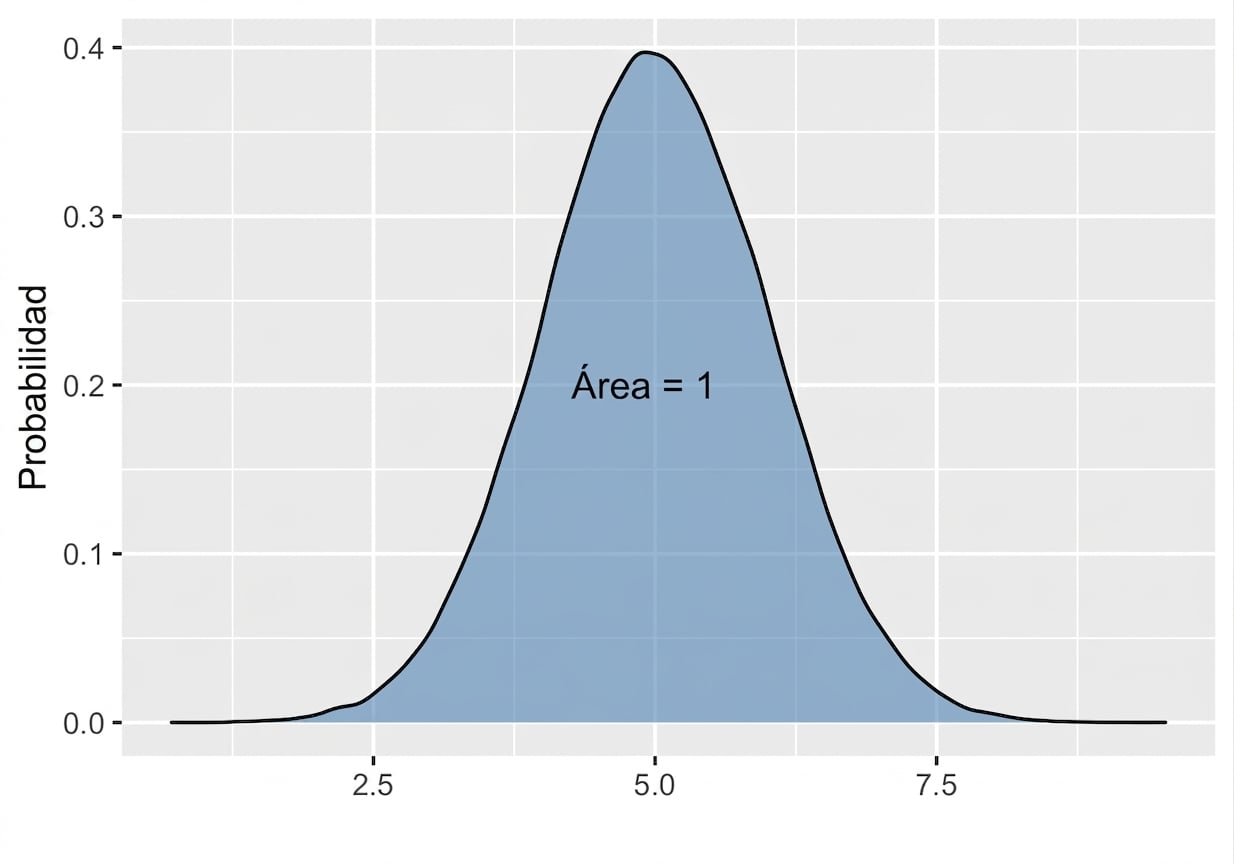
La distribución normal
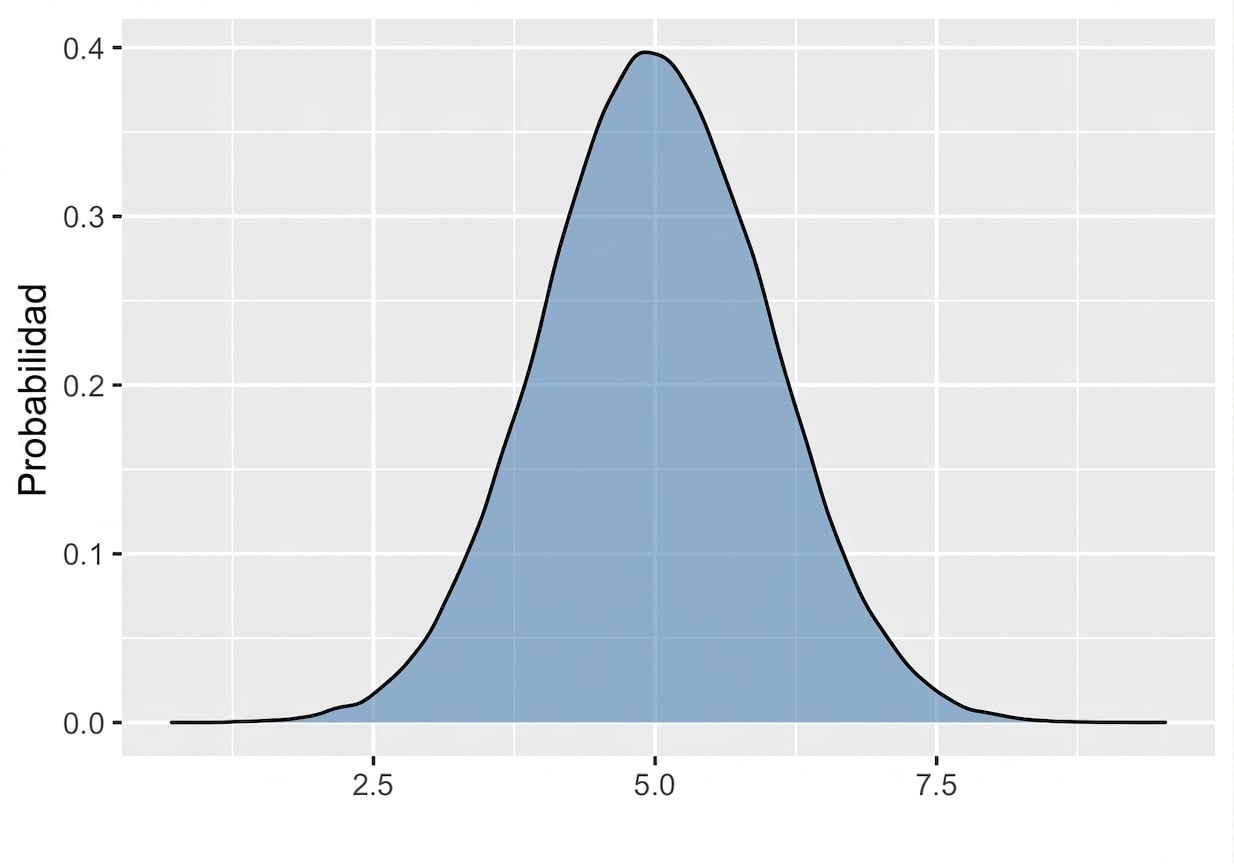
El área total sigue siendo = 1