Interpretar los resultados de las pruebas de hipótesis
Introducción a la estadística

George Boorman
Curriculum Manager, DataCamp
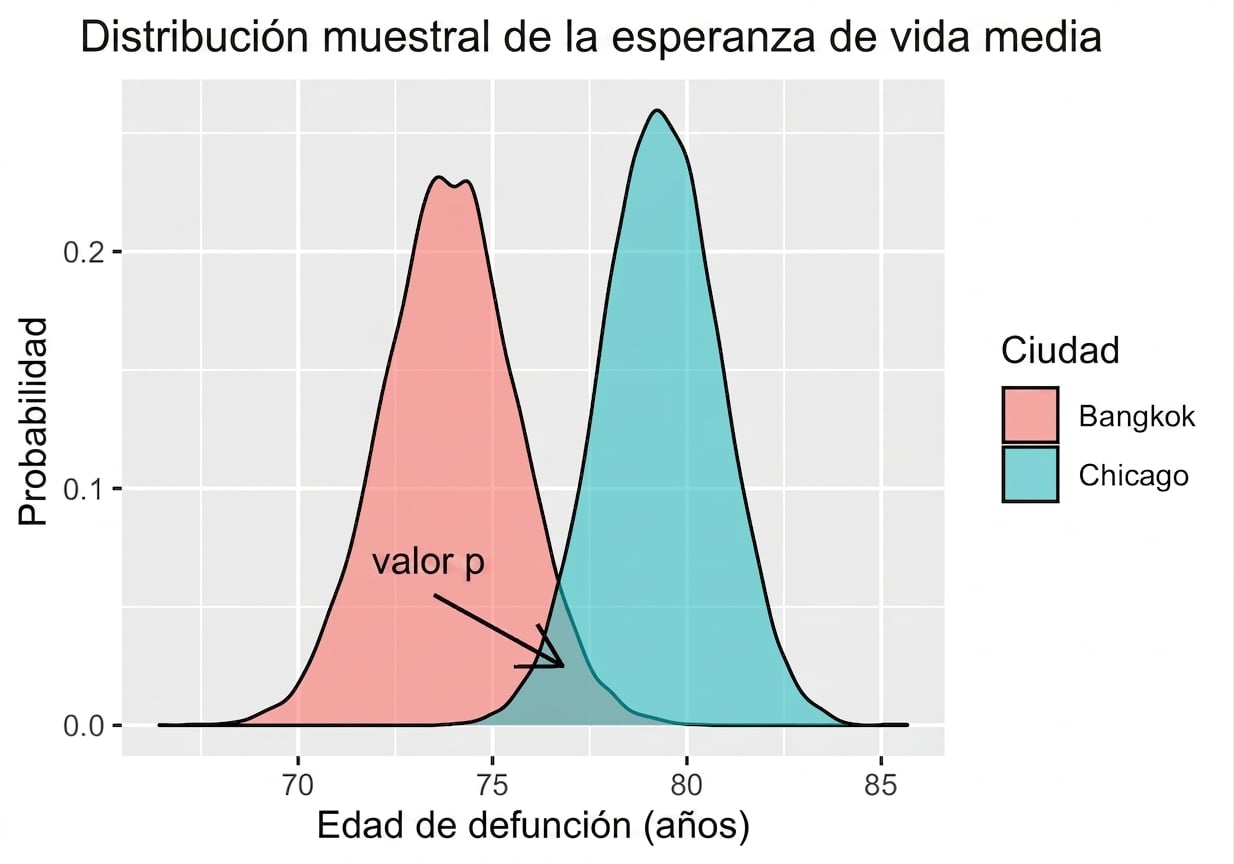
Esperanza de vida en Chicago frente a Bangkok
Chicago

Bangkok

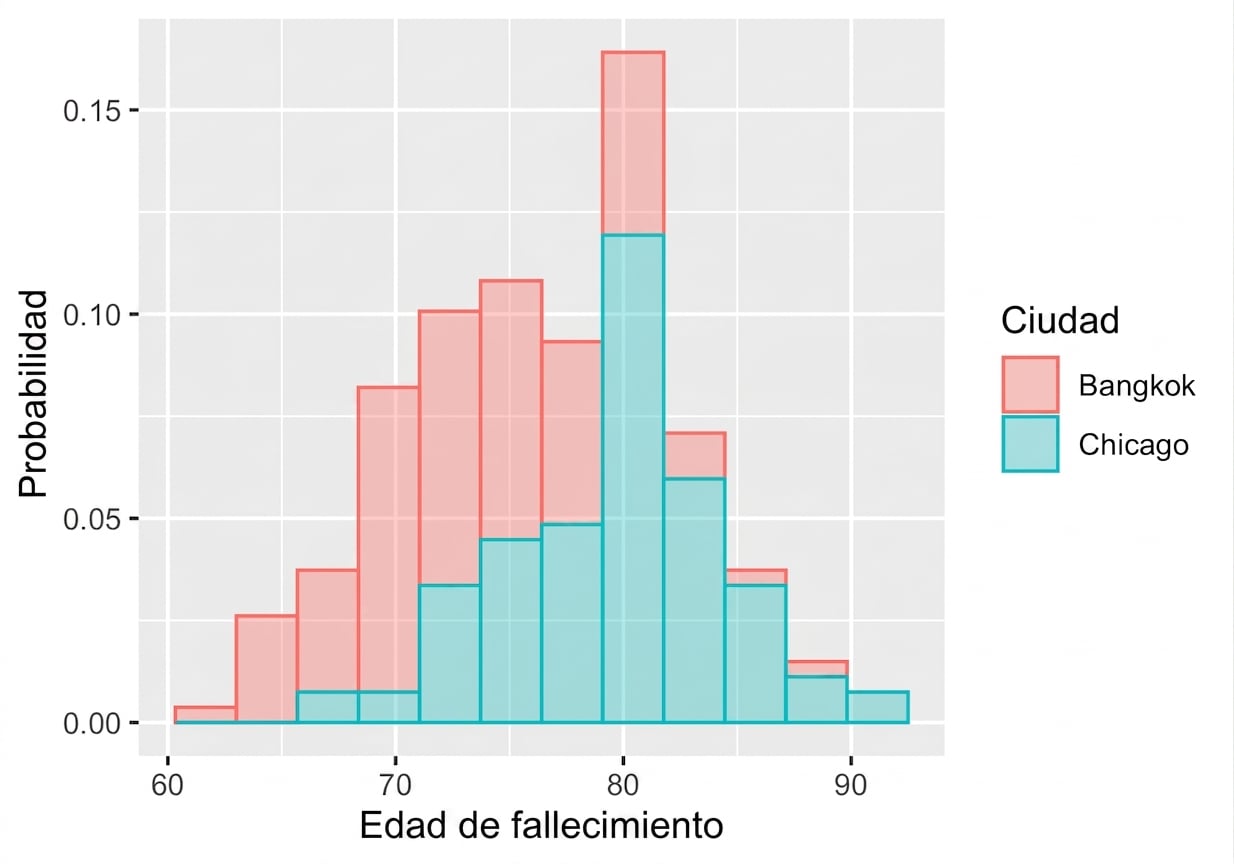
Distribuciones muestrales
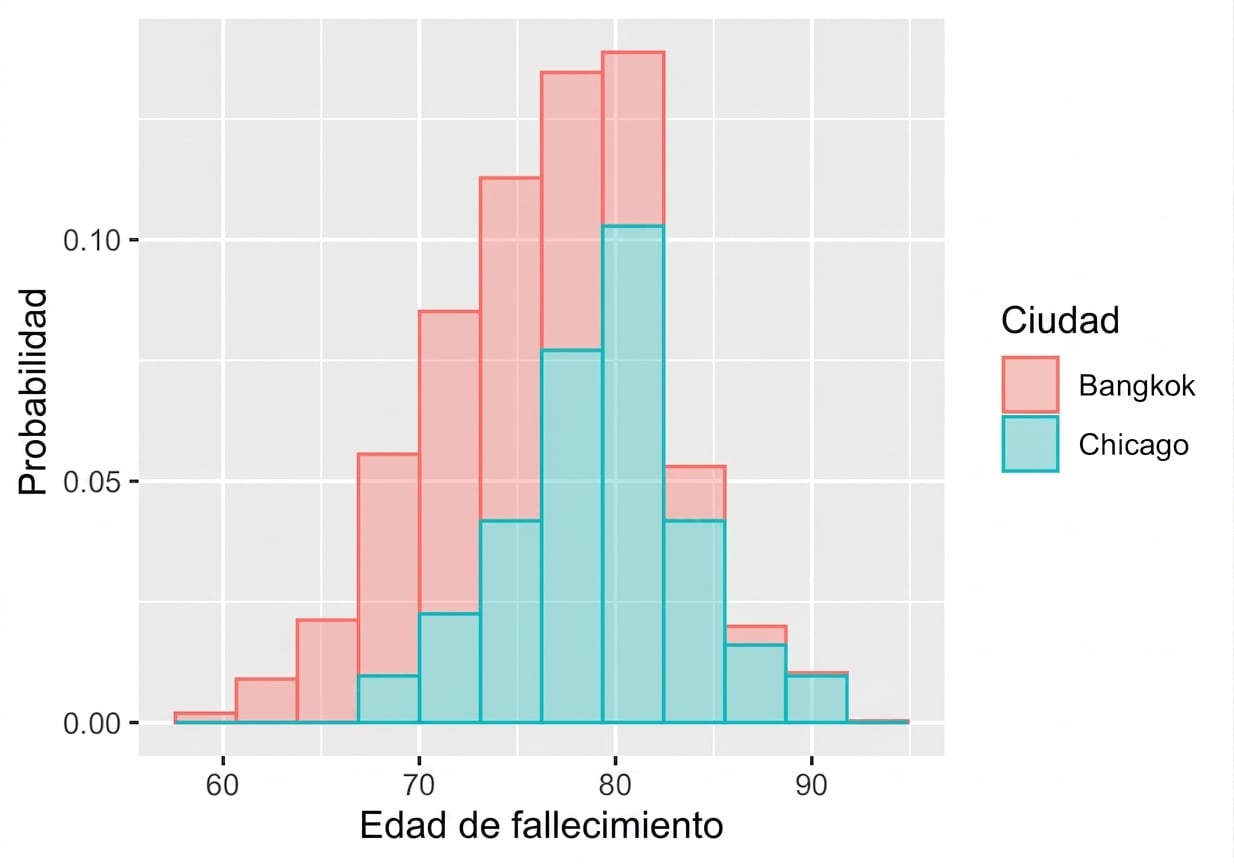
Diferentes muestras
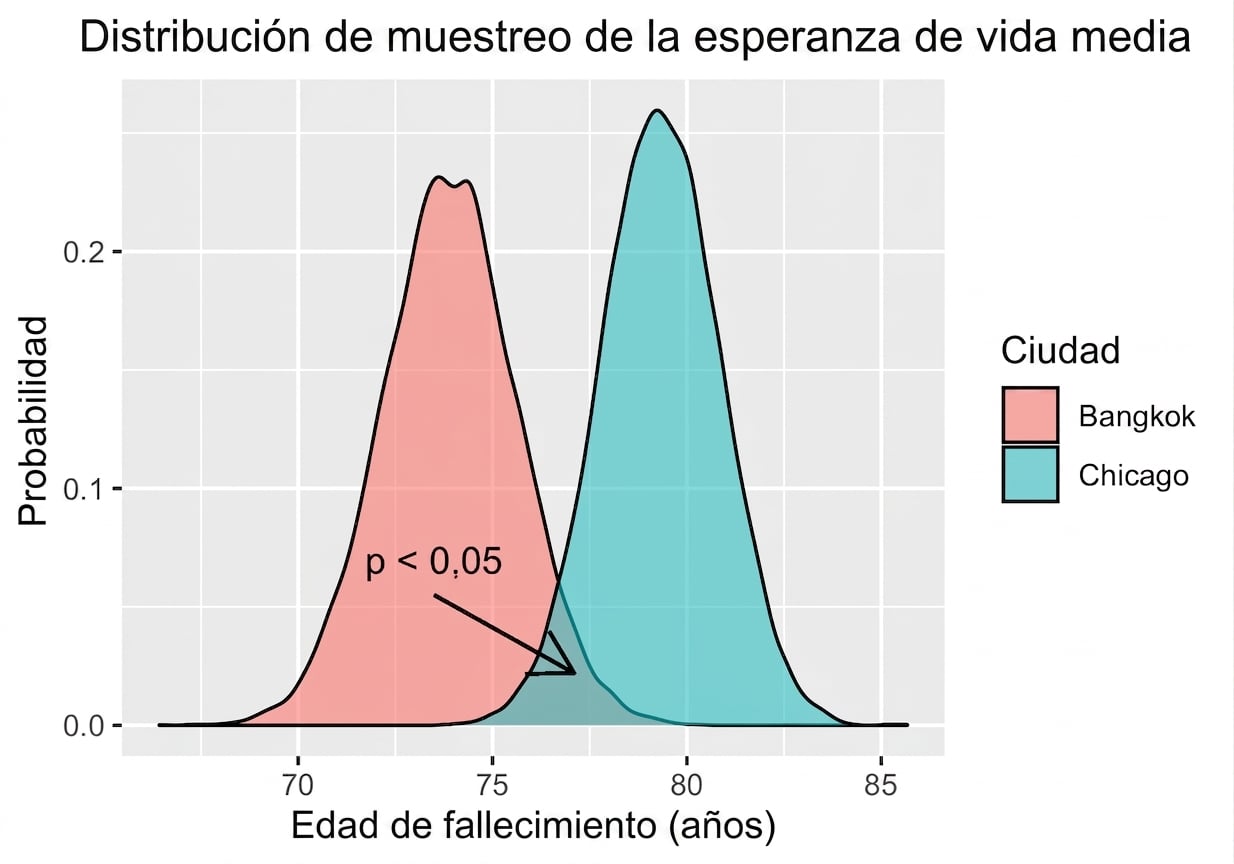
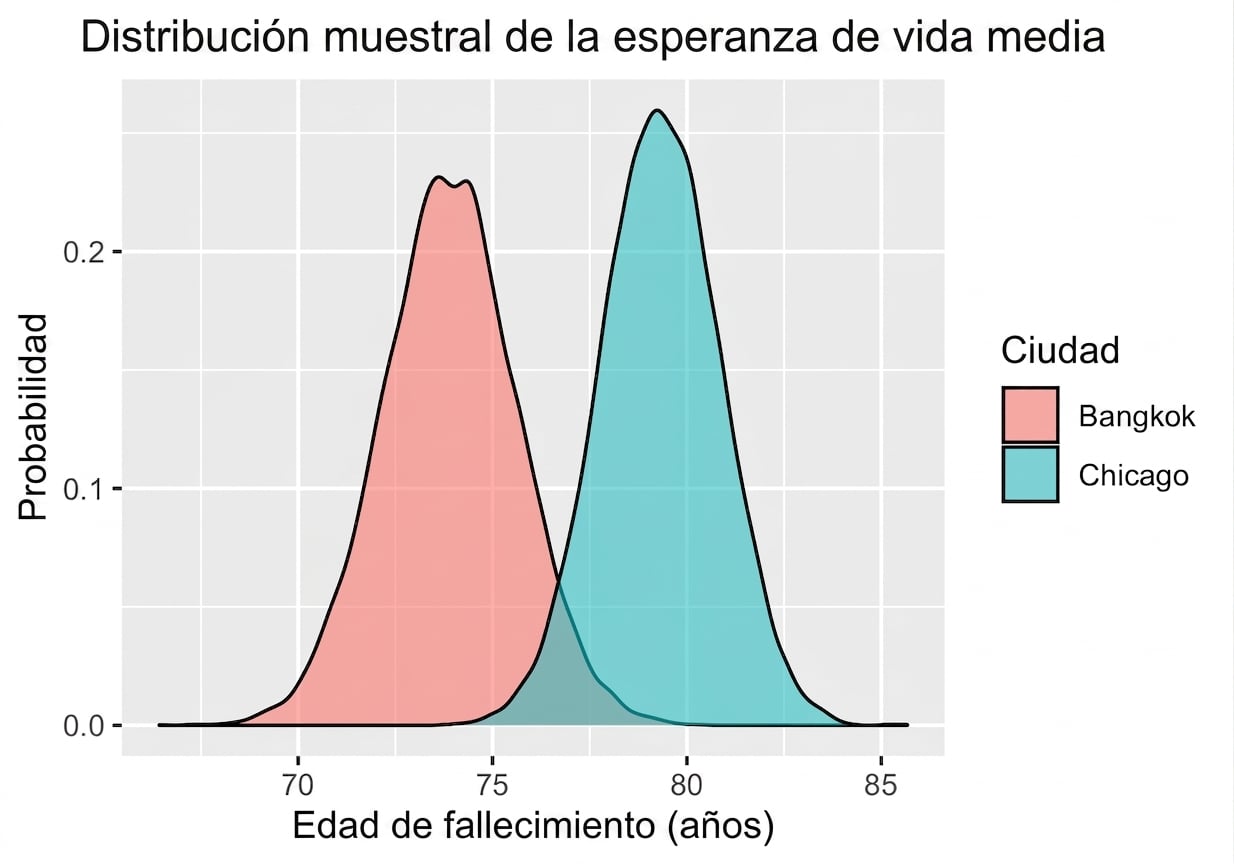
Distribución muestral de la esperanza de vida media
Valor p
- $p$
- Probabilidad de obtener este resultado, suponiendo que la hipótesis nula es cierta.
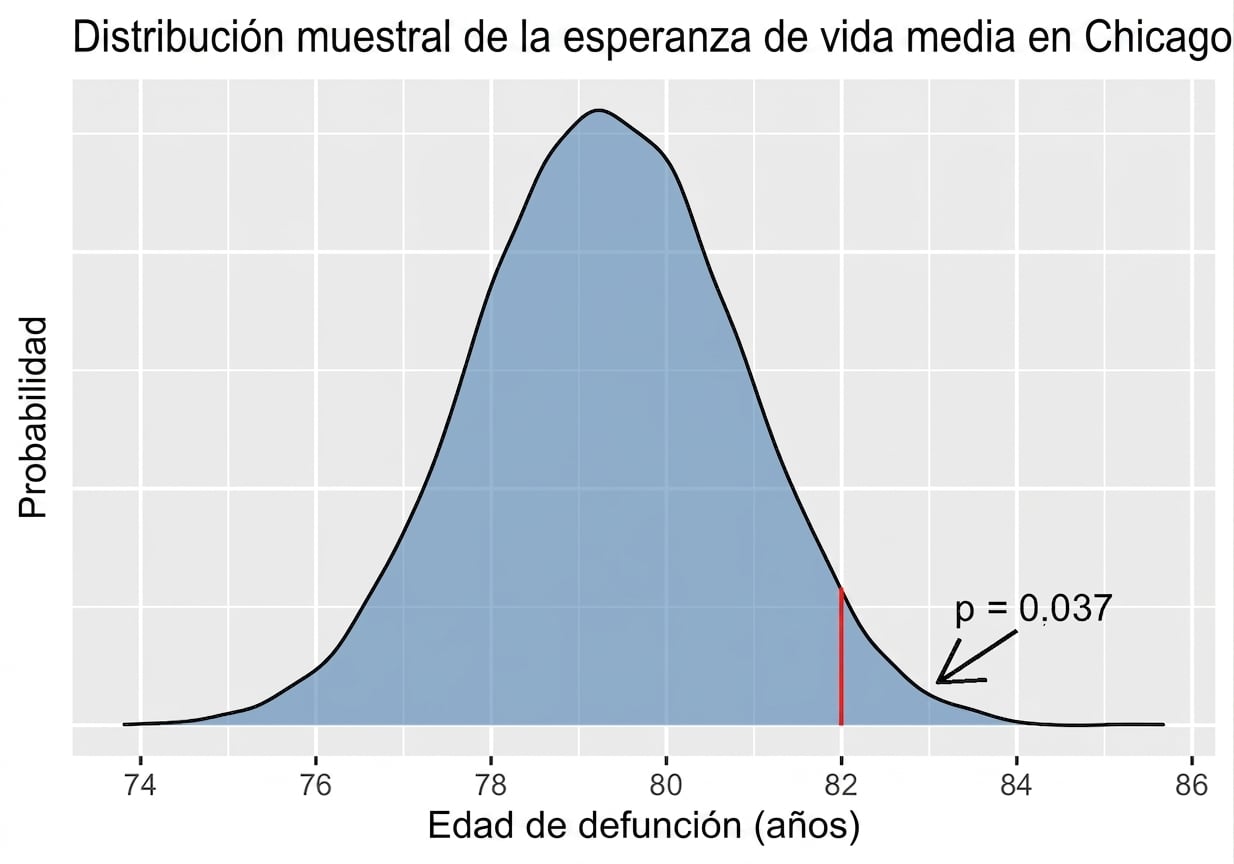
Valor p
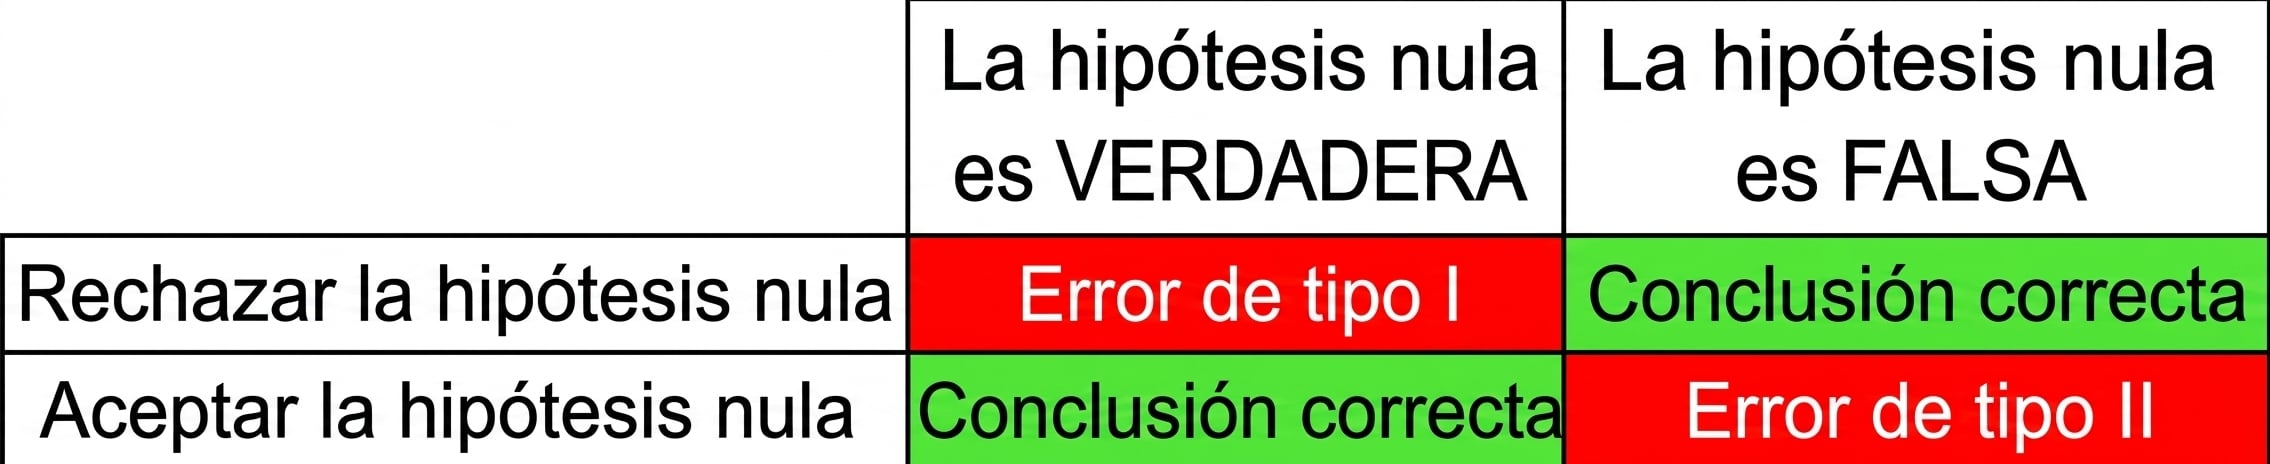
Error de tipo I/II
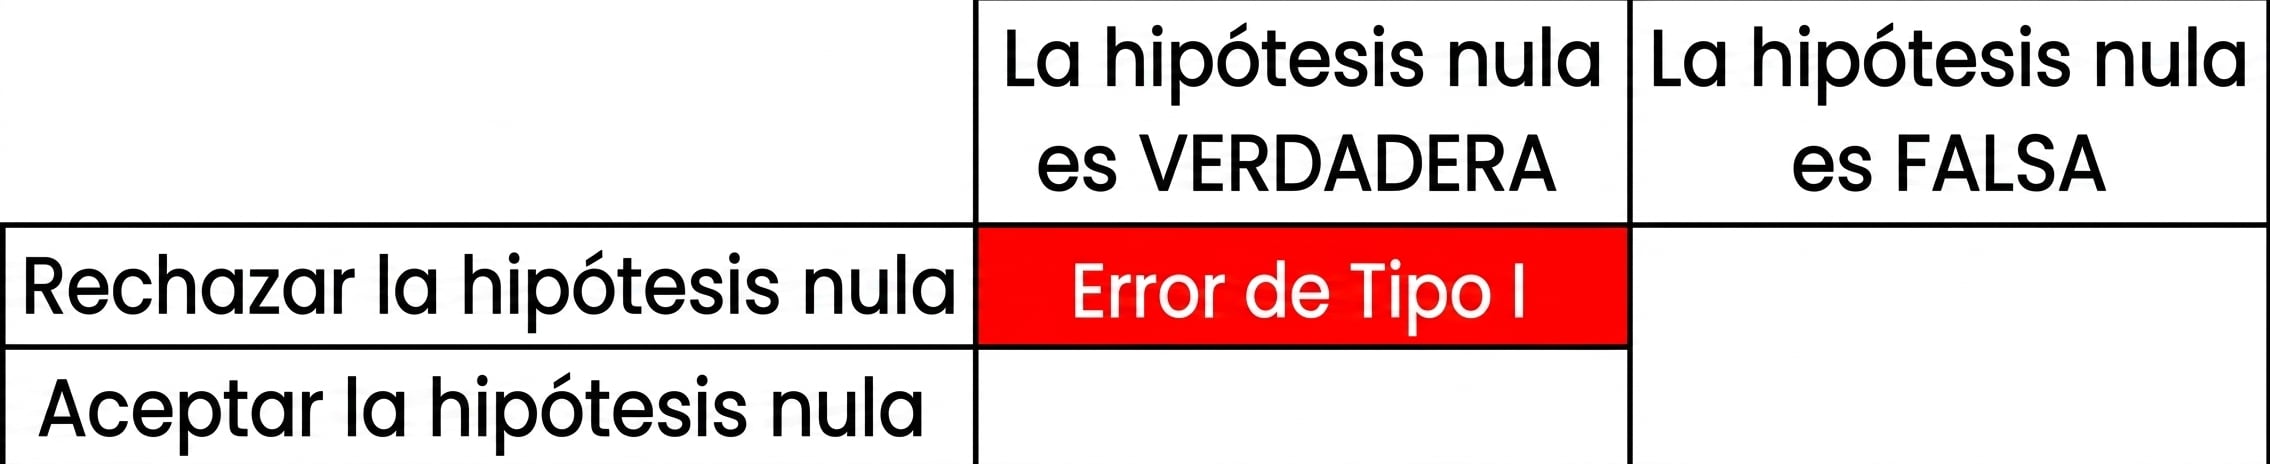
Error de tipo I/II

Error de tipo I/II
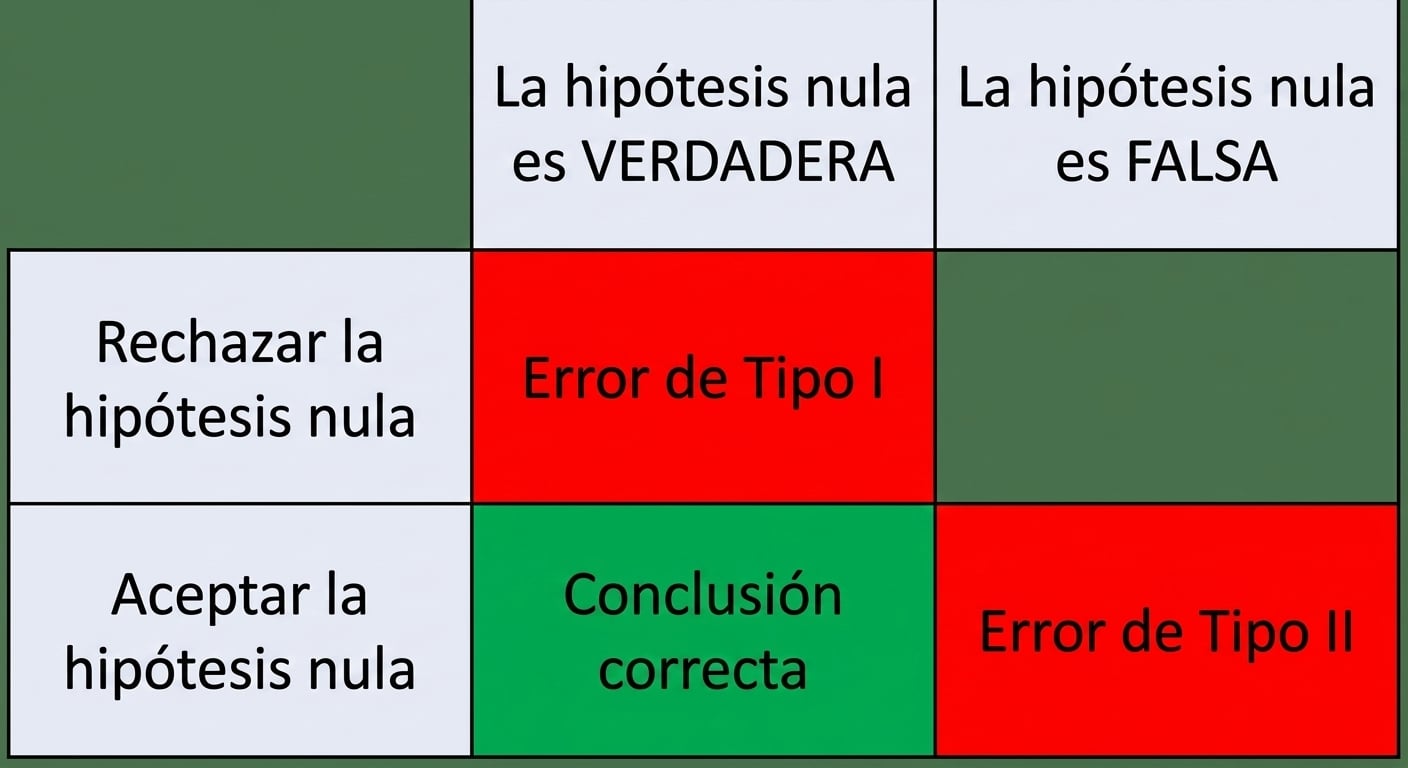
Error de tipo I/II
Sacar una conclusión