¿Qué es la estadística?
Introducción a la estadística

George Boorman
Curriculum Manager, DataCamp
¡Estadísticas por doquier!


1 Créditos de las imágenes: https://unsplash.com/@jesusance; https://unsplash.com/@andretaissin; https://unsplash.com/@unarchive
Limitaciones de las estadísticas

1 Crédito de la imagen: https://unsplash.com/@mohammadmetri
Visualización de datos numéricos
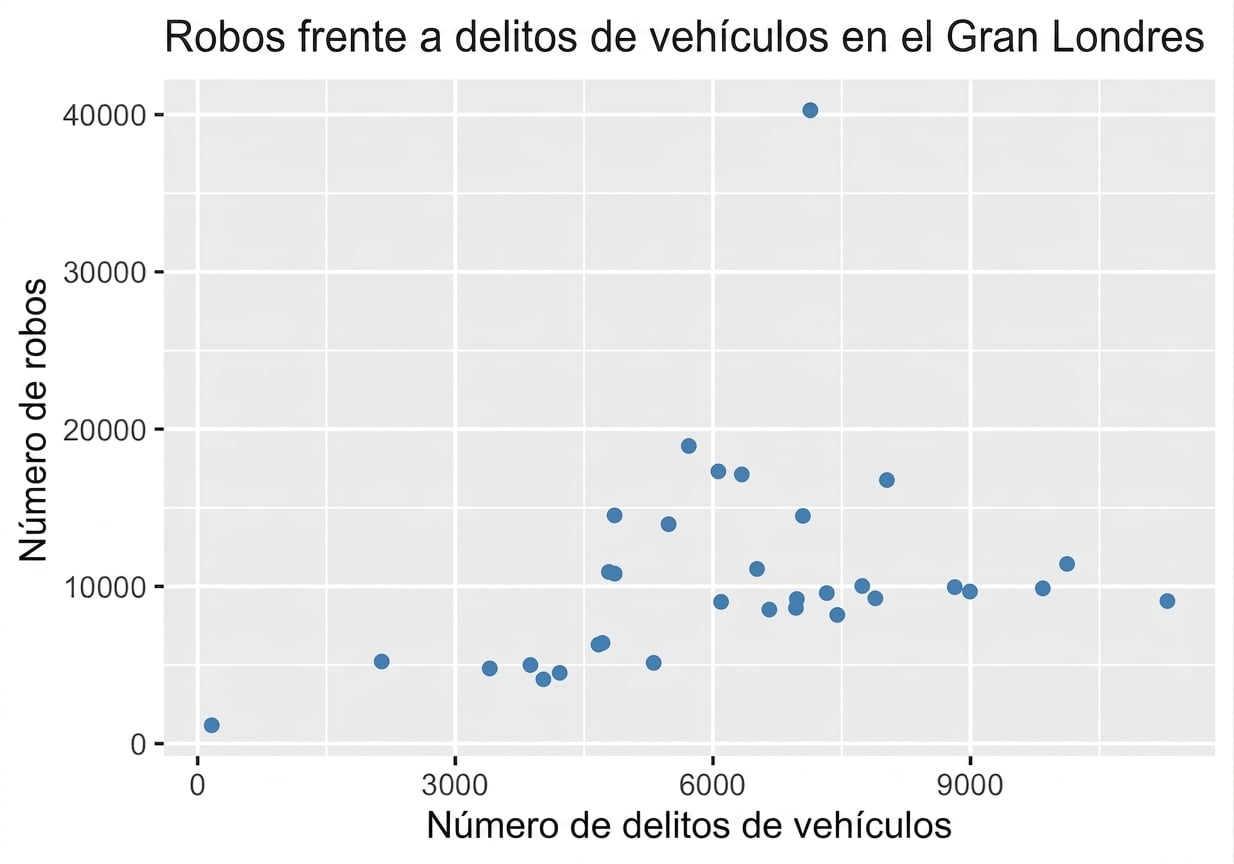
1 Fuente de datos: Servicio de Policía Metropolitana, Reino Unido
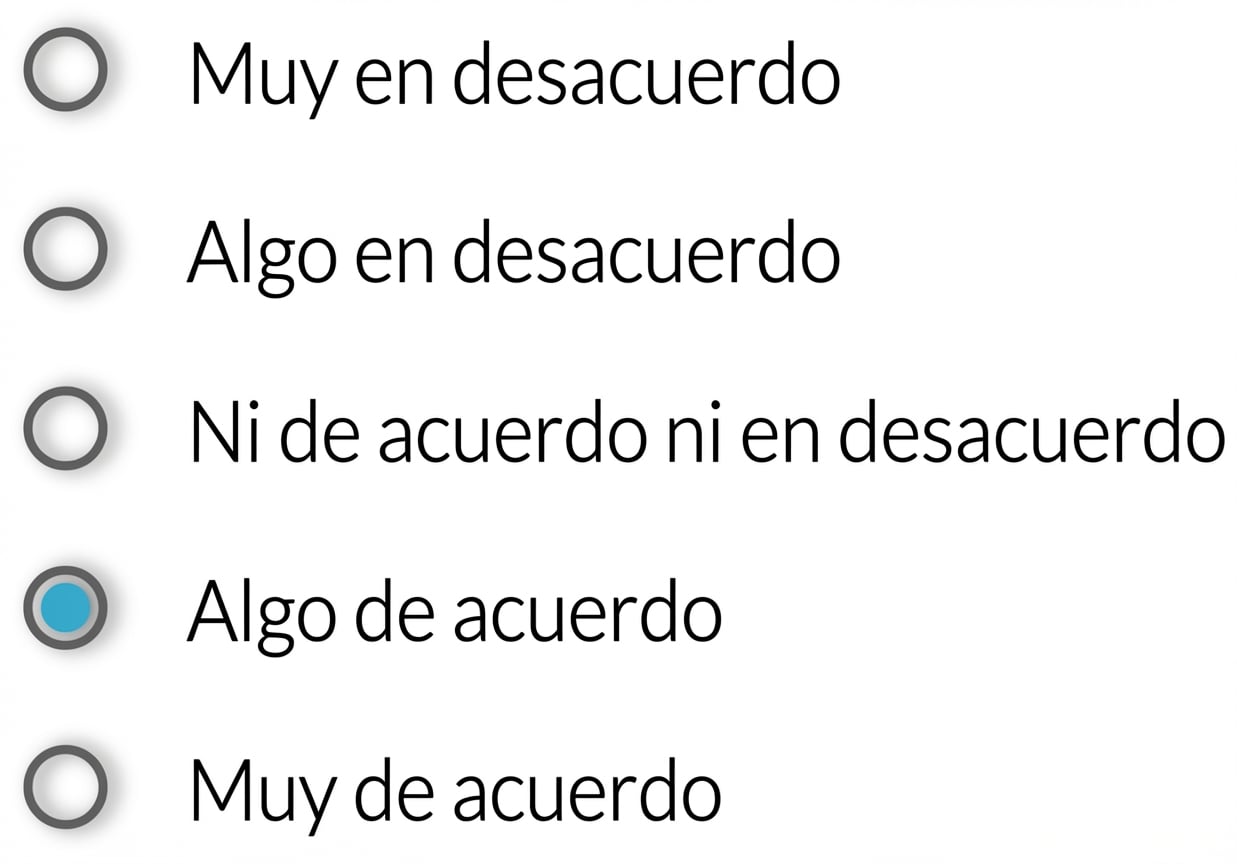
Tipos de datos: categóricos
- Datos ordinales:
- ¿En qué medida estás de acuerdo con que el baloncesto es el mejor deporte?
1 Crédito de la imagen: https://unsplash.com/@mango_quan
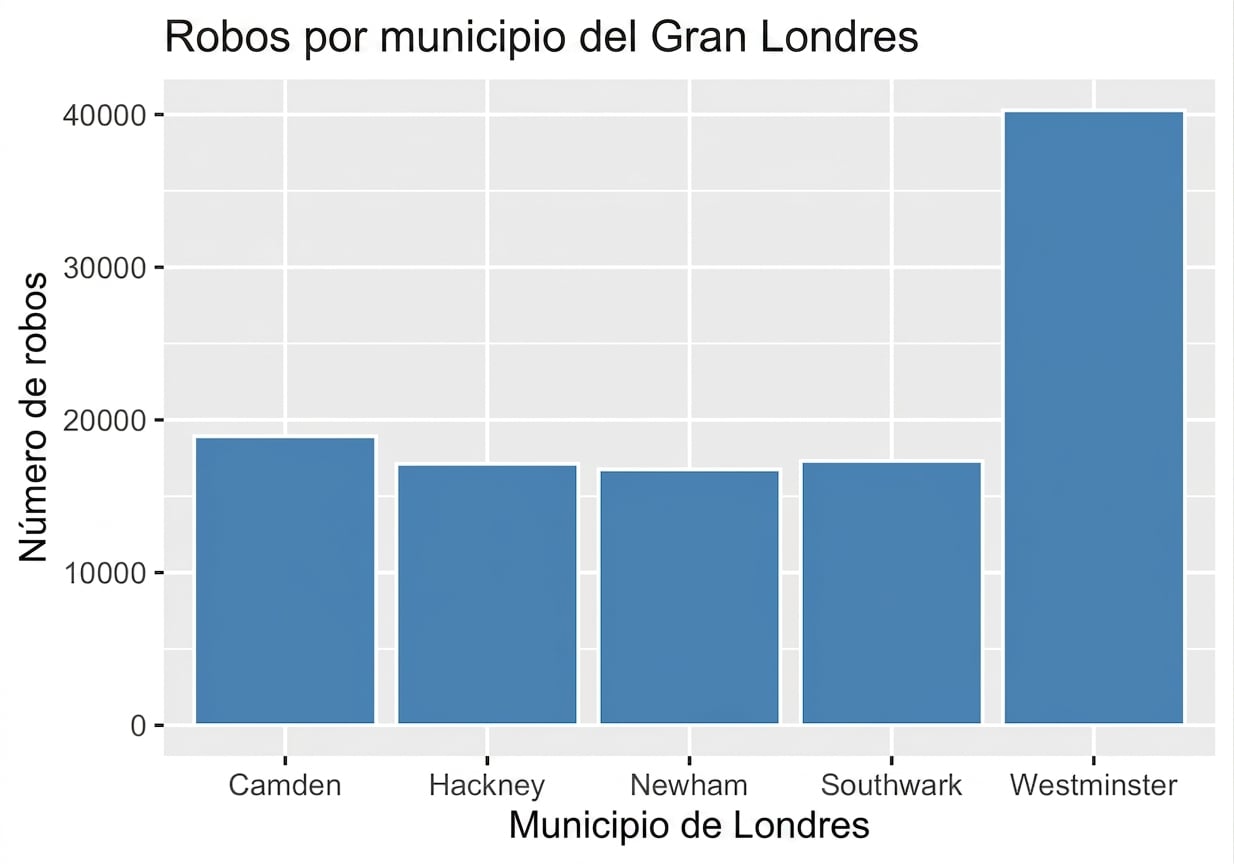
Visualización de datos categóricos
Estadística inferencial
Utiliza una muestra para sacar conclusiones sobre una población.
¿Cuántas personas compran ropa tras ver anuncios en las redes sociales?

1 Fuente: https://unsplash.com/@pickawood

