Modificar la estética
Introducción a la visualización de datos con ggplot2

Rick Scavetta
Founder, Scavetta Academy
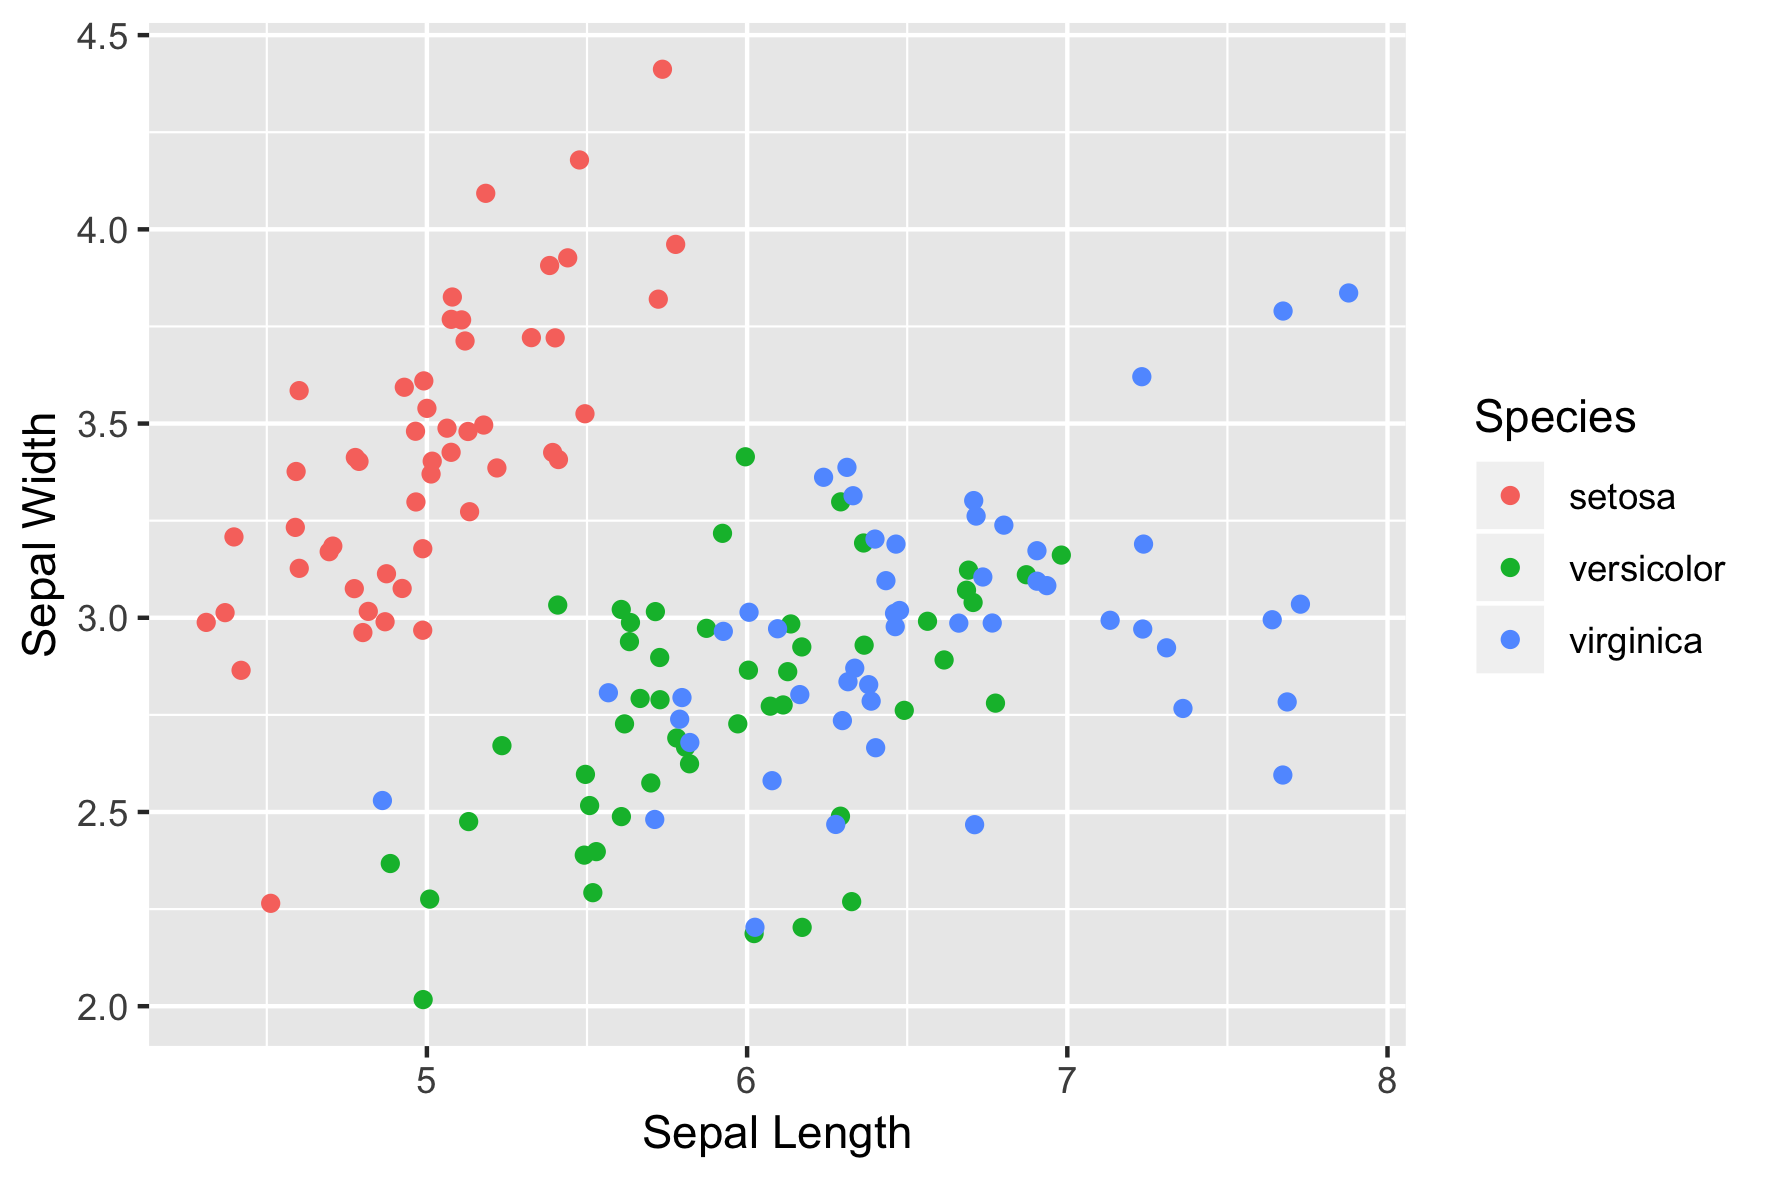
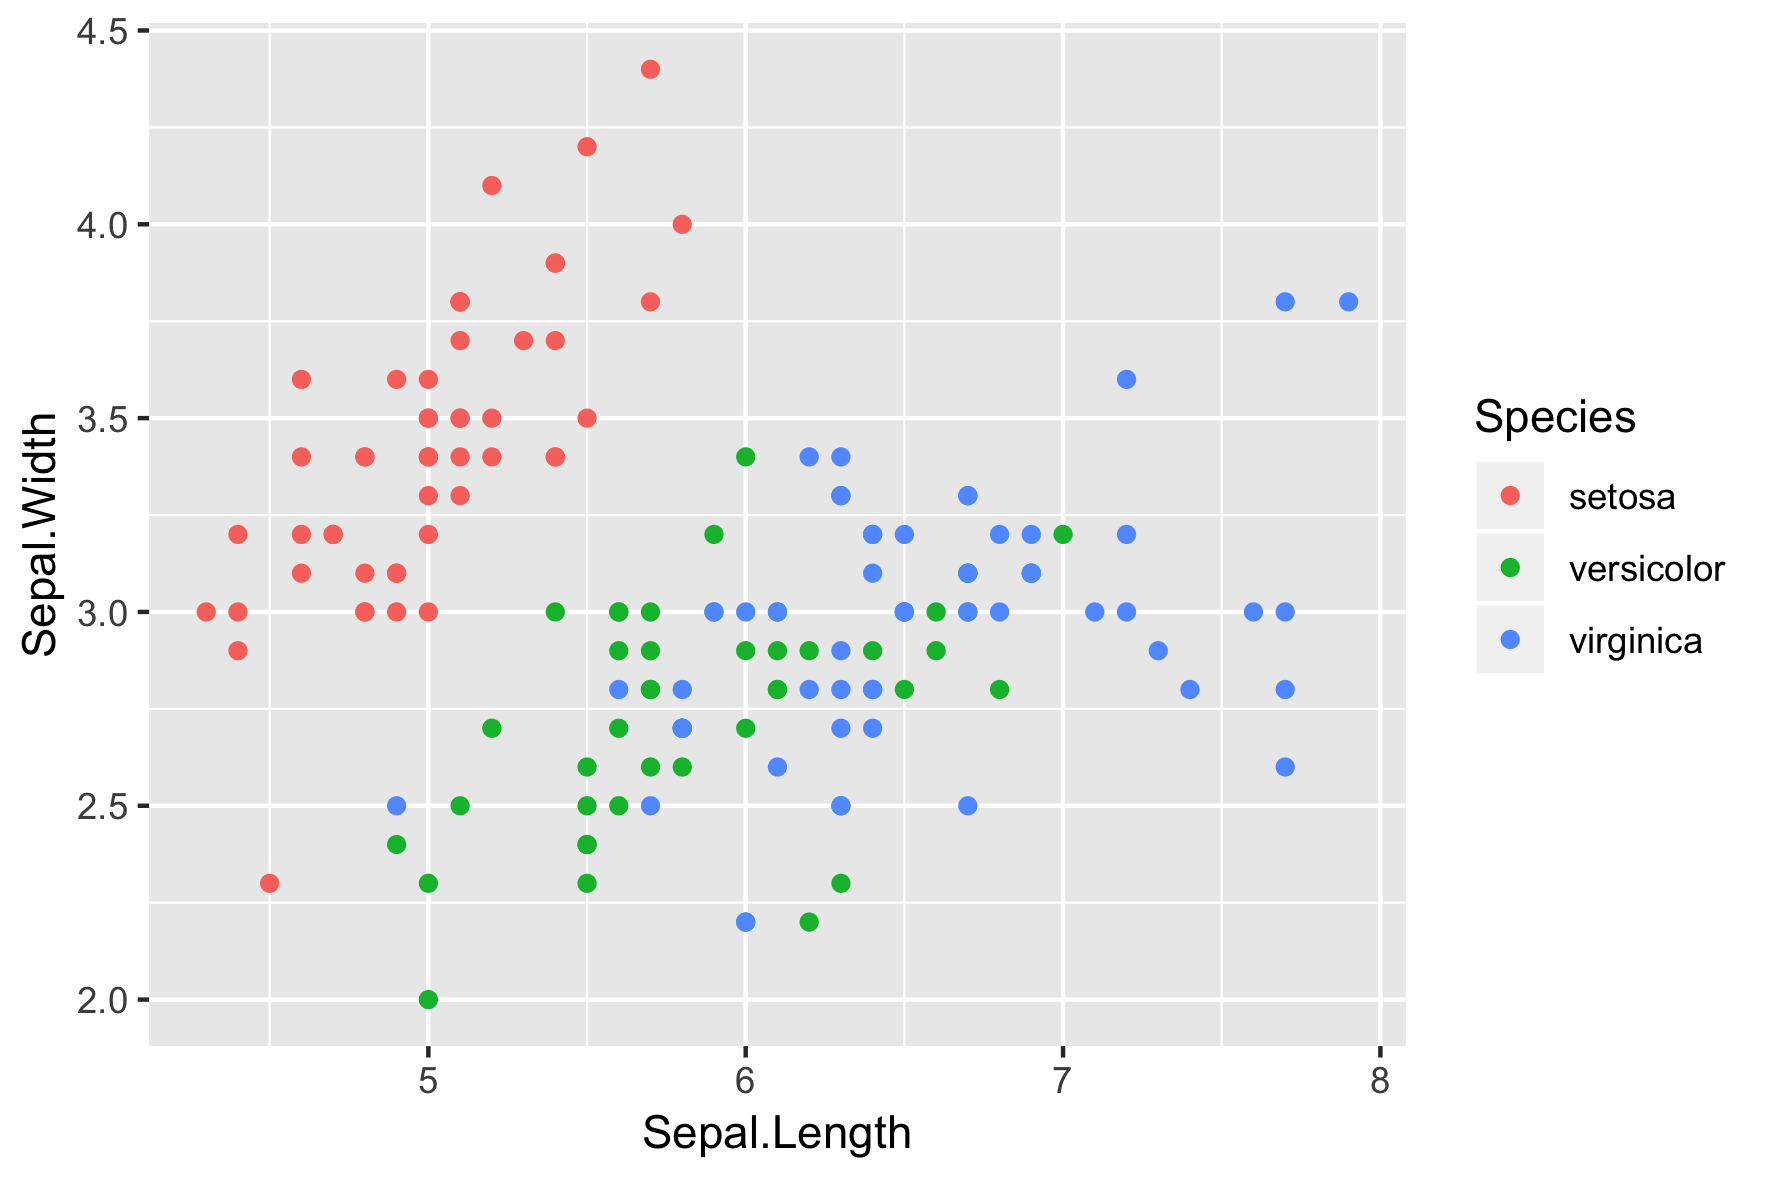
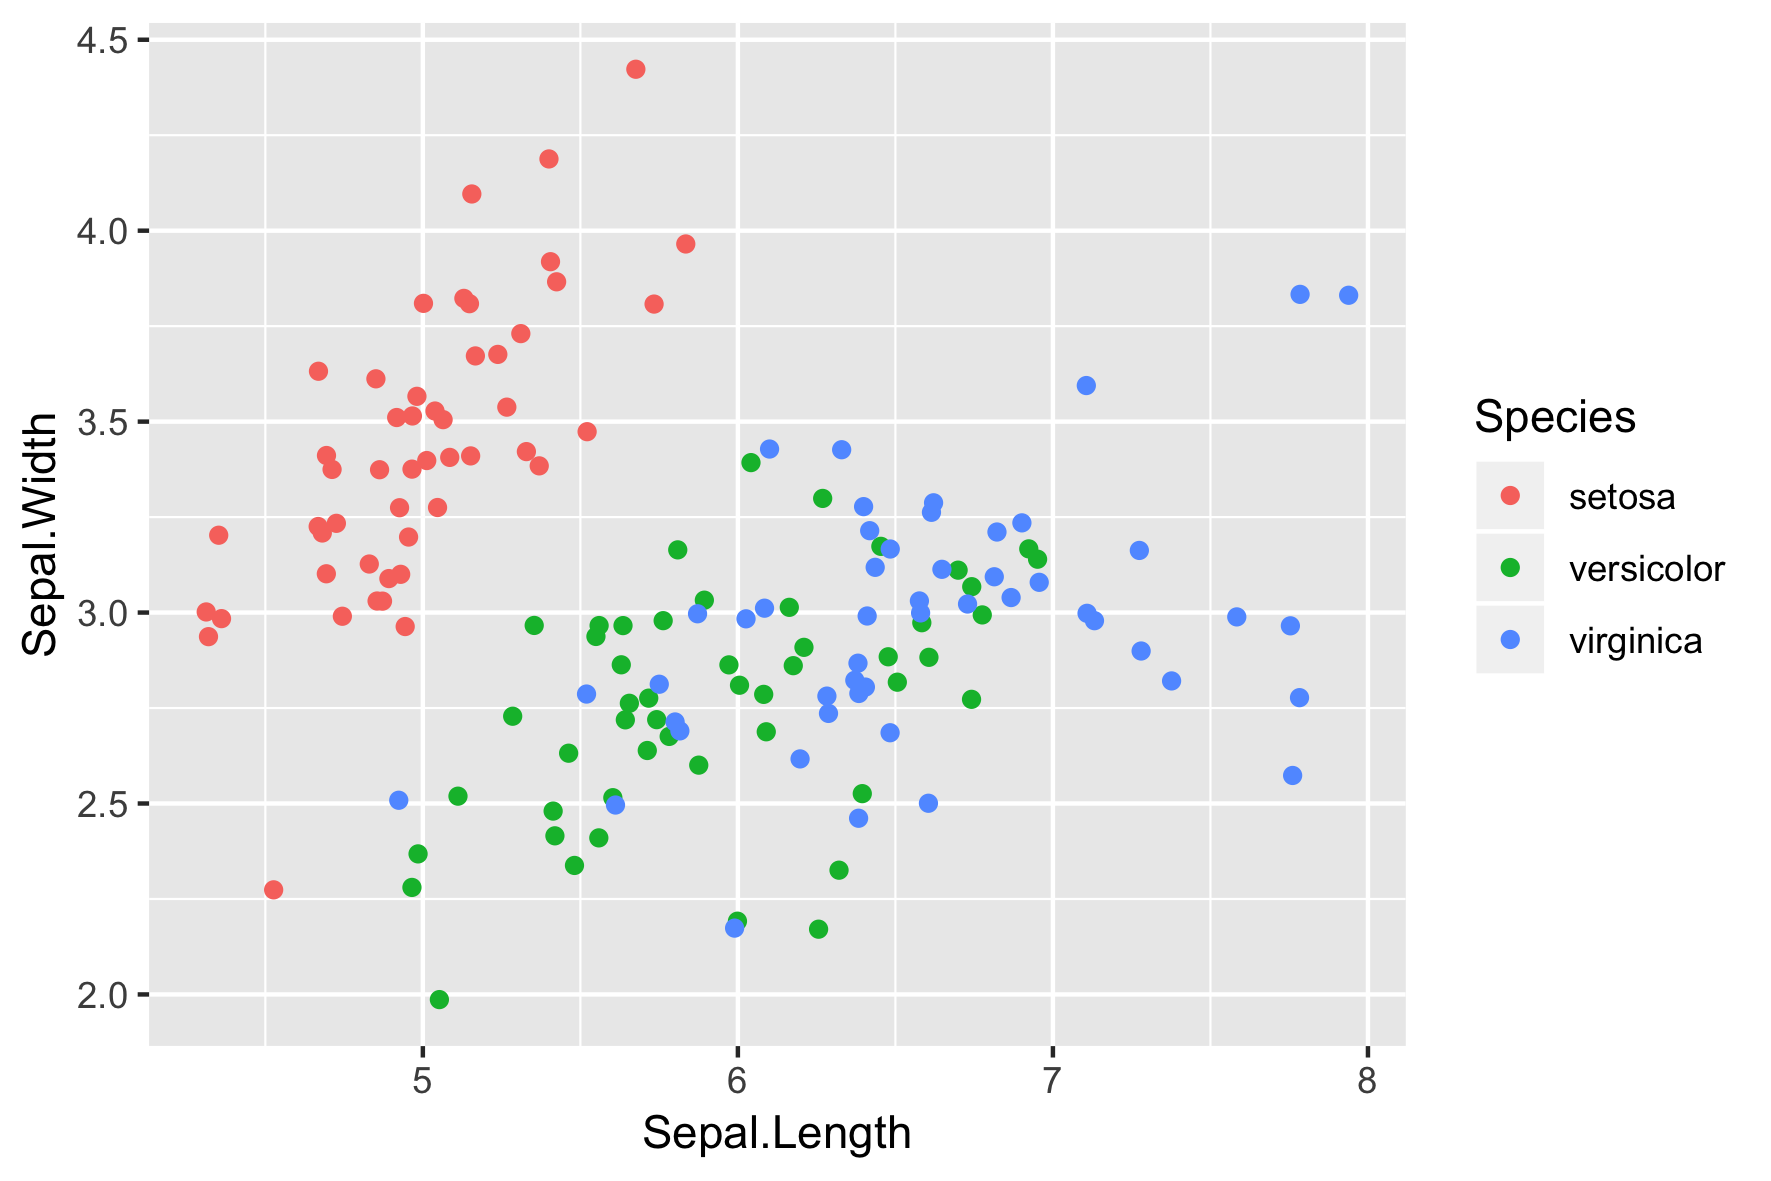
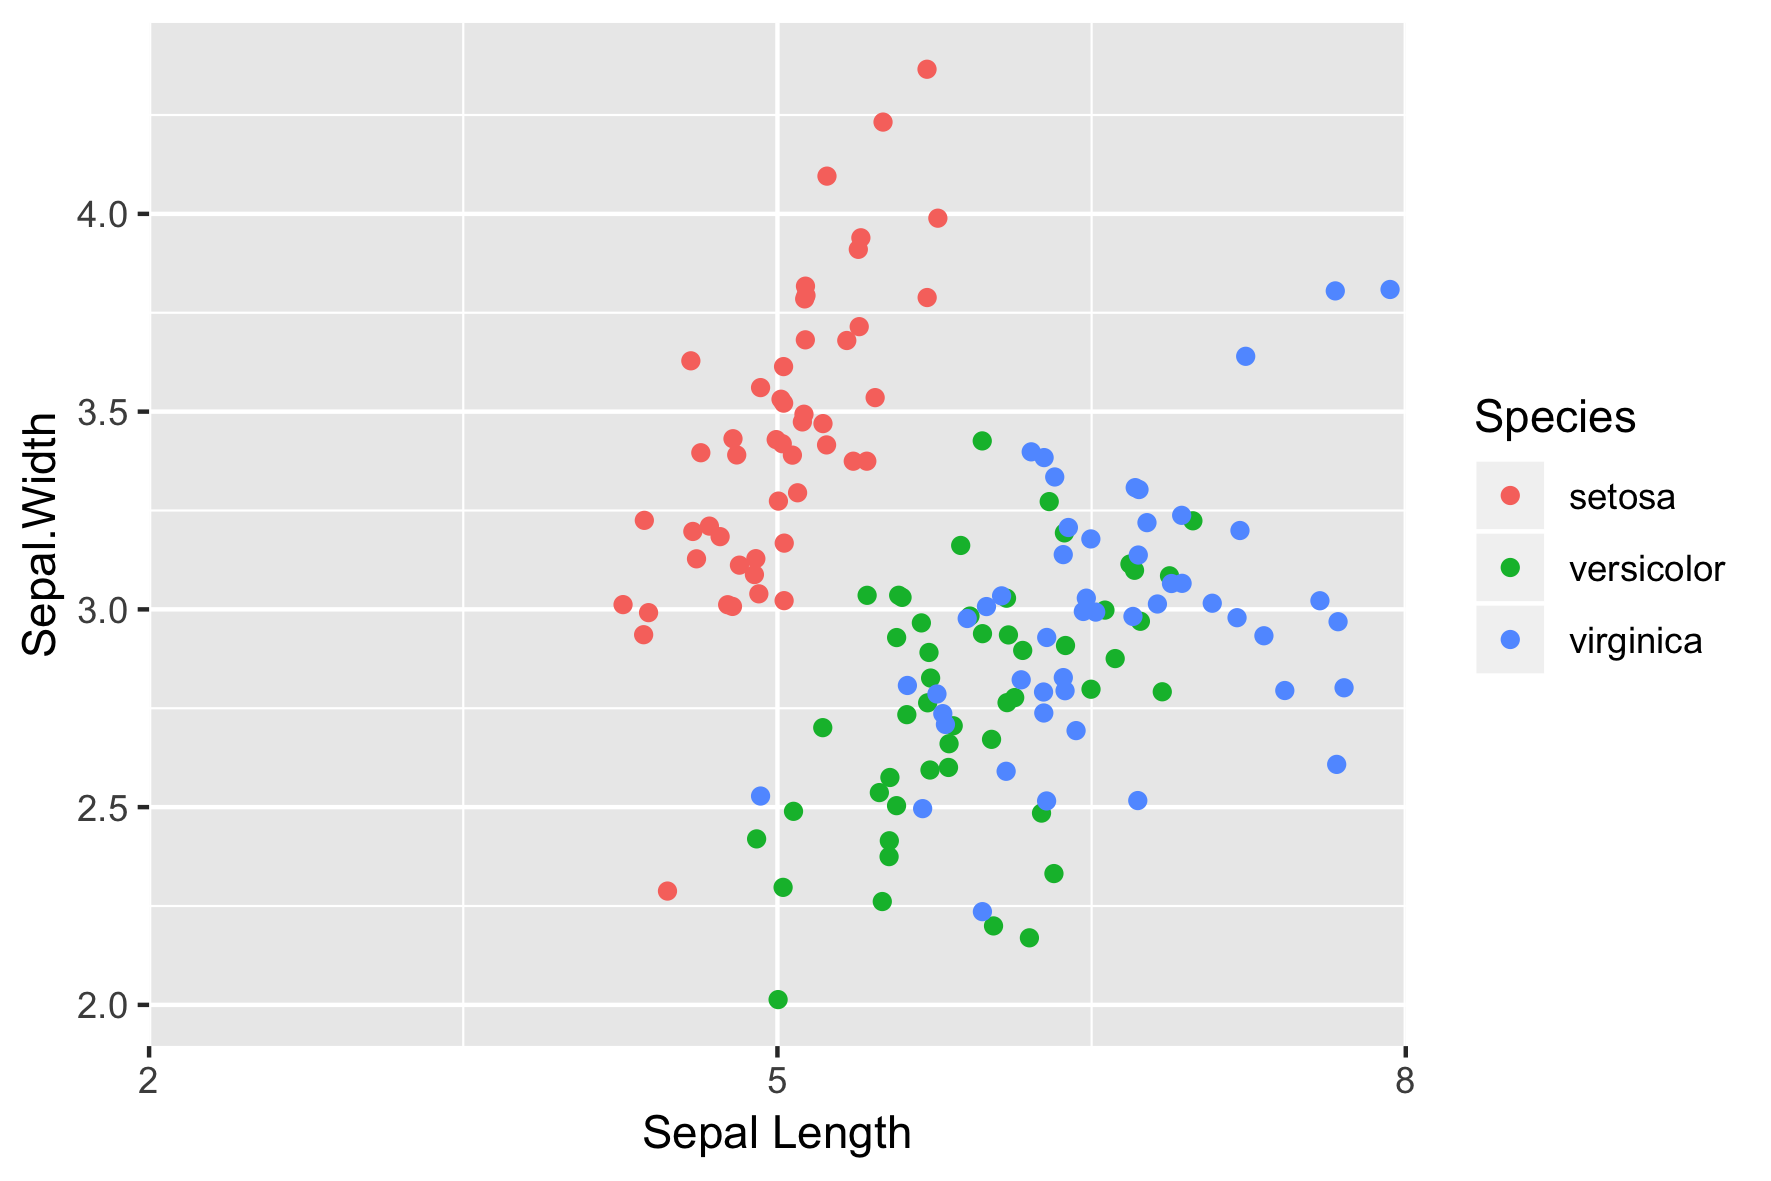
position = "identity" (por defecto)

position = "identity" (por defecto)
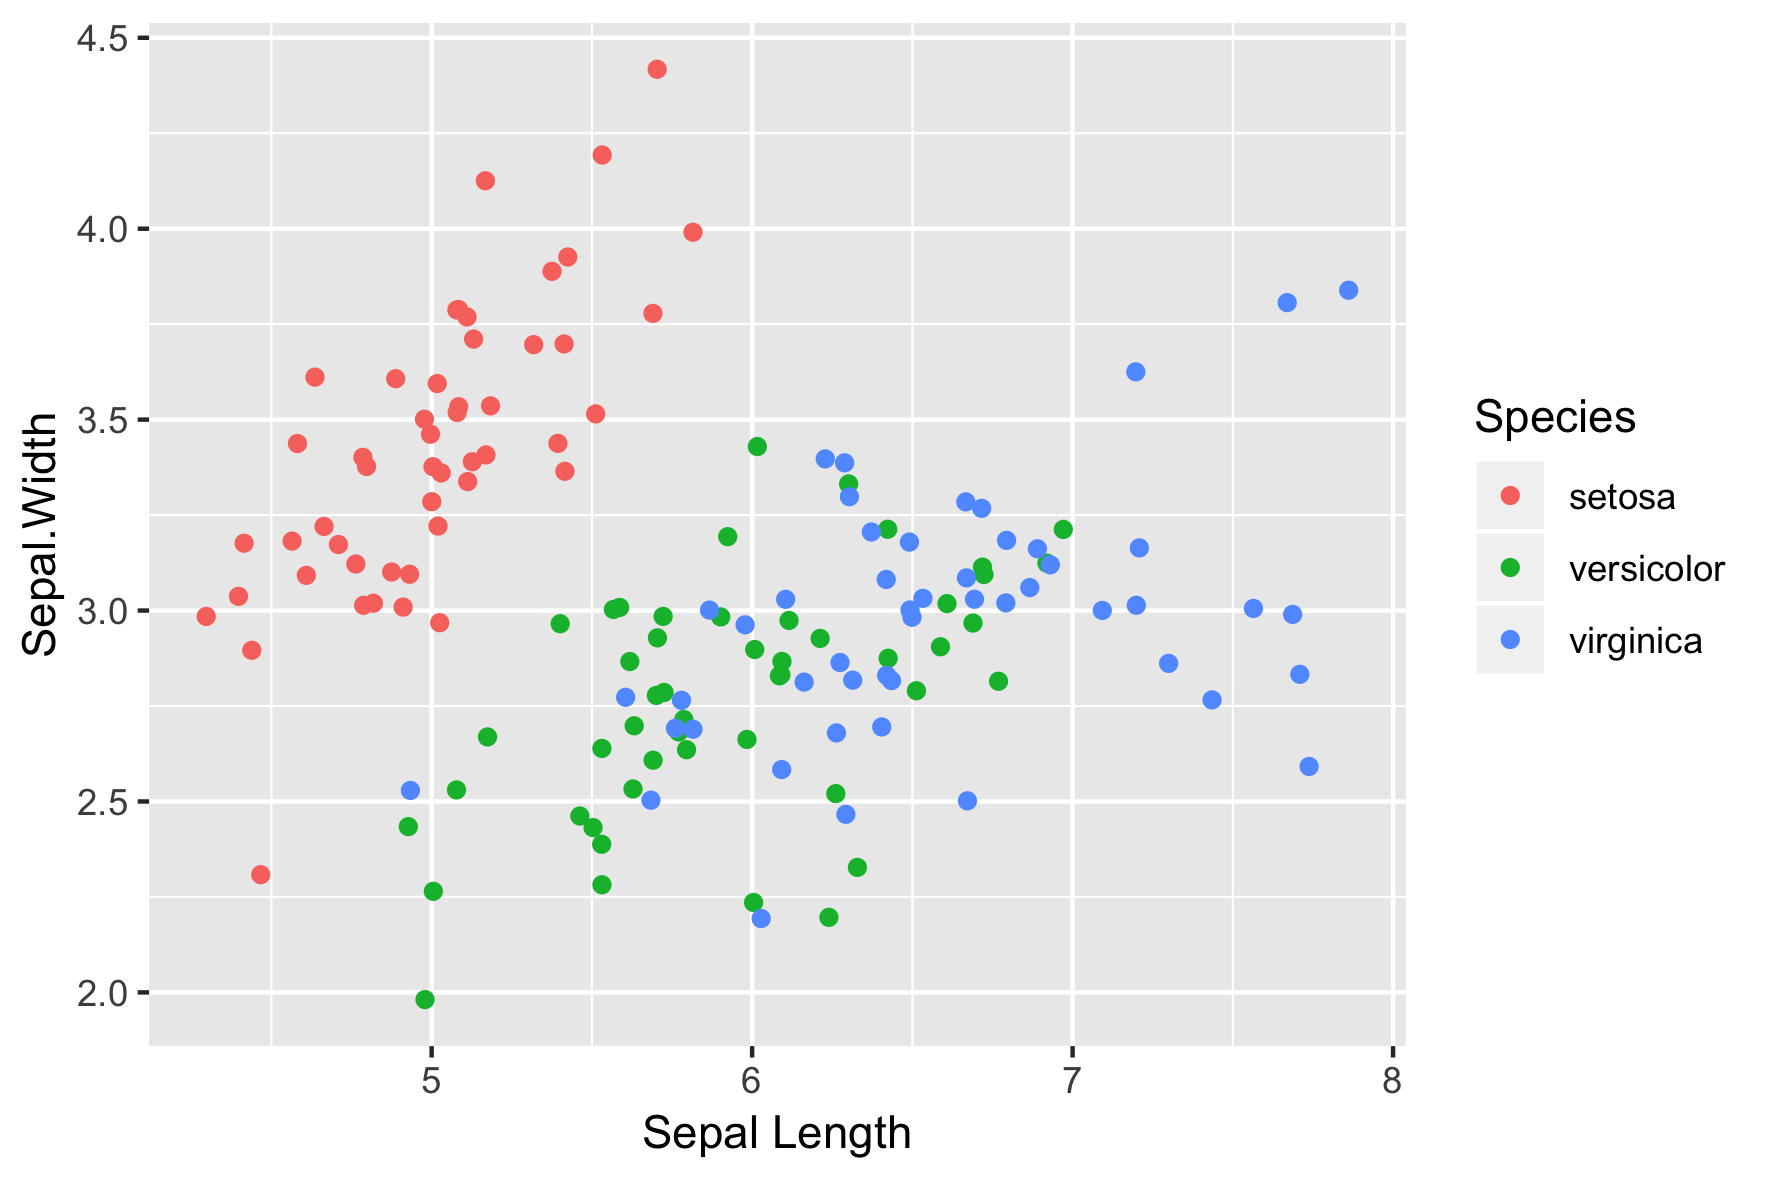
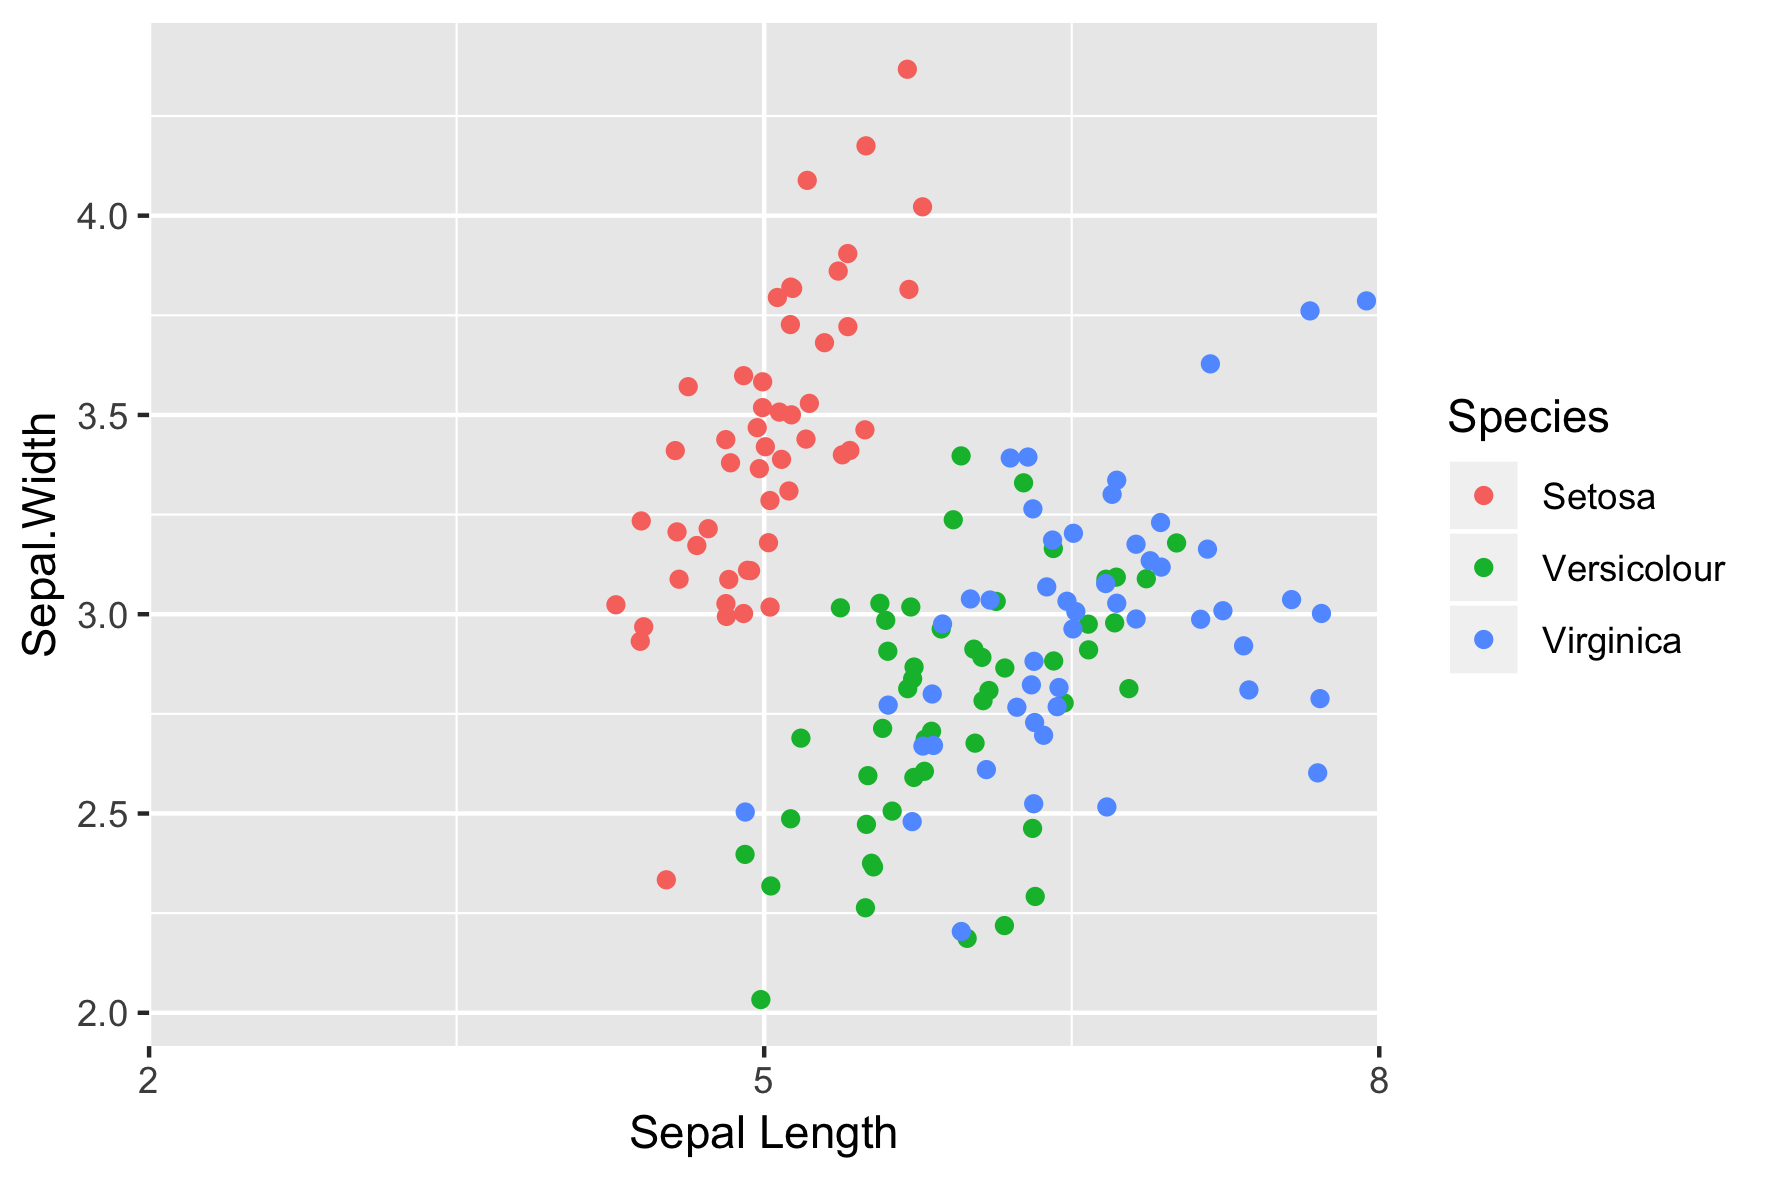
position = "jitter"
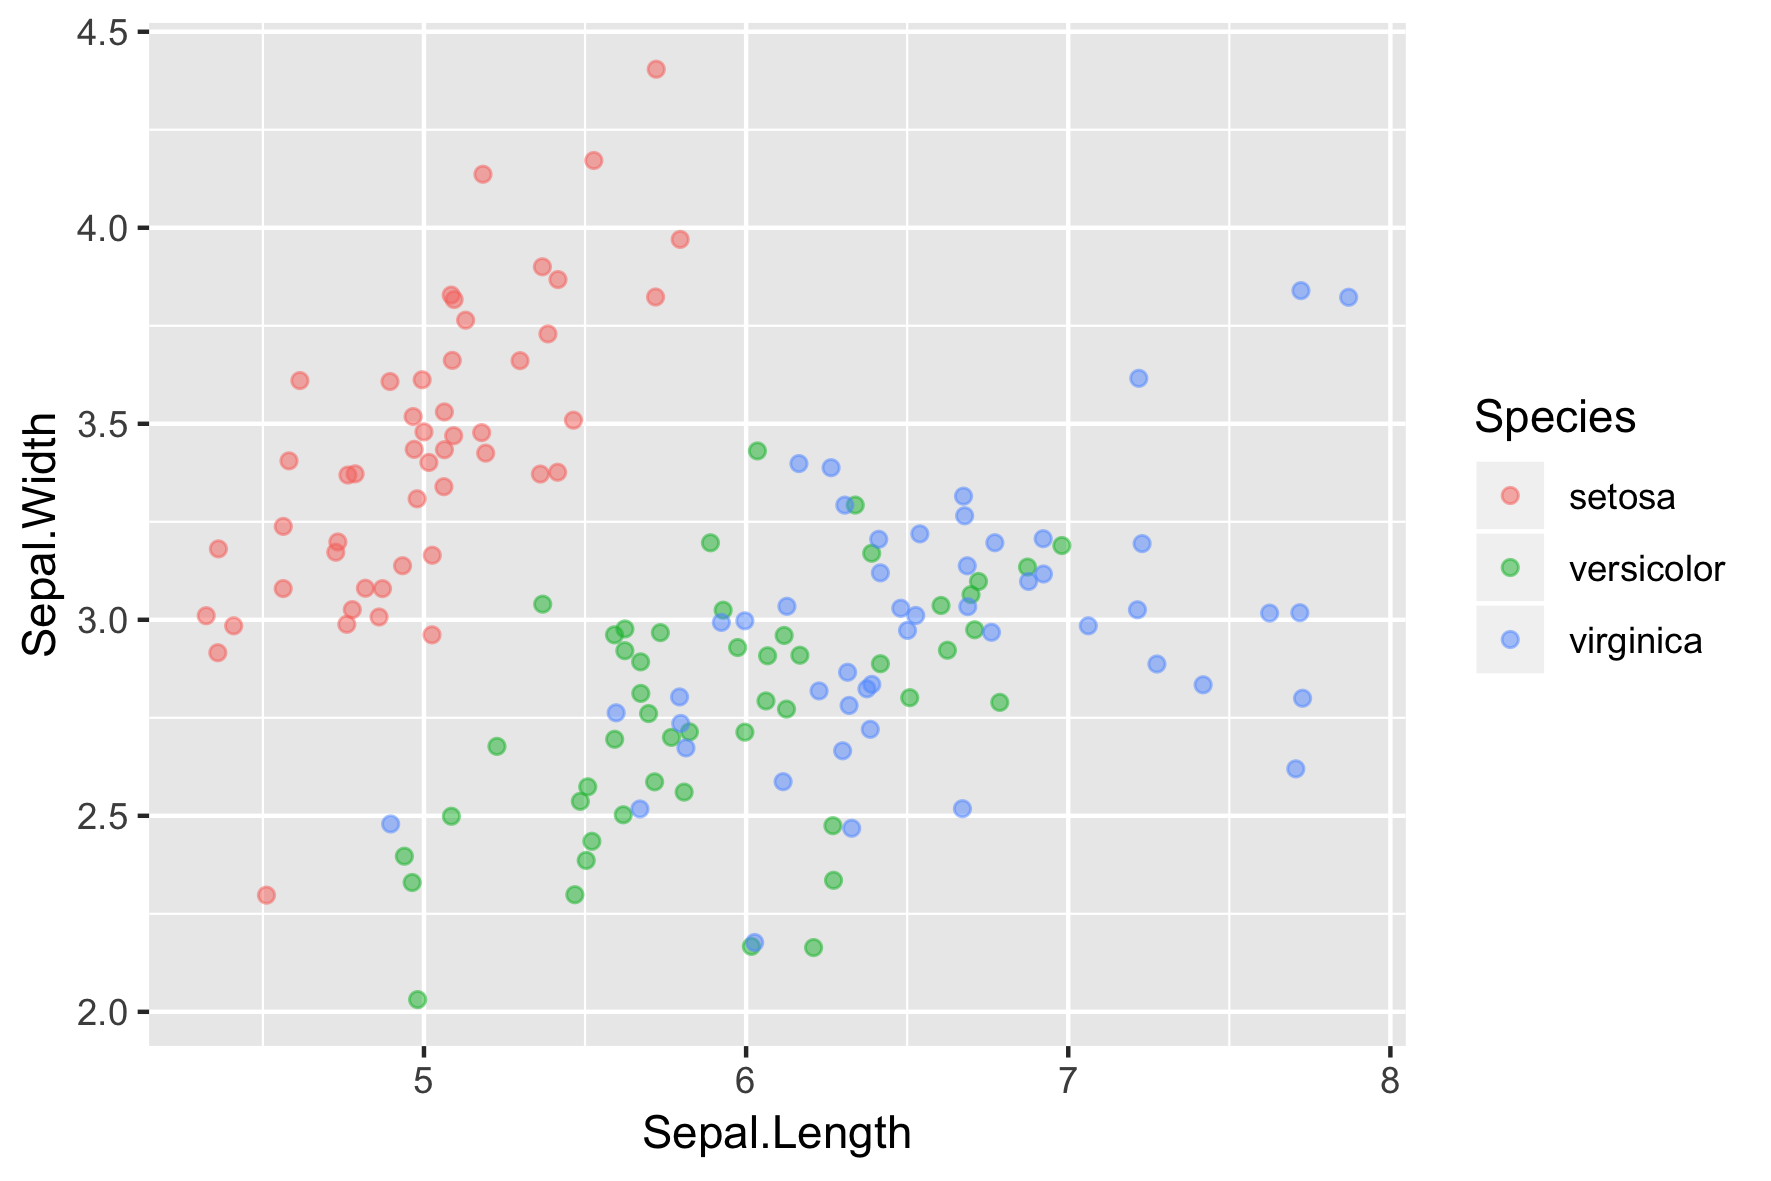
position_jitter()
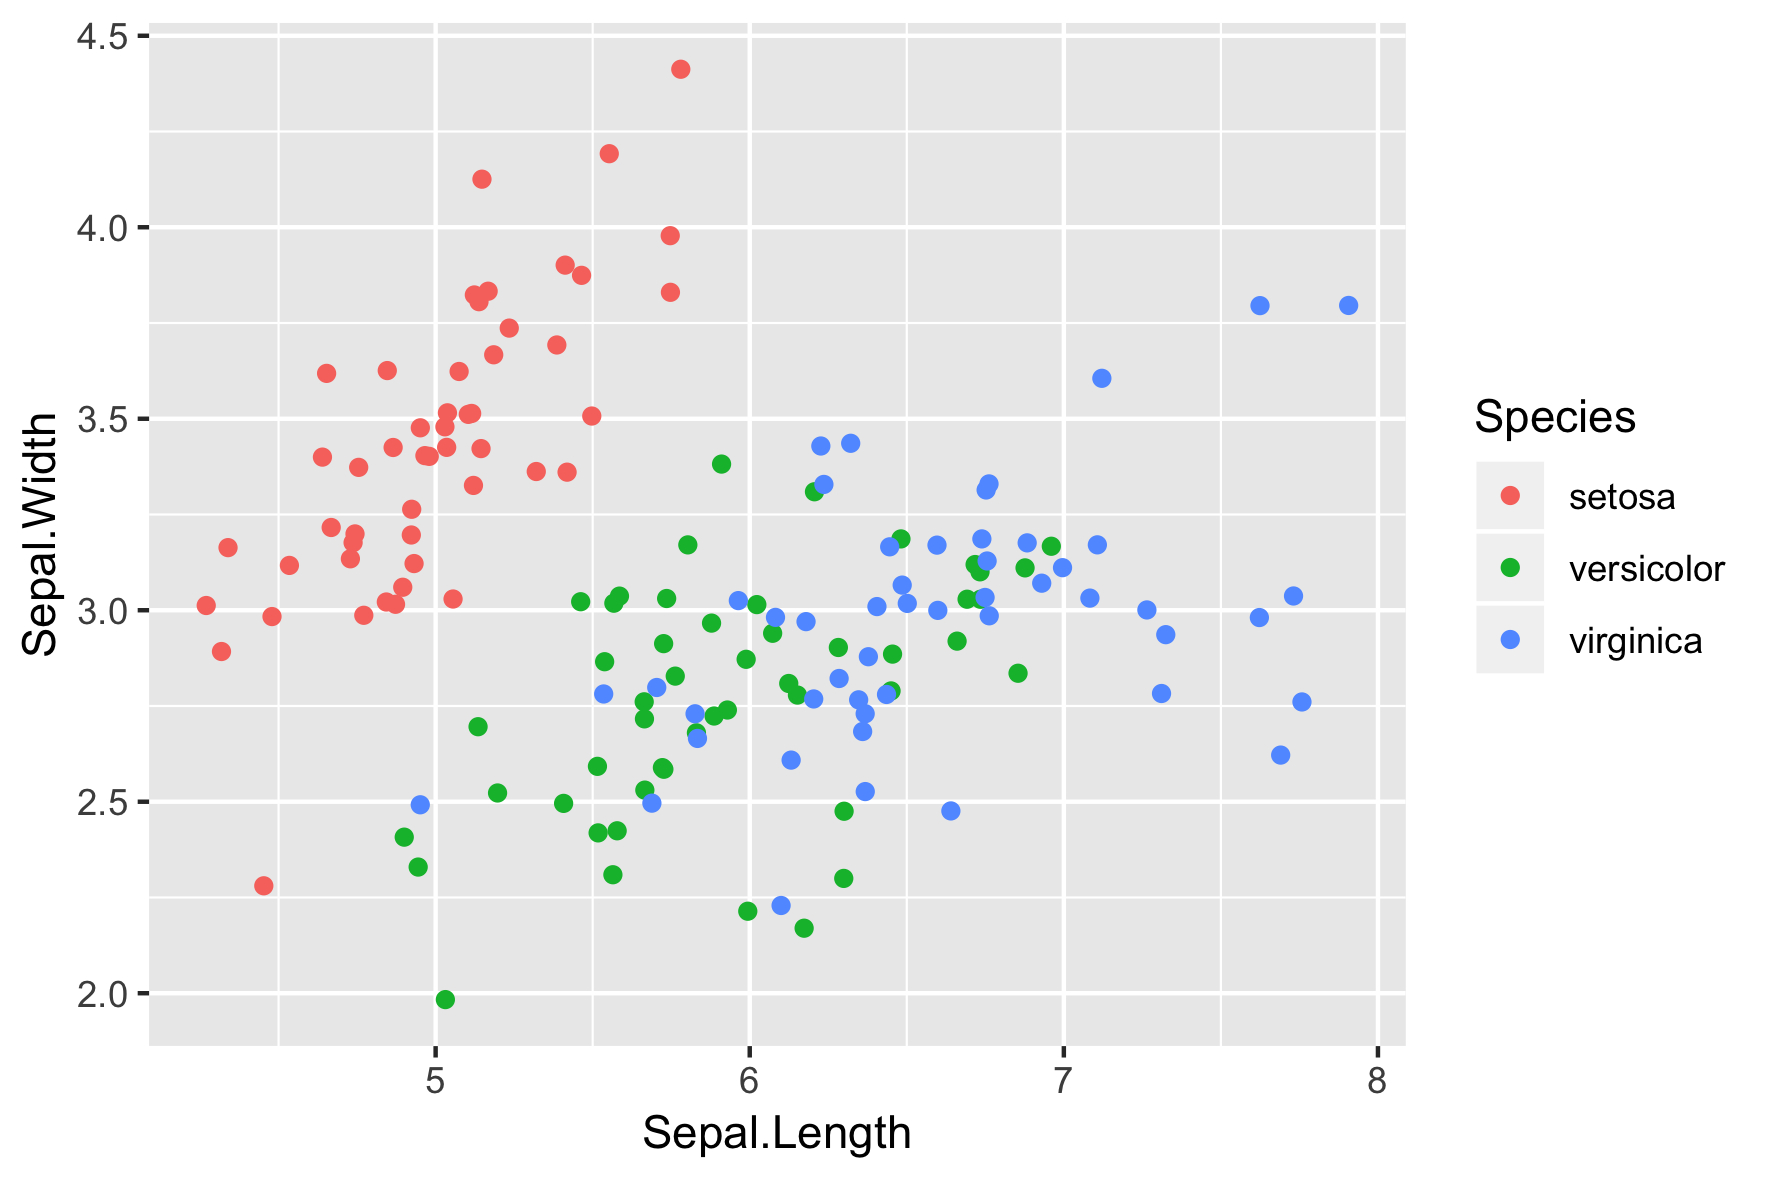
position_jitter()
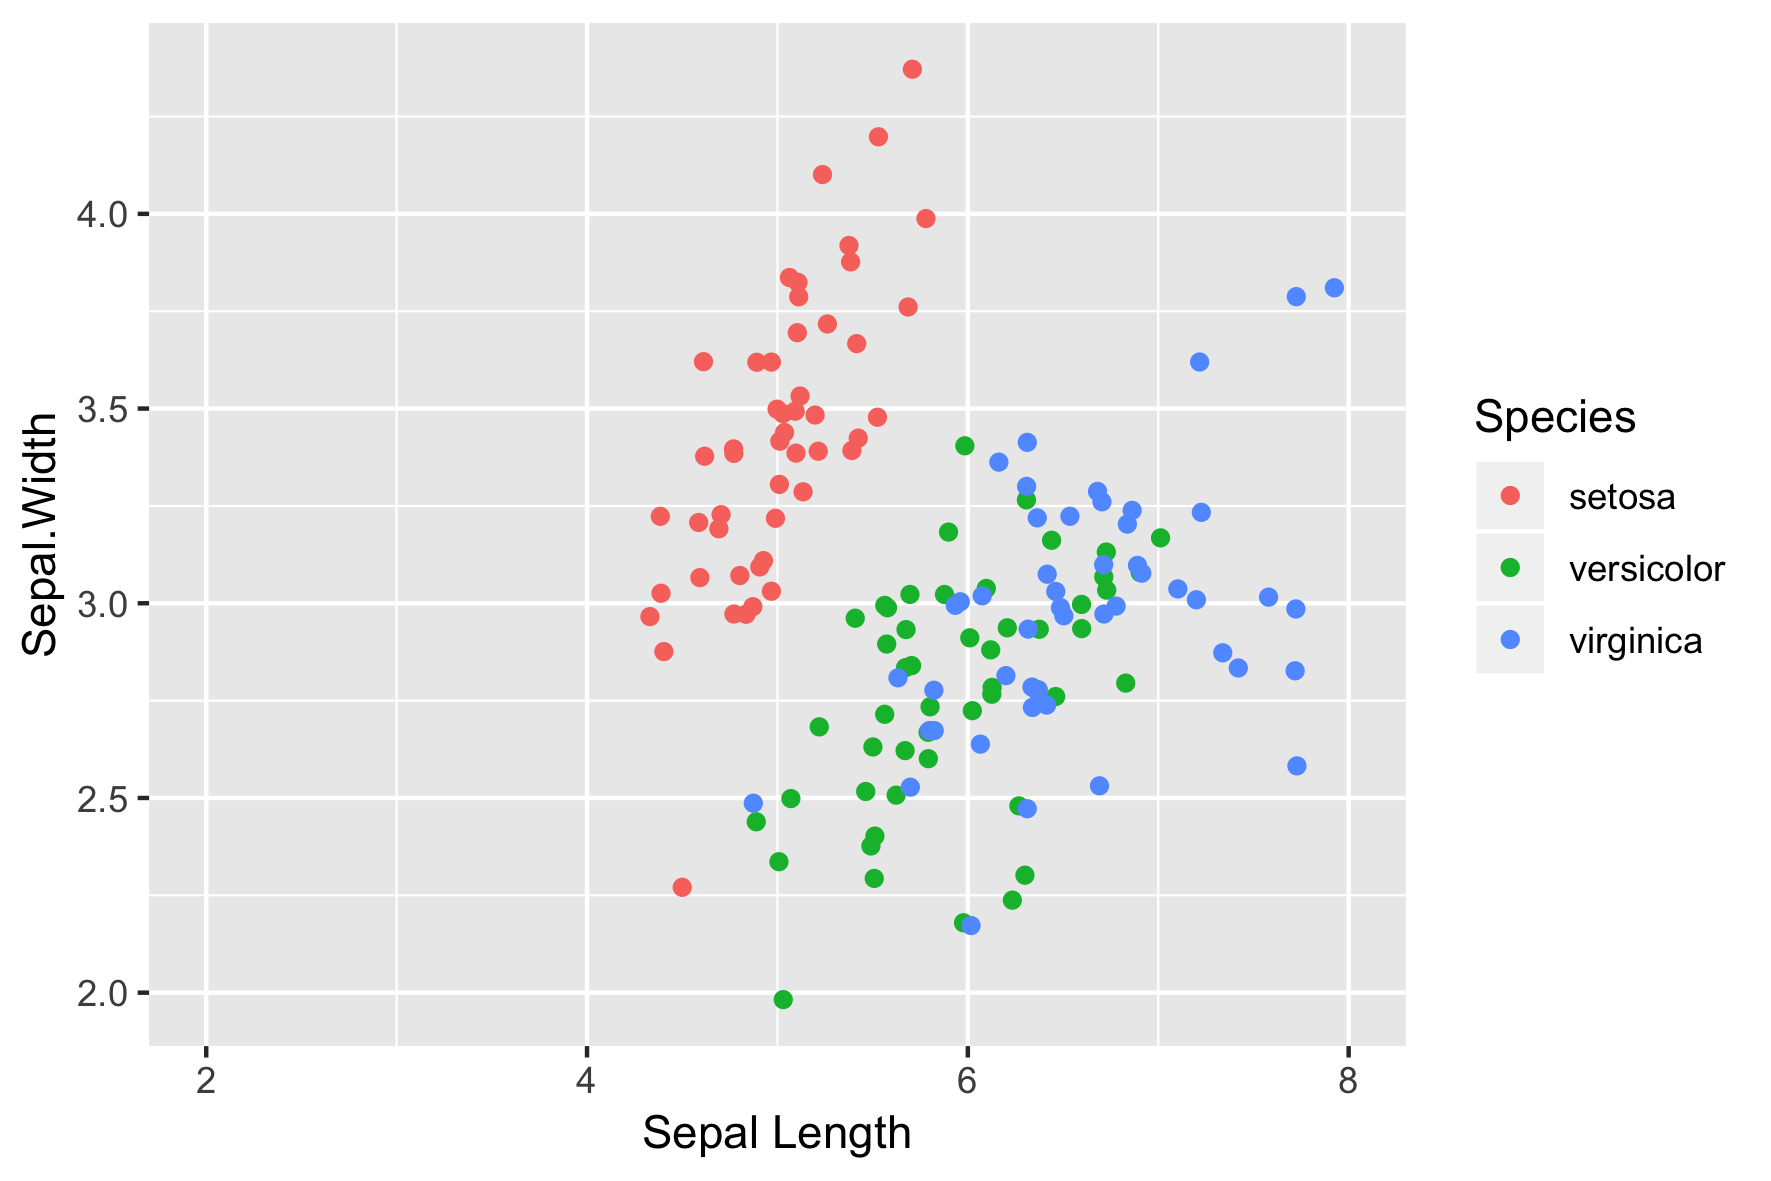
scale_*_*()
El argumento de los límites
El argumento de las pausas
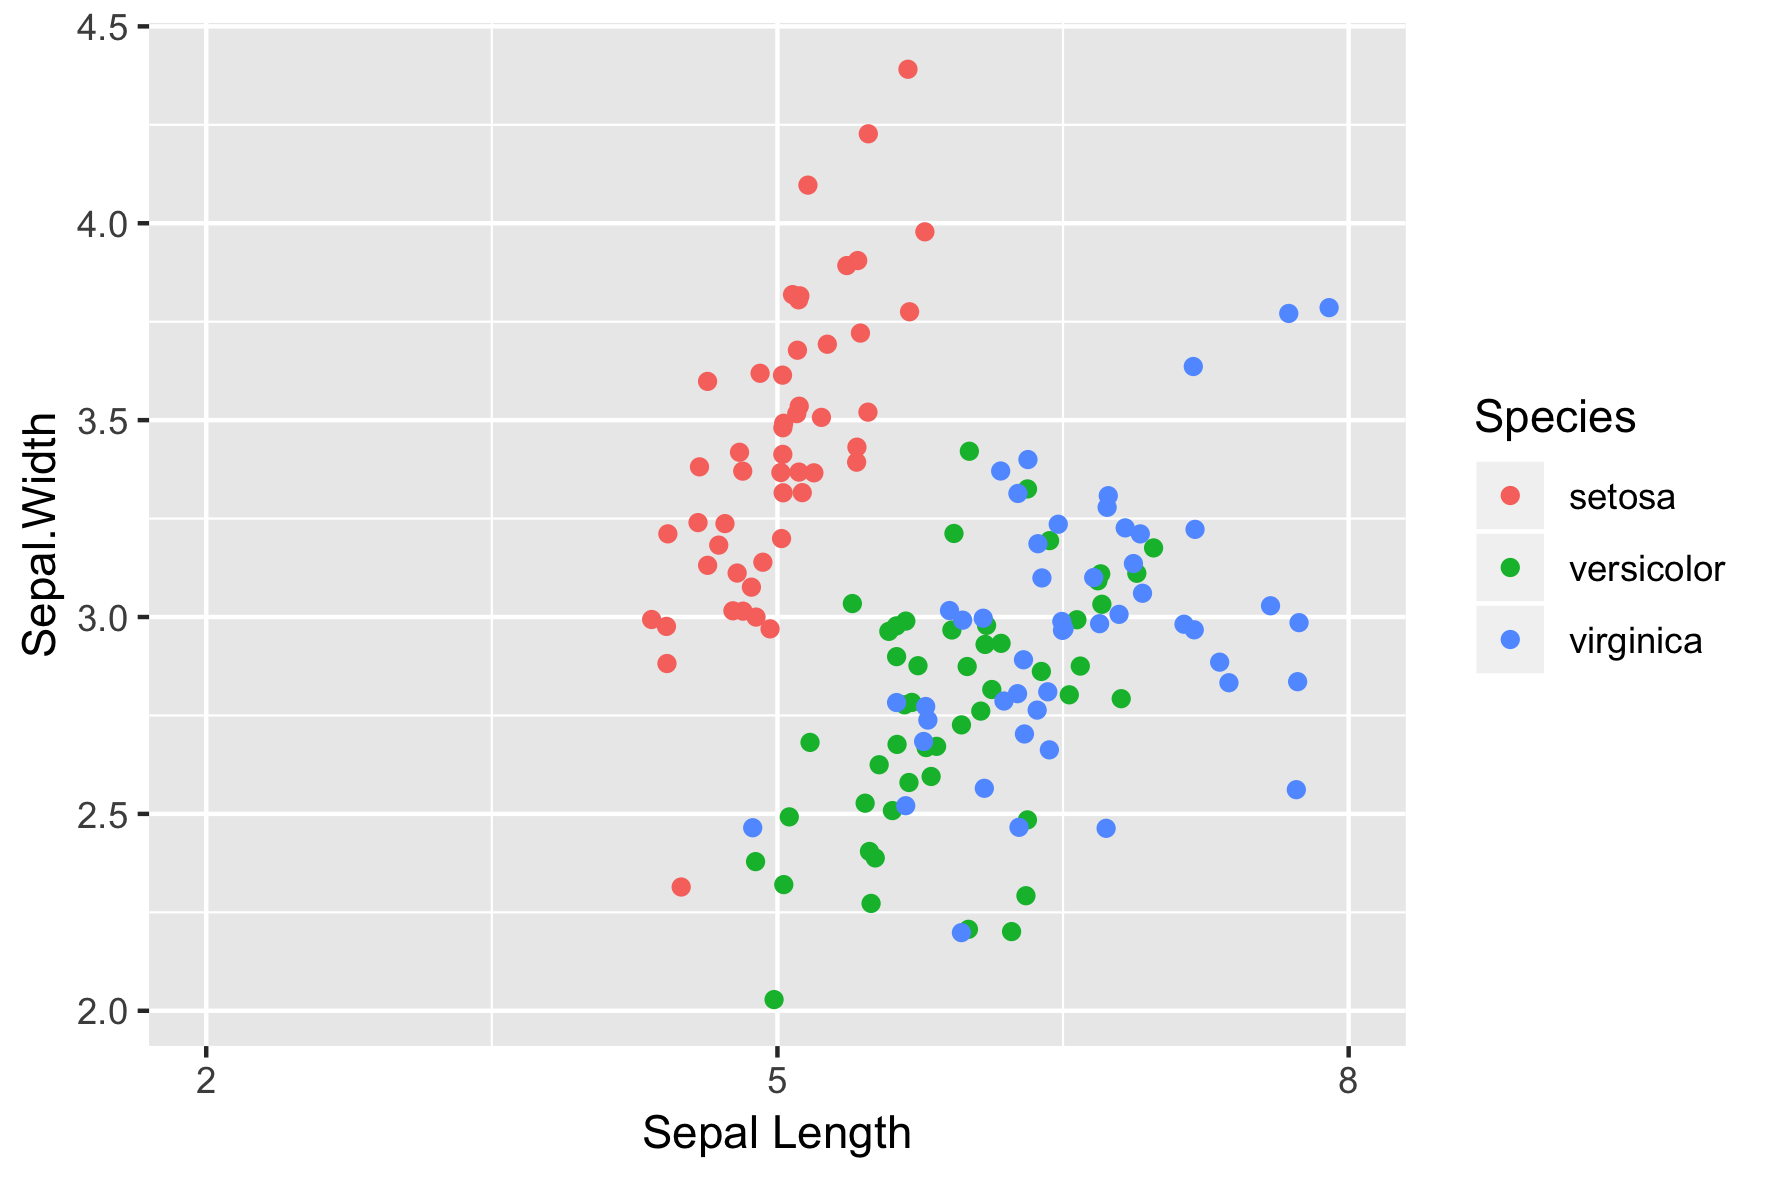
El argumento expandir
El argumento etiquetas
labs()