Utilizar atributos
Introducción a la visualización de datos con ggplot2

Rick Scavetta
Founder, Scavetta Academy
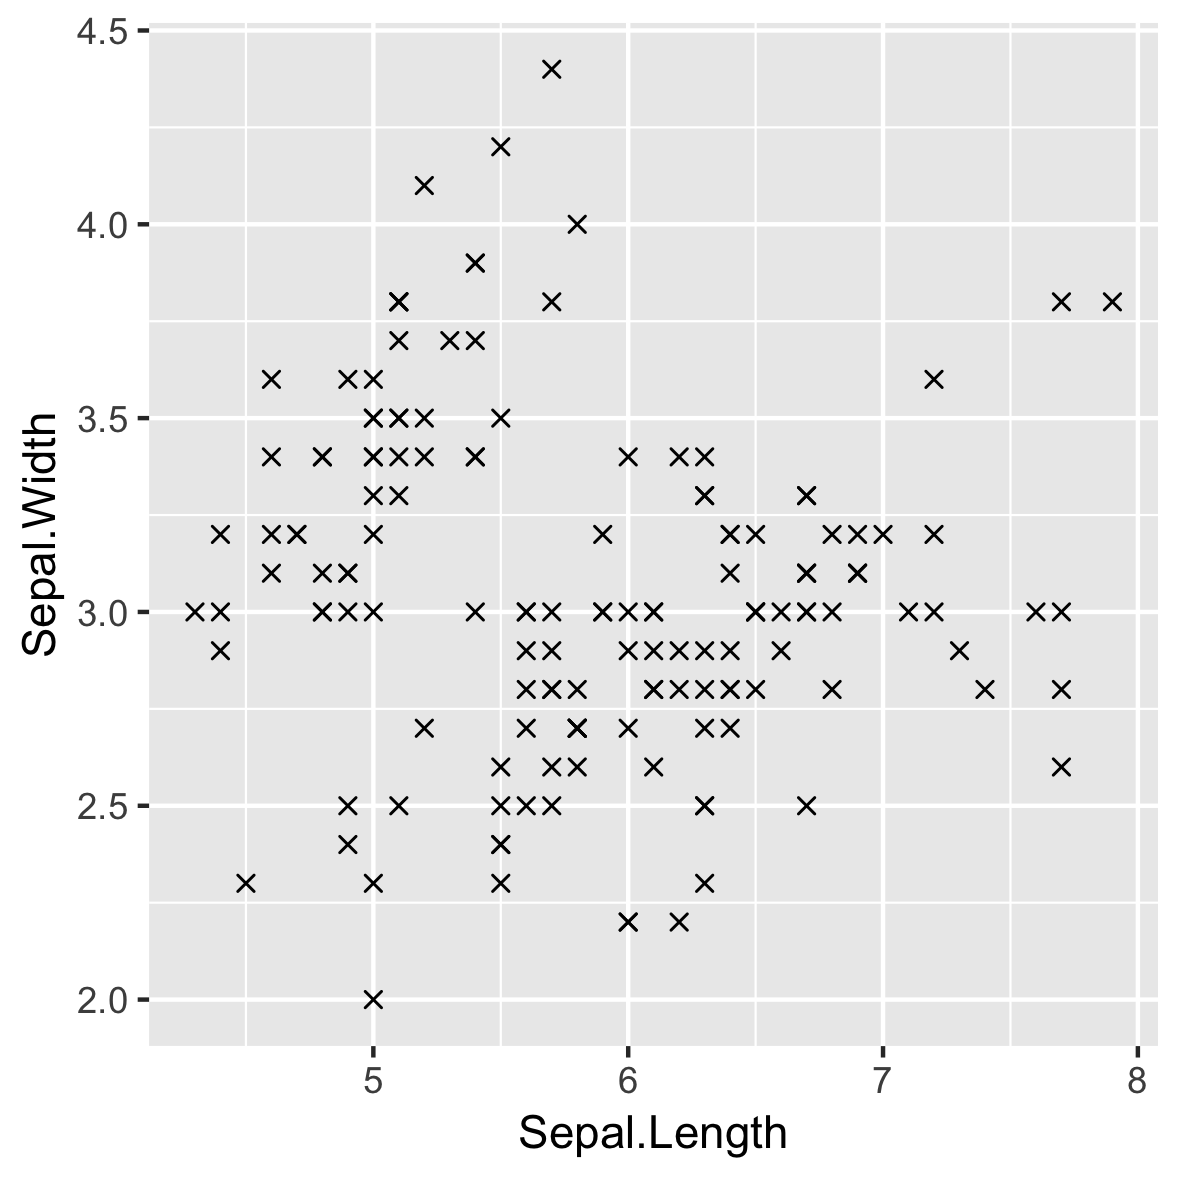
¿Estética? ¡Atributos!
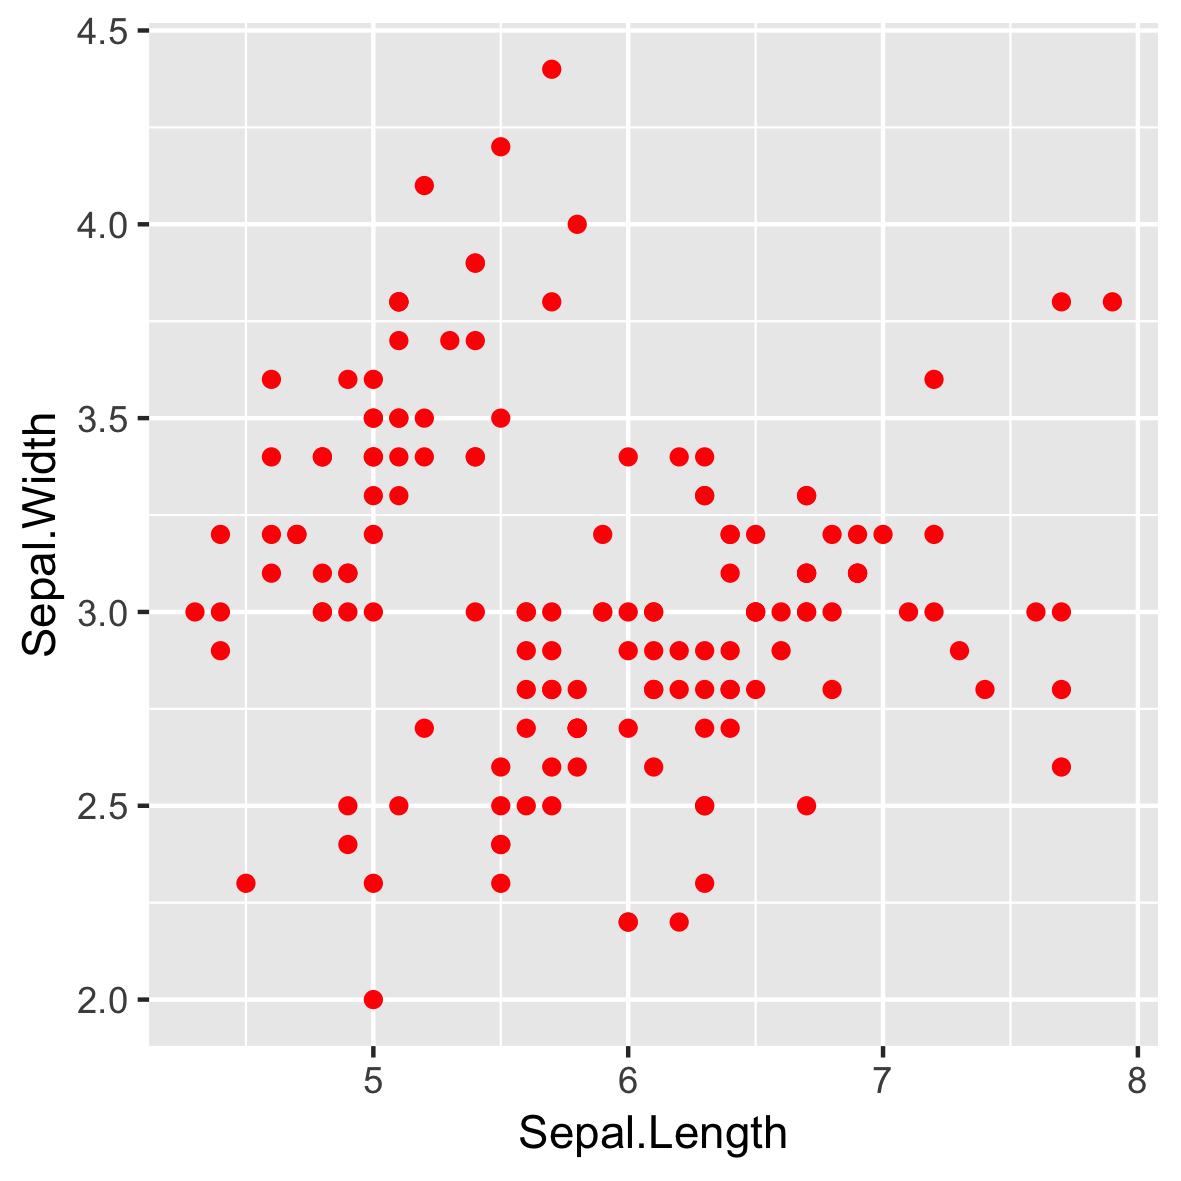
¿Estética? ¡Atributos!
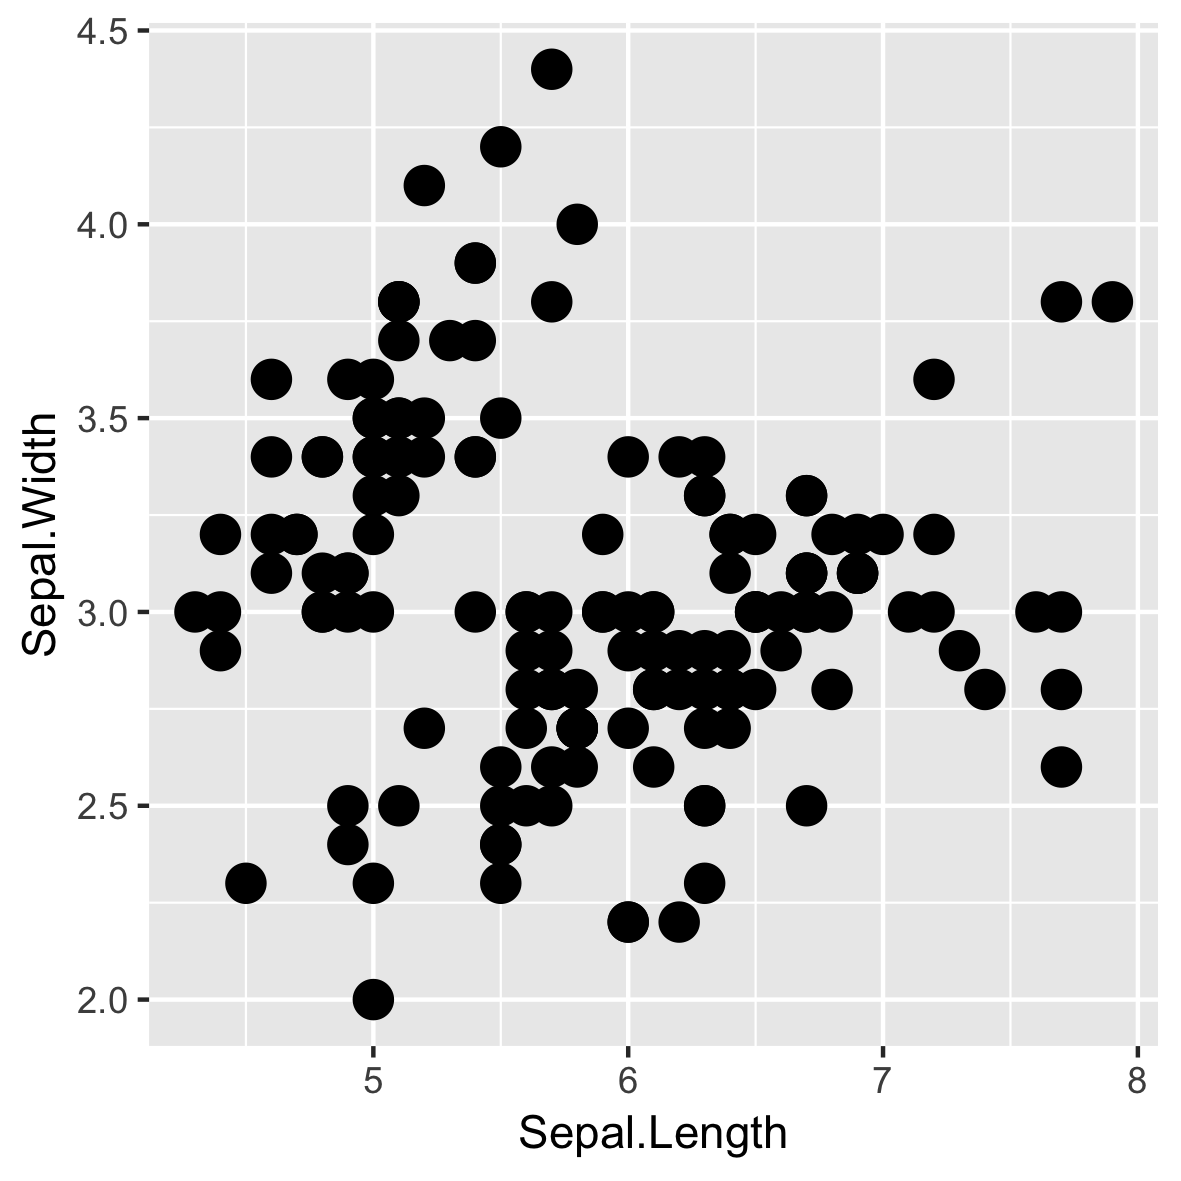
¿Estética? ¡Atributos!
Introducción a la visualización de datos con ggplot2
Rick Scavetta
Founder, Scavetta Academy

