Buenas prácticas estéticas
Introducción a la visualización de datos con ggplot2

Rick Scavetta
Founder, Scavetta Academy
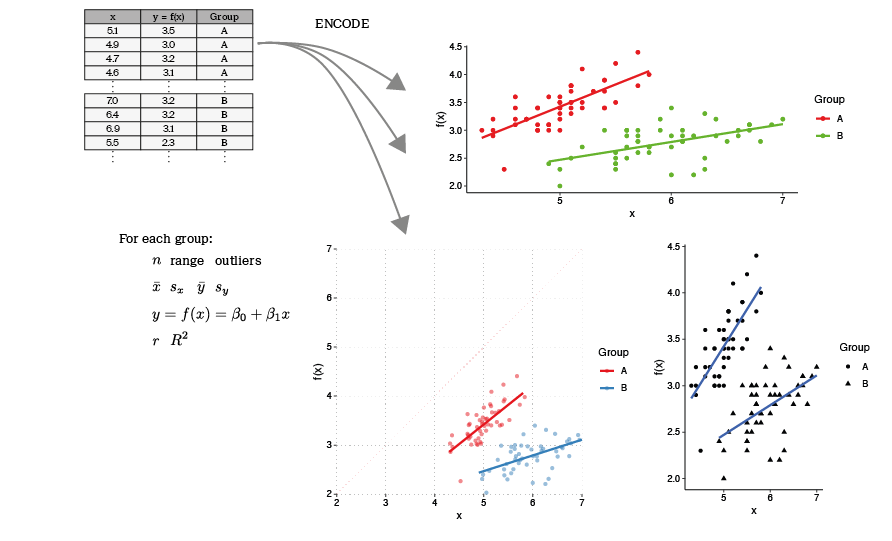
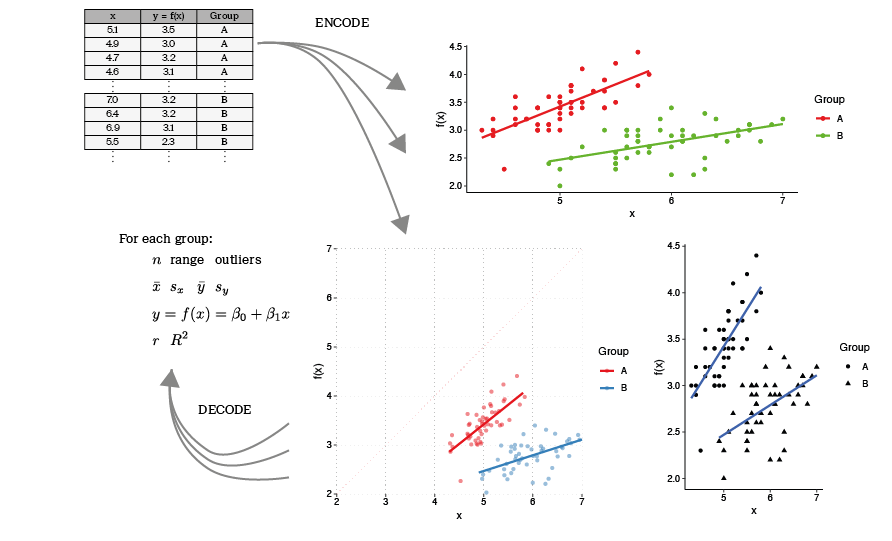
La forma sigue a la función
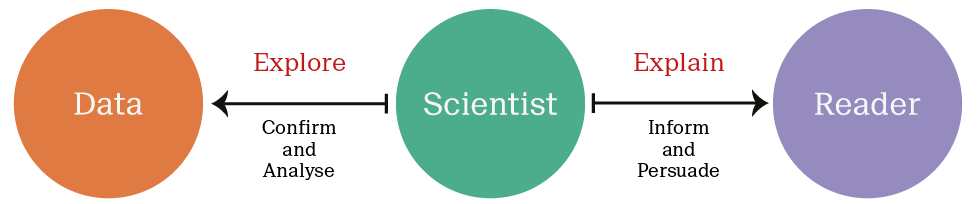
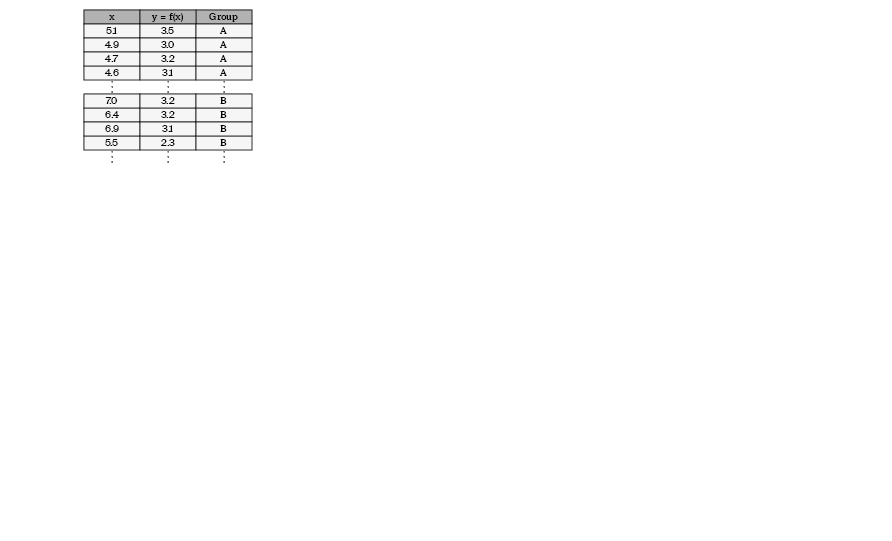

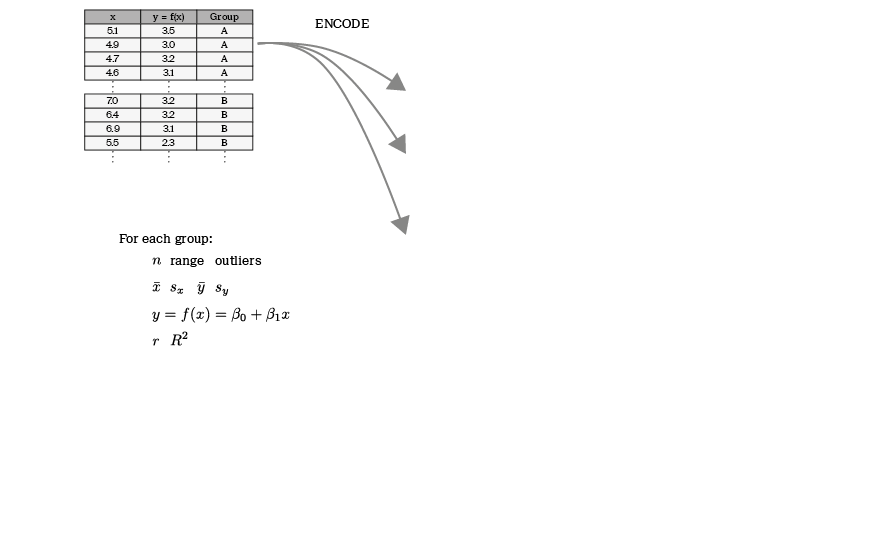
Extraer información de los datos

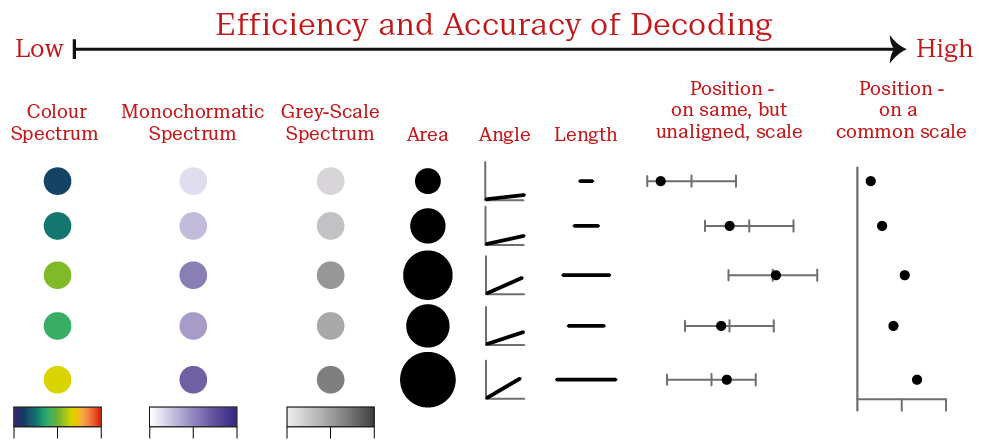
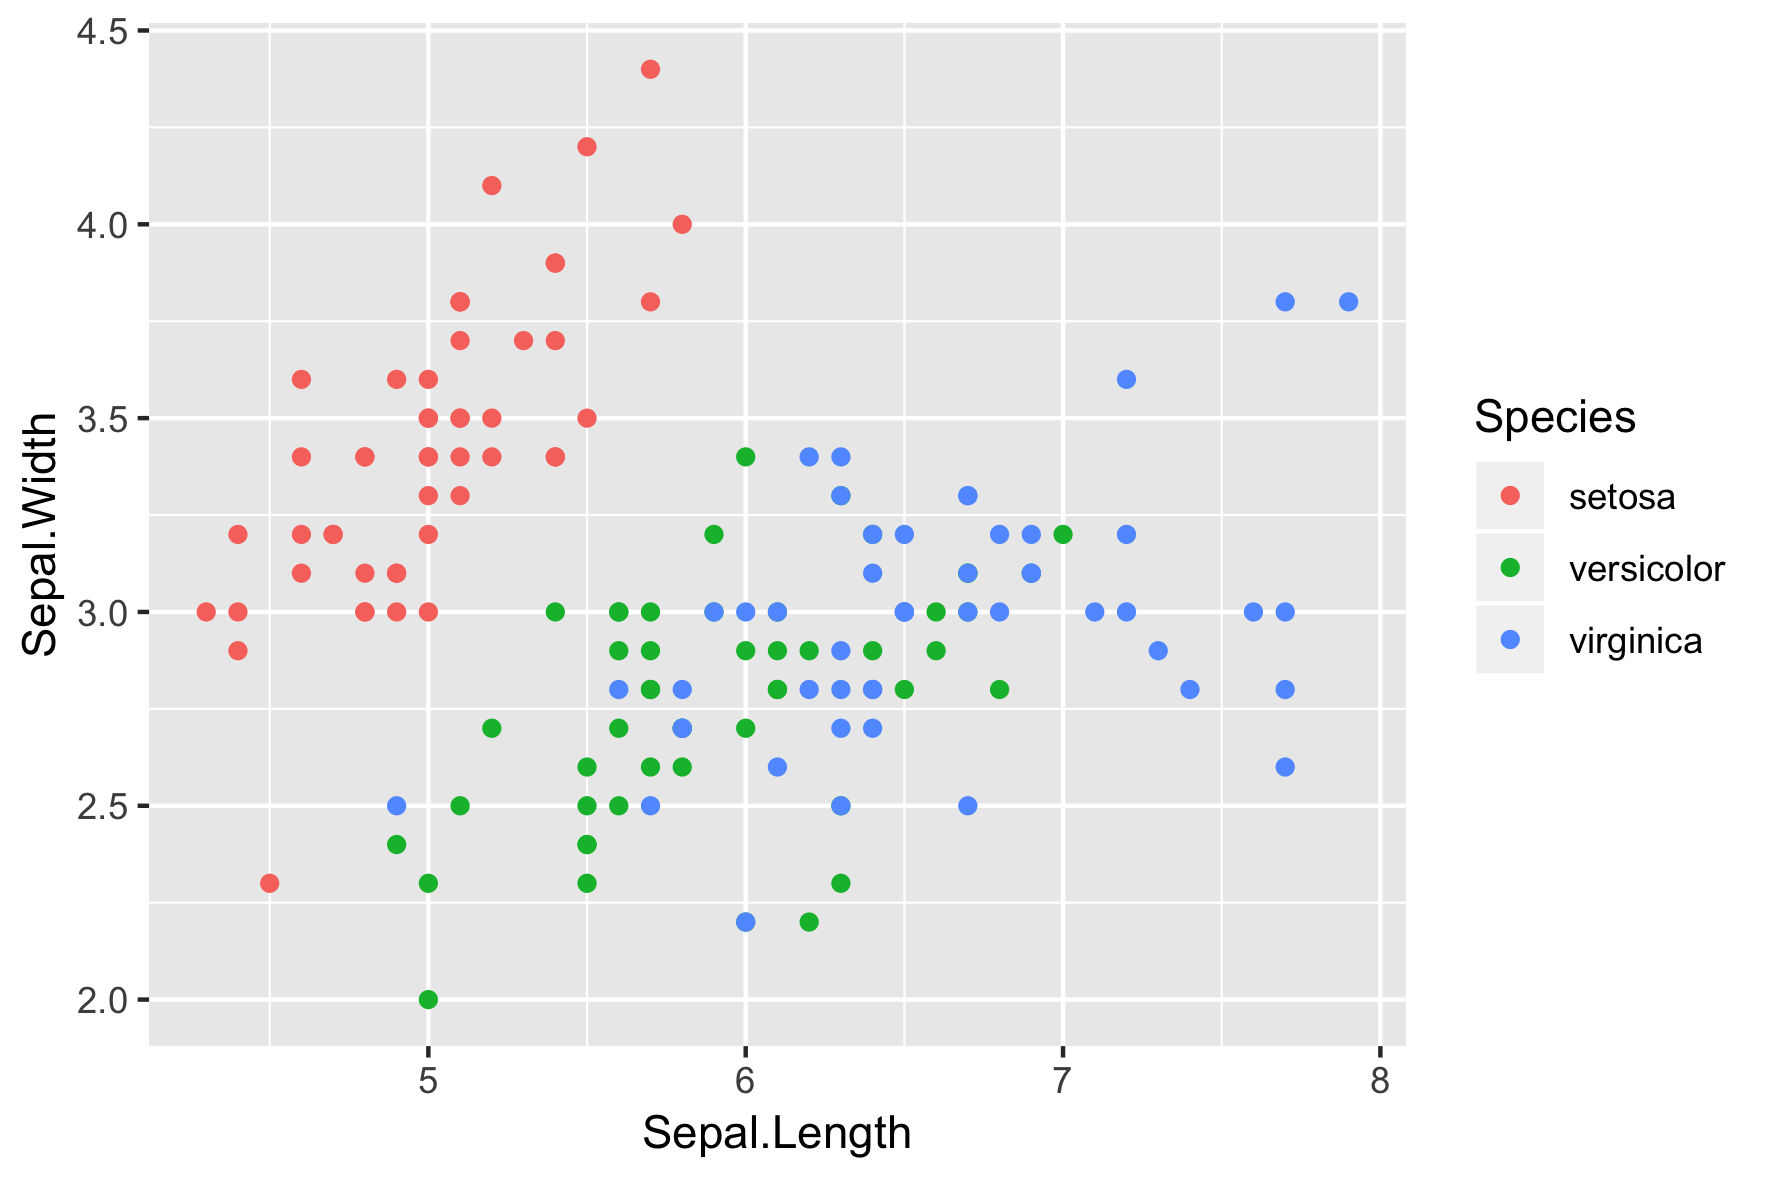
Estética - variables continuas

Estética - variables continuas
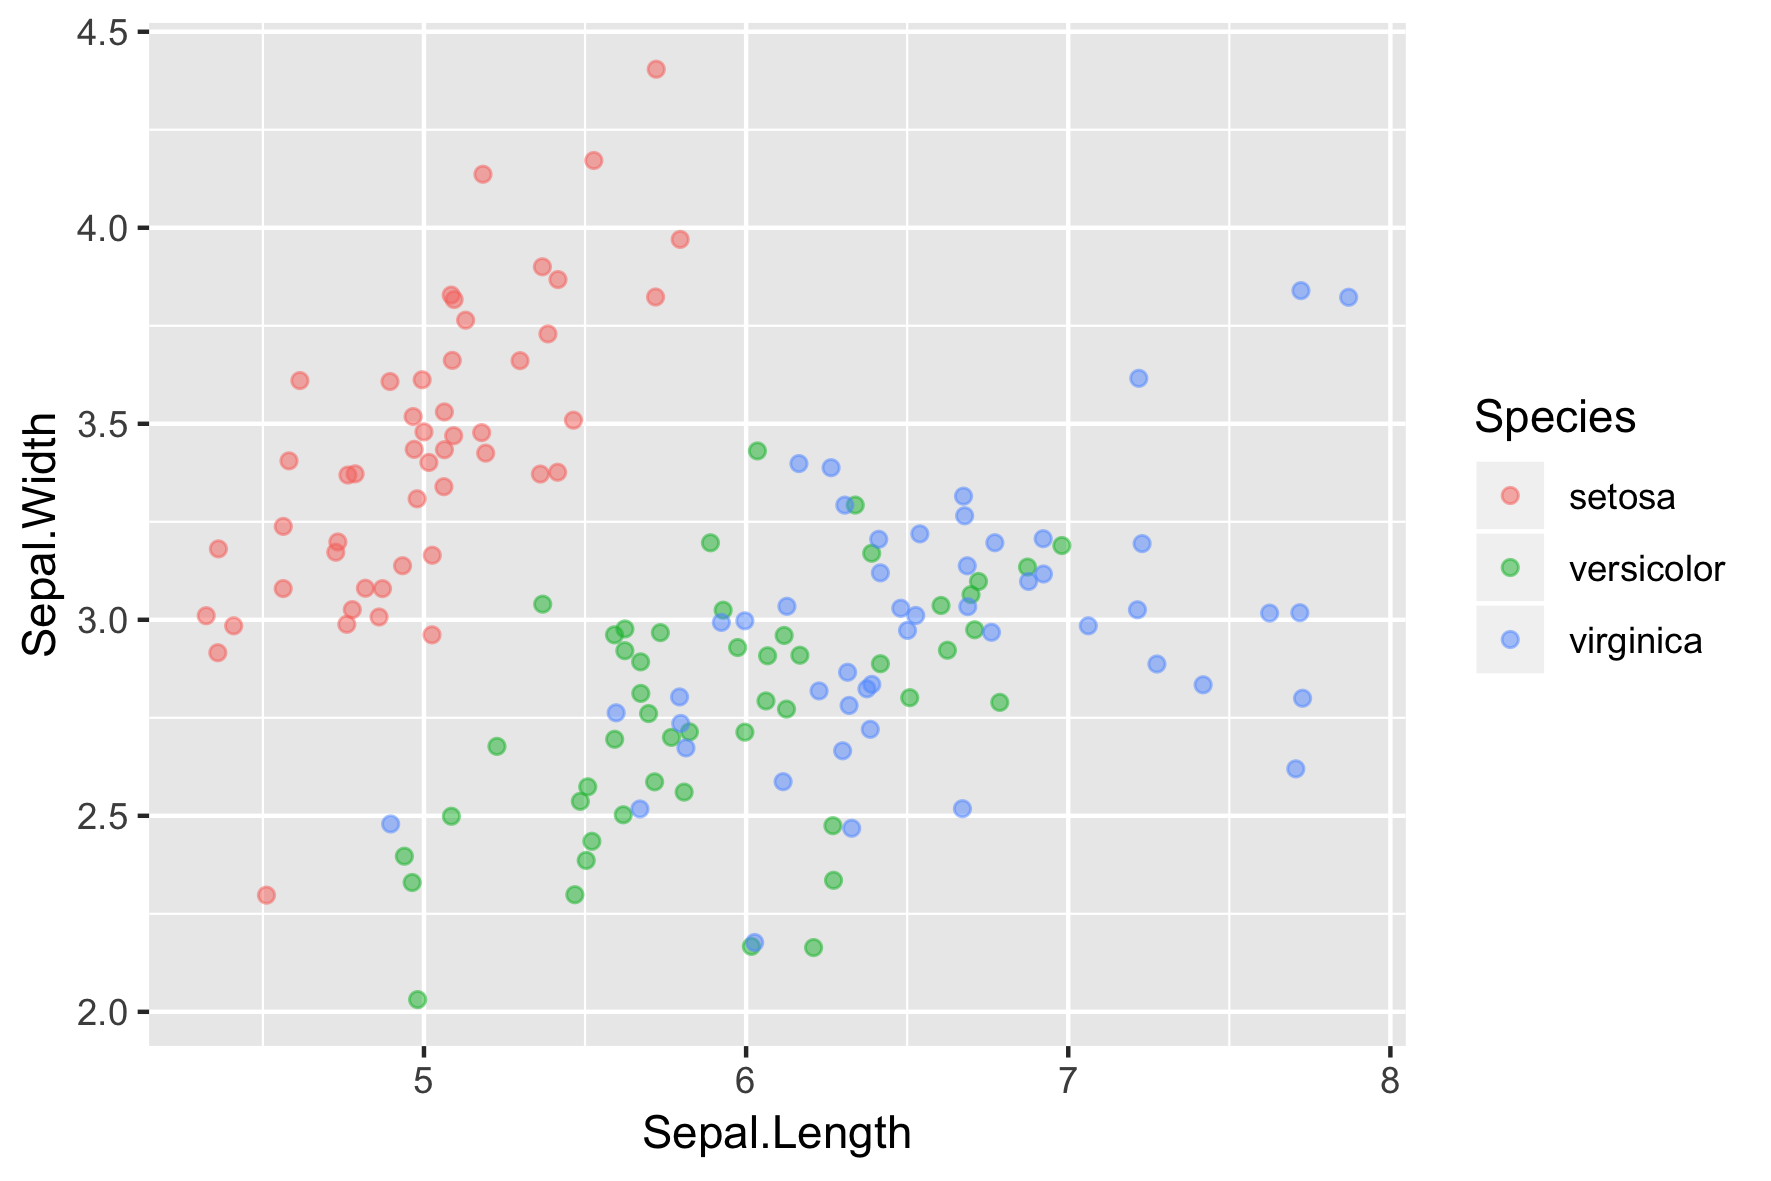
Tres gráficos de dispersión del iris
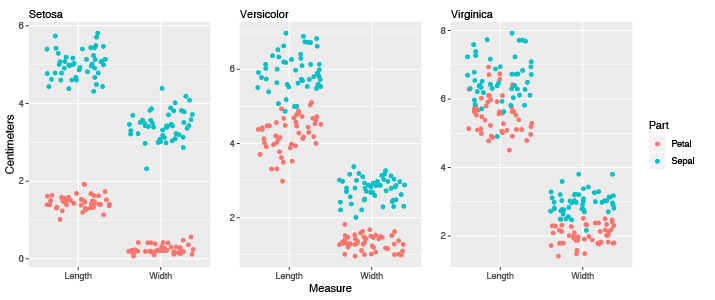
Tres gráficos de dispersión del iris, ejes y no alineados
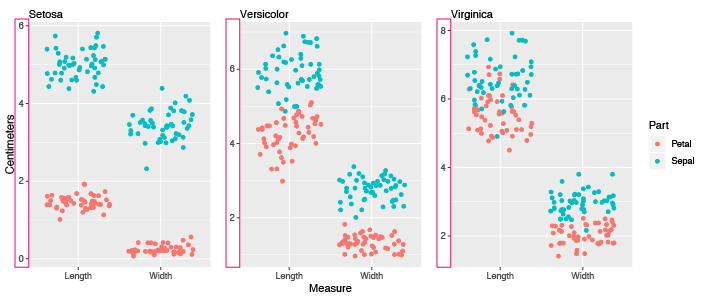
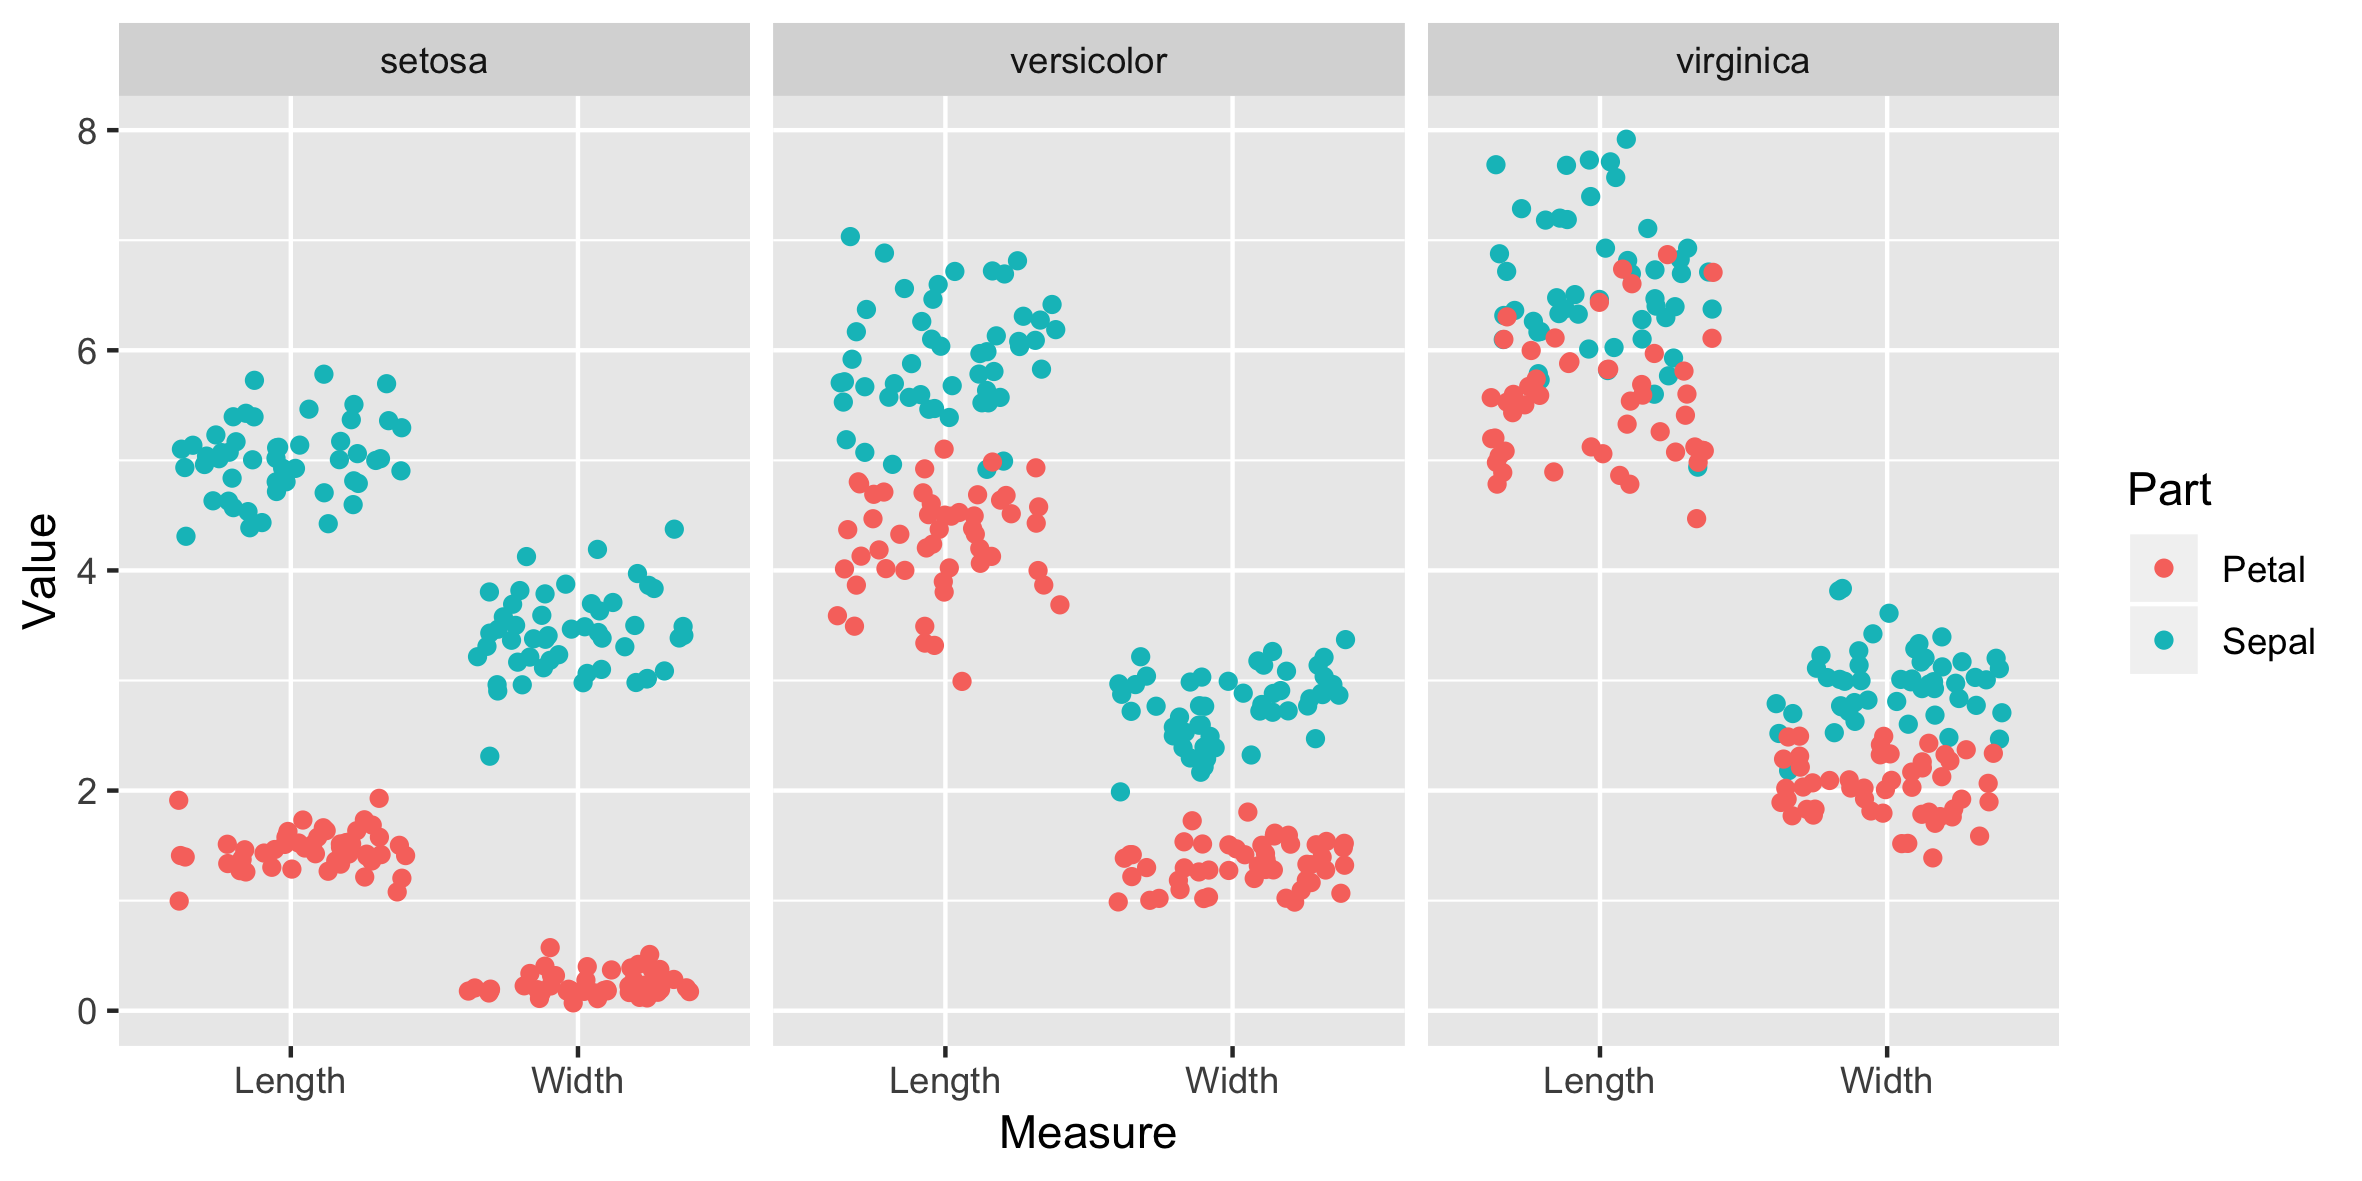
Gráfico de una sola faceta, eje y común
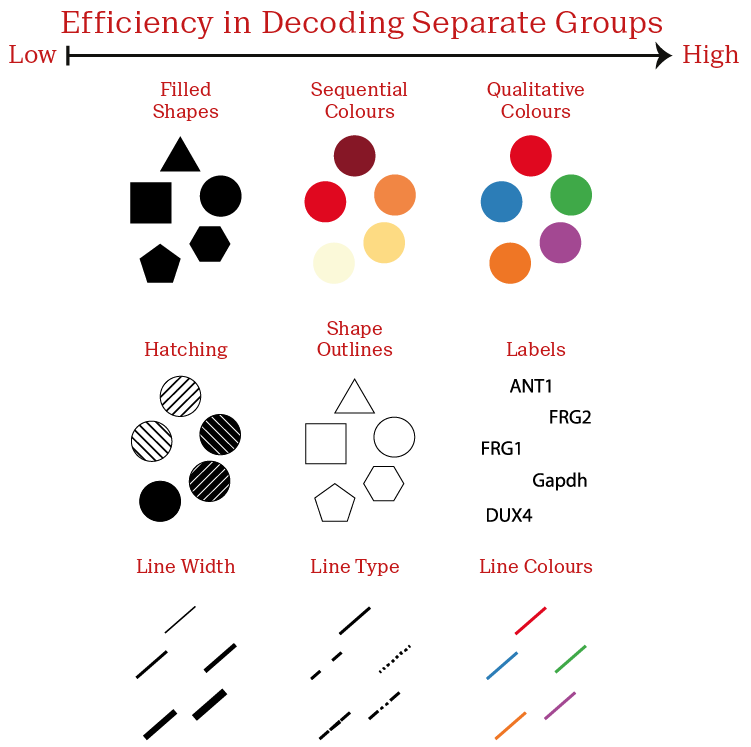
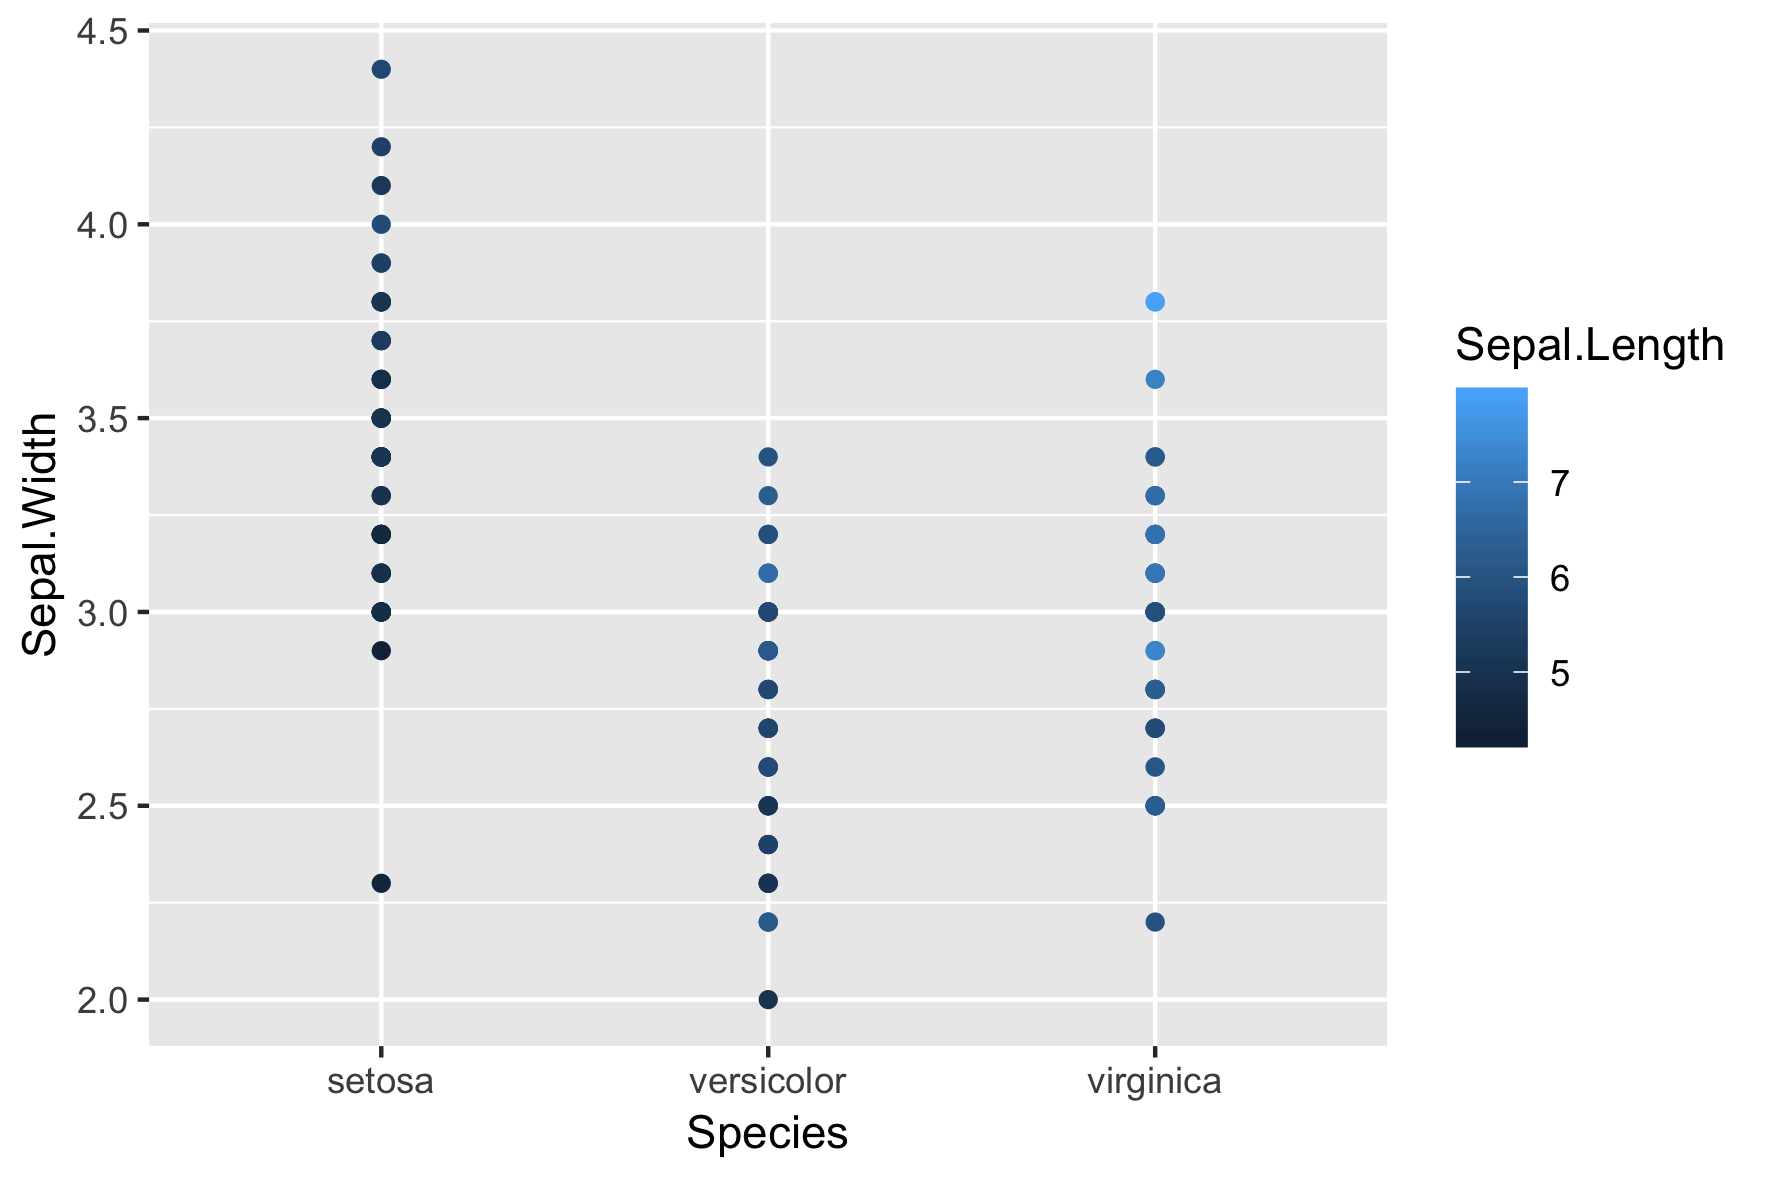
Estética - variables categóricas
Estética - variables categóricas