Medidas de dispersión
Introducción a la estadística en R

Maggie Matsui
Content Developer, DataCamp
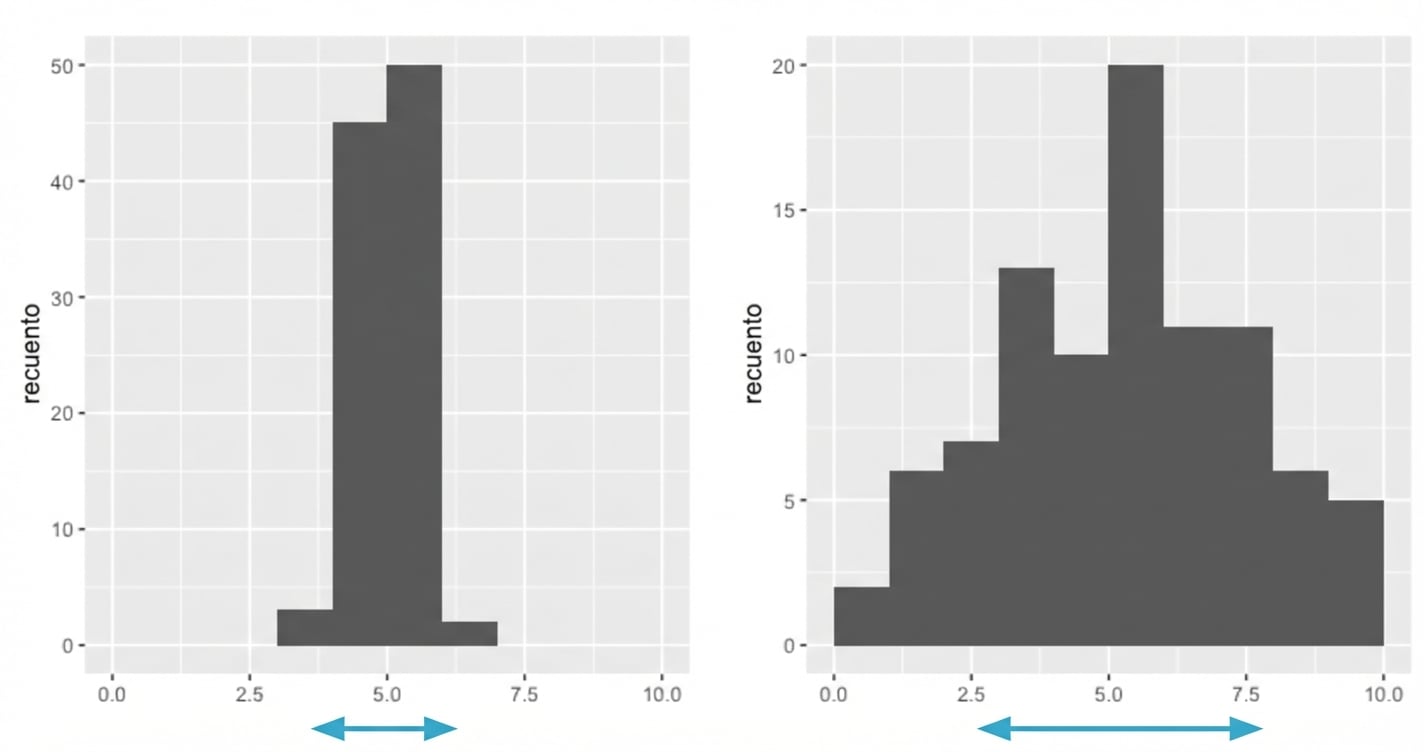
¿Qué es la dispersión?
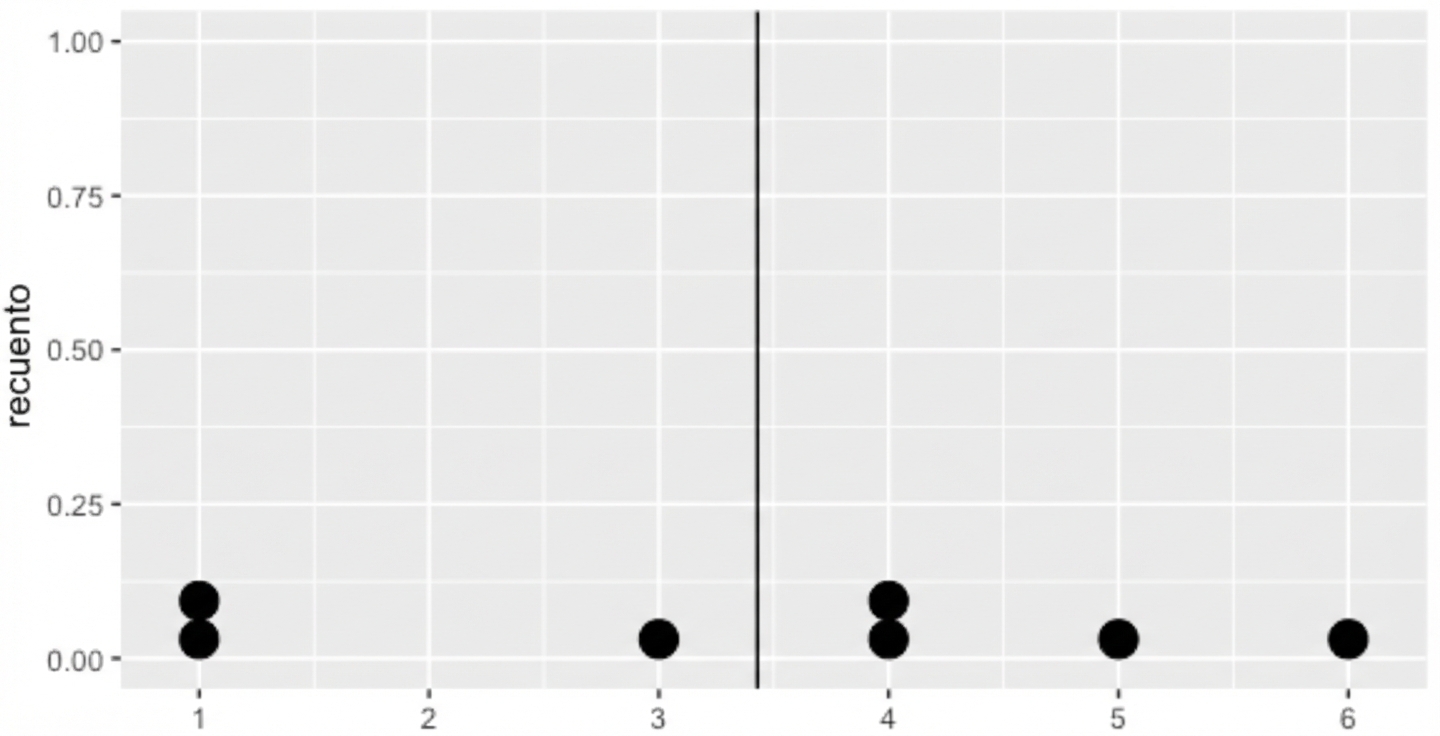
Varianza
Distancia promedio de cada punto de datos a la media de los datos
Cálculo de la varianza
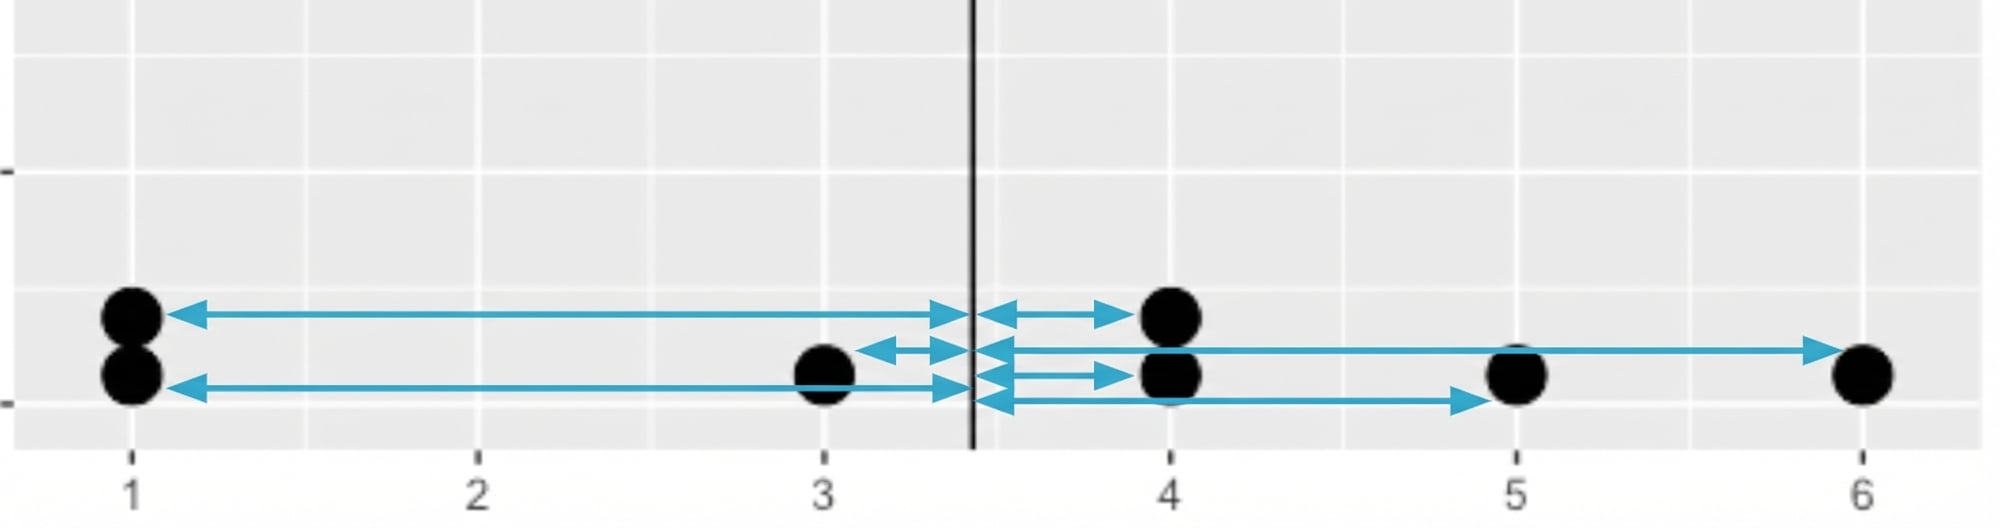
dists <- msleep$sleep_total - mean(msleep$sleep_total)
dists
1.66626506 6.56626506 ... -4.13373494 2.06626506 -0.63373494
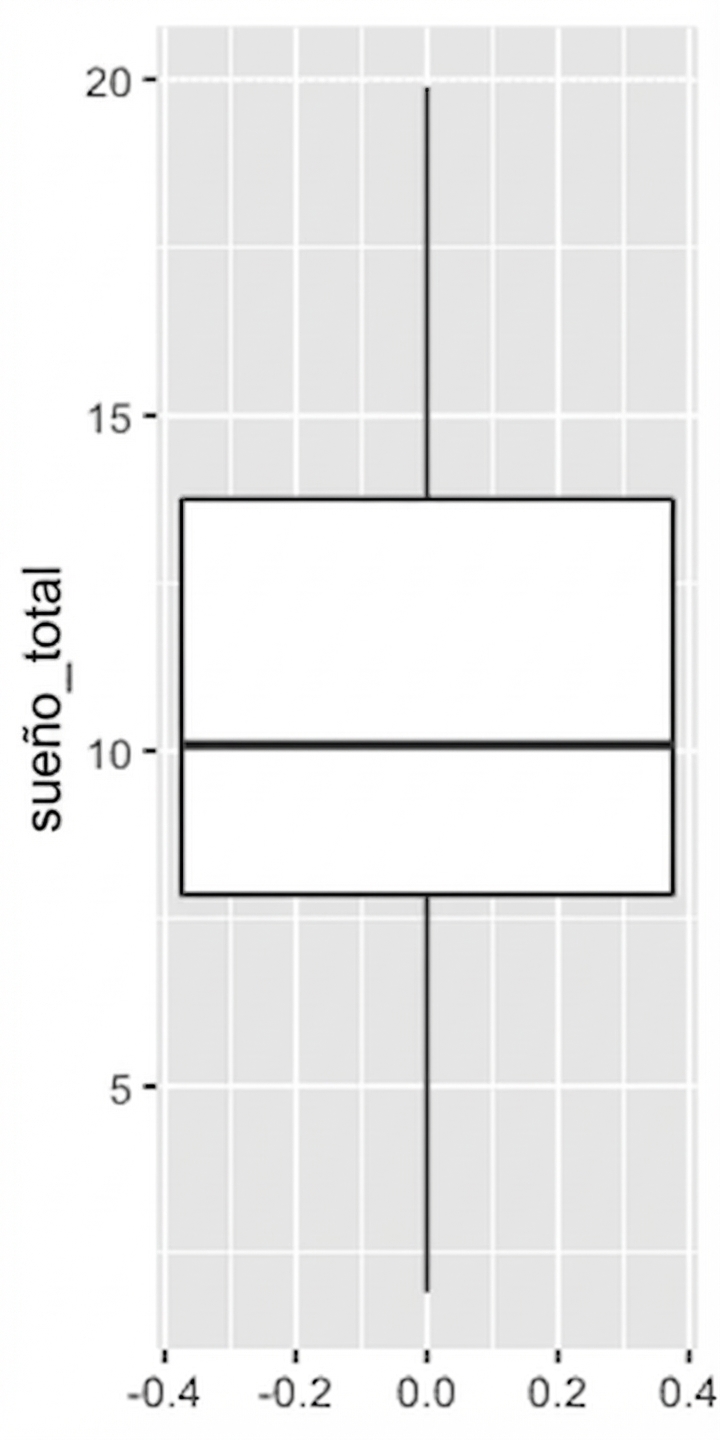
Los diagramas de caja utilizan cuartiles